

Sezeryadigar
Introduction
I always like to begin my articles with a recap of any previous relevant coverage I’ve had on a stock. In Dollar Tree’s (NASDAQ:DLTR) case, I had the good fortune of buying the stock during the March 2020 crash, which I wrote about a few months later in my article “Stocks I Bought On The Dip: Dollar Tree“, then followed up with an article after I had taken profits in the position titled “Dollar Tree Stock: A Valuation Case Study“. I owned Dollar Tree stock from 3/13/20 through 11/22/21. Here are the returns over that time period.
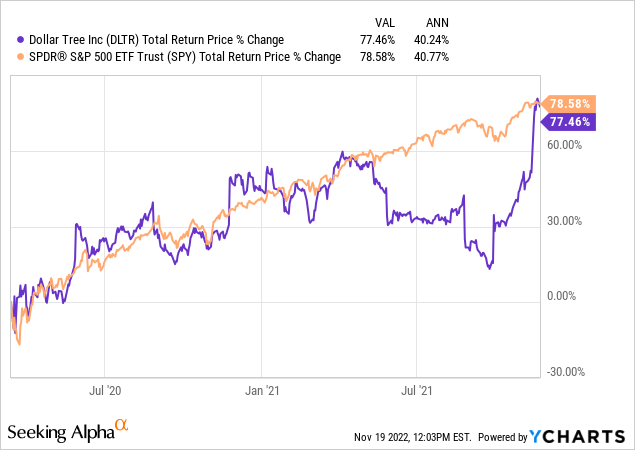
The absolute return was very good, about 40% annualized, and it ended up performing about the same as the S&P 500 during this time period.
I’ve written one additional Dollar Tree article since I took profits. I was on August 26th of this year, just after the stock had experienced a massive sell-off. I rated Dollar Tree stock a “Hold” at that time based on valuation.
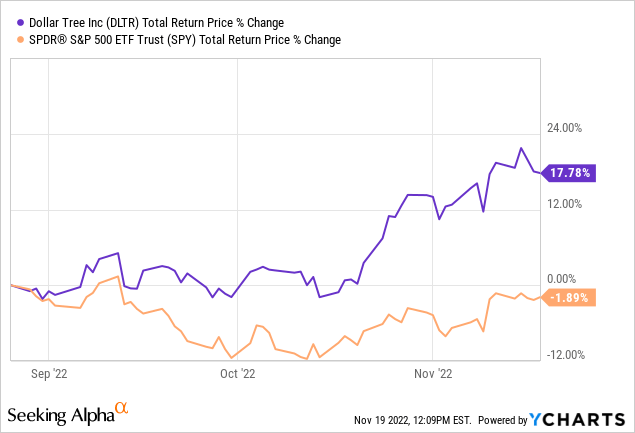
It has performed pretty well since then, especially compared to the S&P 500 index.
In this article, I am going to share an updated valuation analysis since the price has risen quite a bit in a short period of time, and I’ll also share some commentary about why I think Dollar Tree might become a “safe haven” stock in 2023.
My Valuation Method For Dollar Tree
The valuation method I use for Dollar Tree first checks to see how cyclical earnings have been historically. Once it is determined that earnings aren’t too cyclical, then I use a combination of earnings, earnings growth, and P/E mean reversion to estimate future returns based on previous earnings growth and sentiment patterns. I take those expectations and apply them 10 years into the future, and then convert the results into an expected CAGR percentage. If the expected return is really good, I will buy the stock, and if it’s really low, I will often sell the stock. In this article, I will take readers through each step of this process.
Importantly, once it is established that a business has a long history of relatively stable and predictable earnings growth, it doesn’t really matter to me what the business does. If it consistently makes more money over the course of each economic cycle, that’s what I care about.
FAST Graphs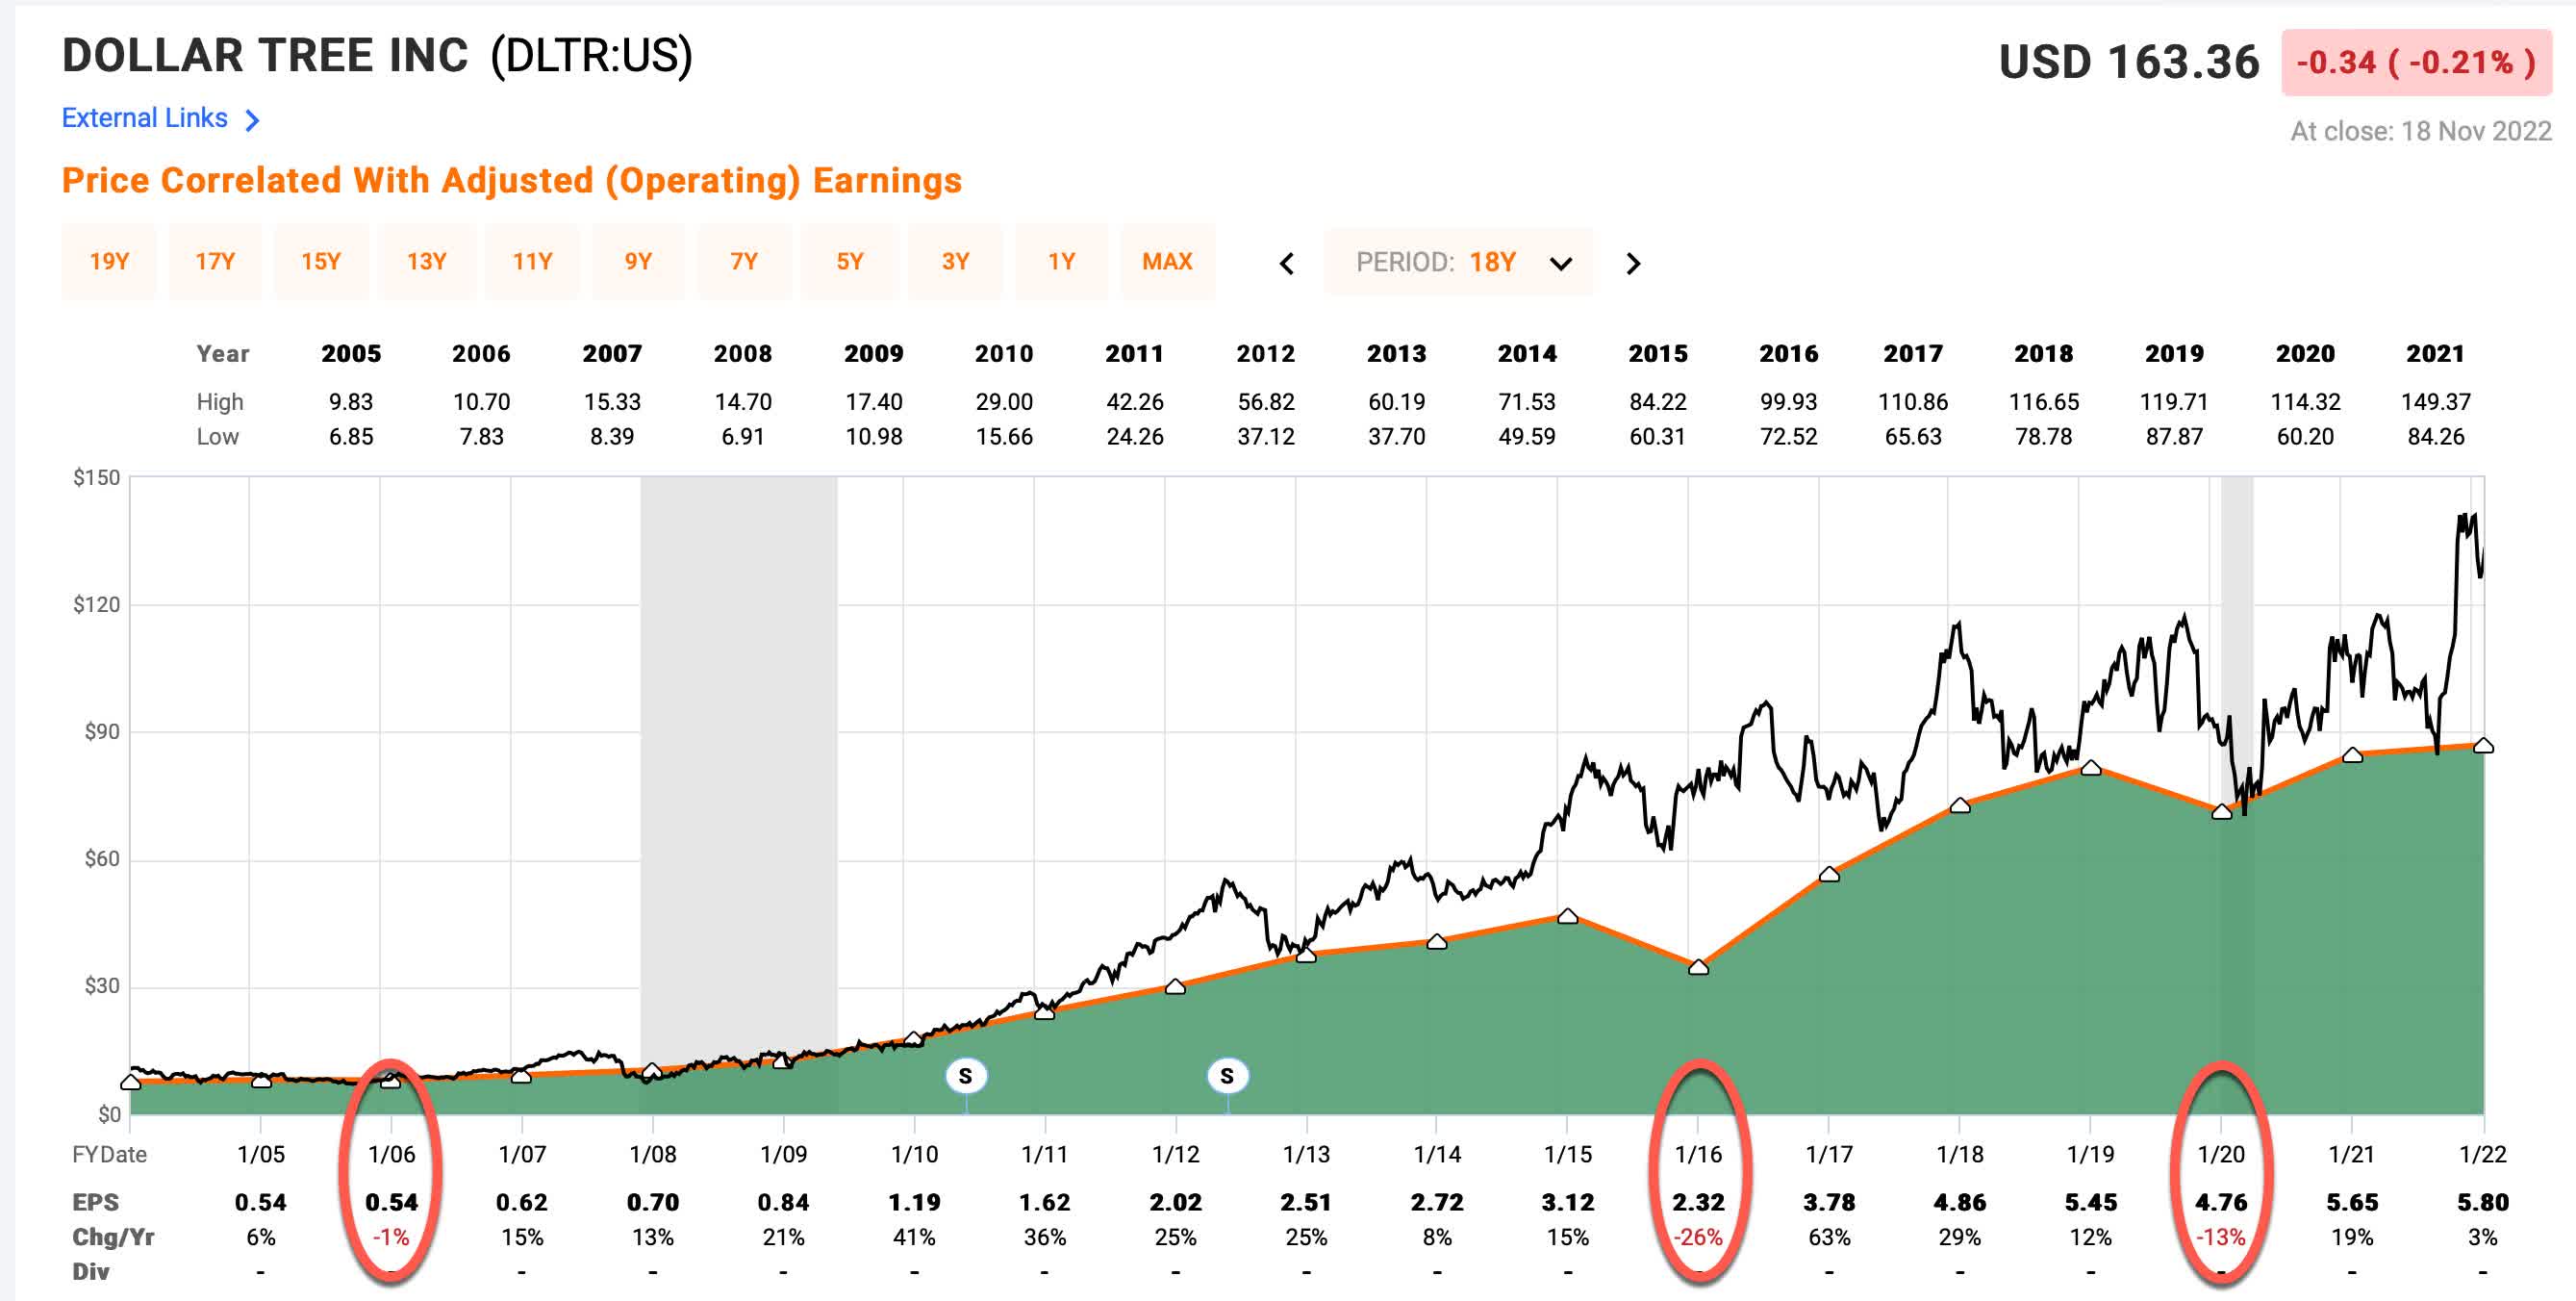
Since 2005, Dollar Tree has experienced three years when earnings growth was negative, the deepest being 2016 when EPS growth fell 26%. This is representative of a moderately cyclical stock and the declines aren’t so deep that I can’t perform an earnings-based analysis for the stock, so I will proceed with my standard “Full-Cycle Earnings” analysis.
DLTR Stock – Market Sentiment Return Expectations
In order to estimate what sort of returns we might expect over the next 10 years, let’s begin by examining what return we could expect 10 years from now if the P/E multiple were to revert to its mean from the previous economic cycle. For this, I’m using a period that runs from 2014-2023.
FAST Graphs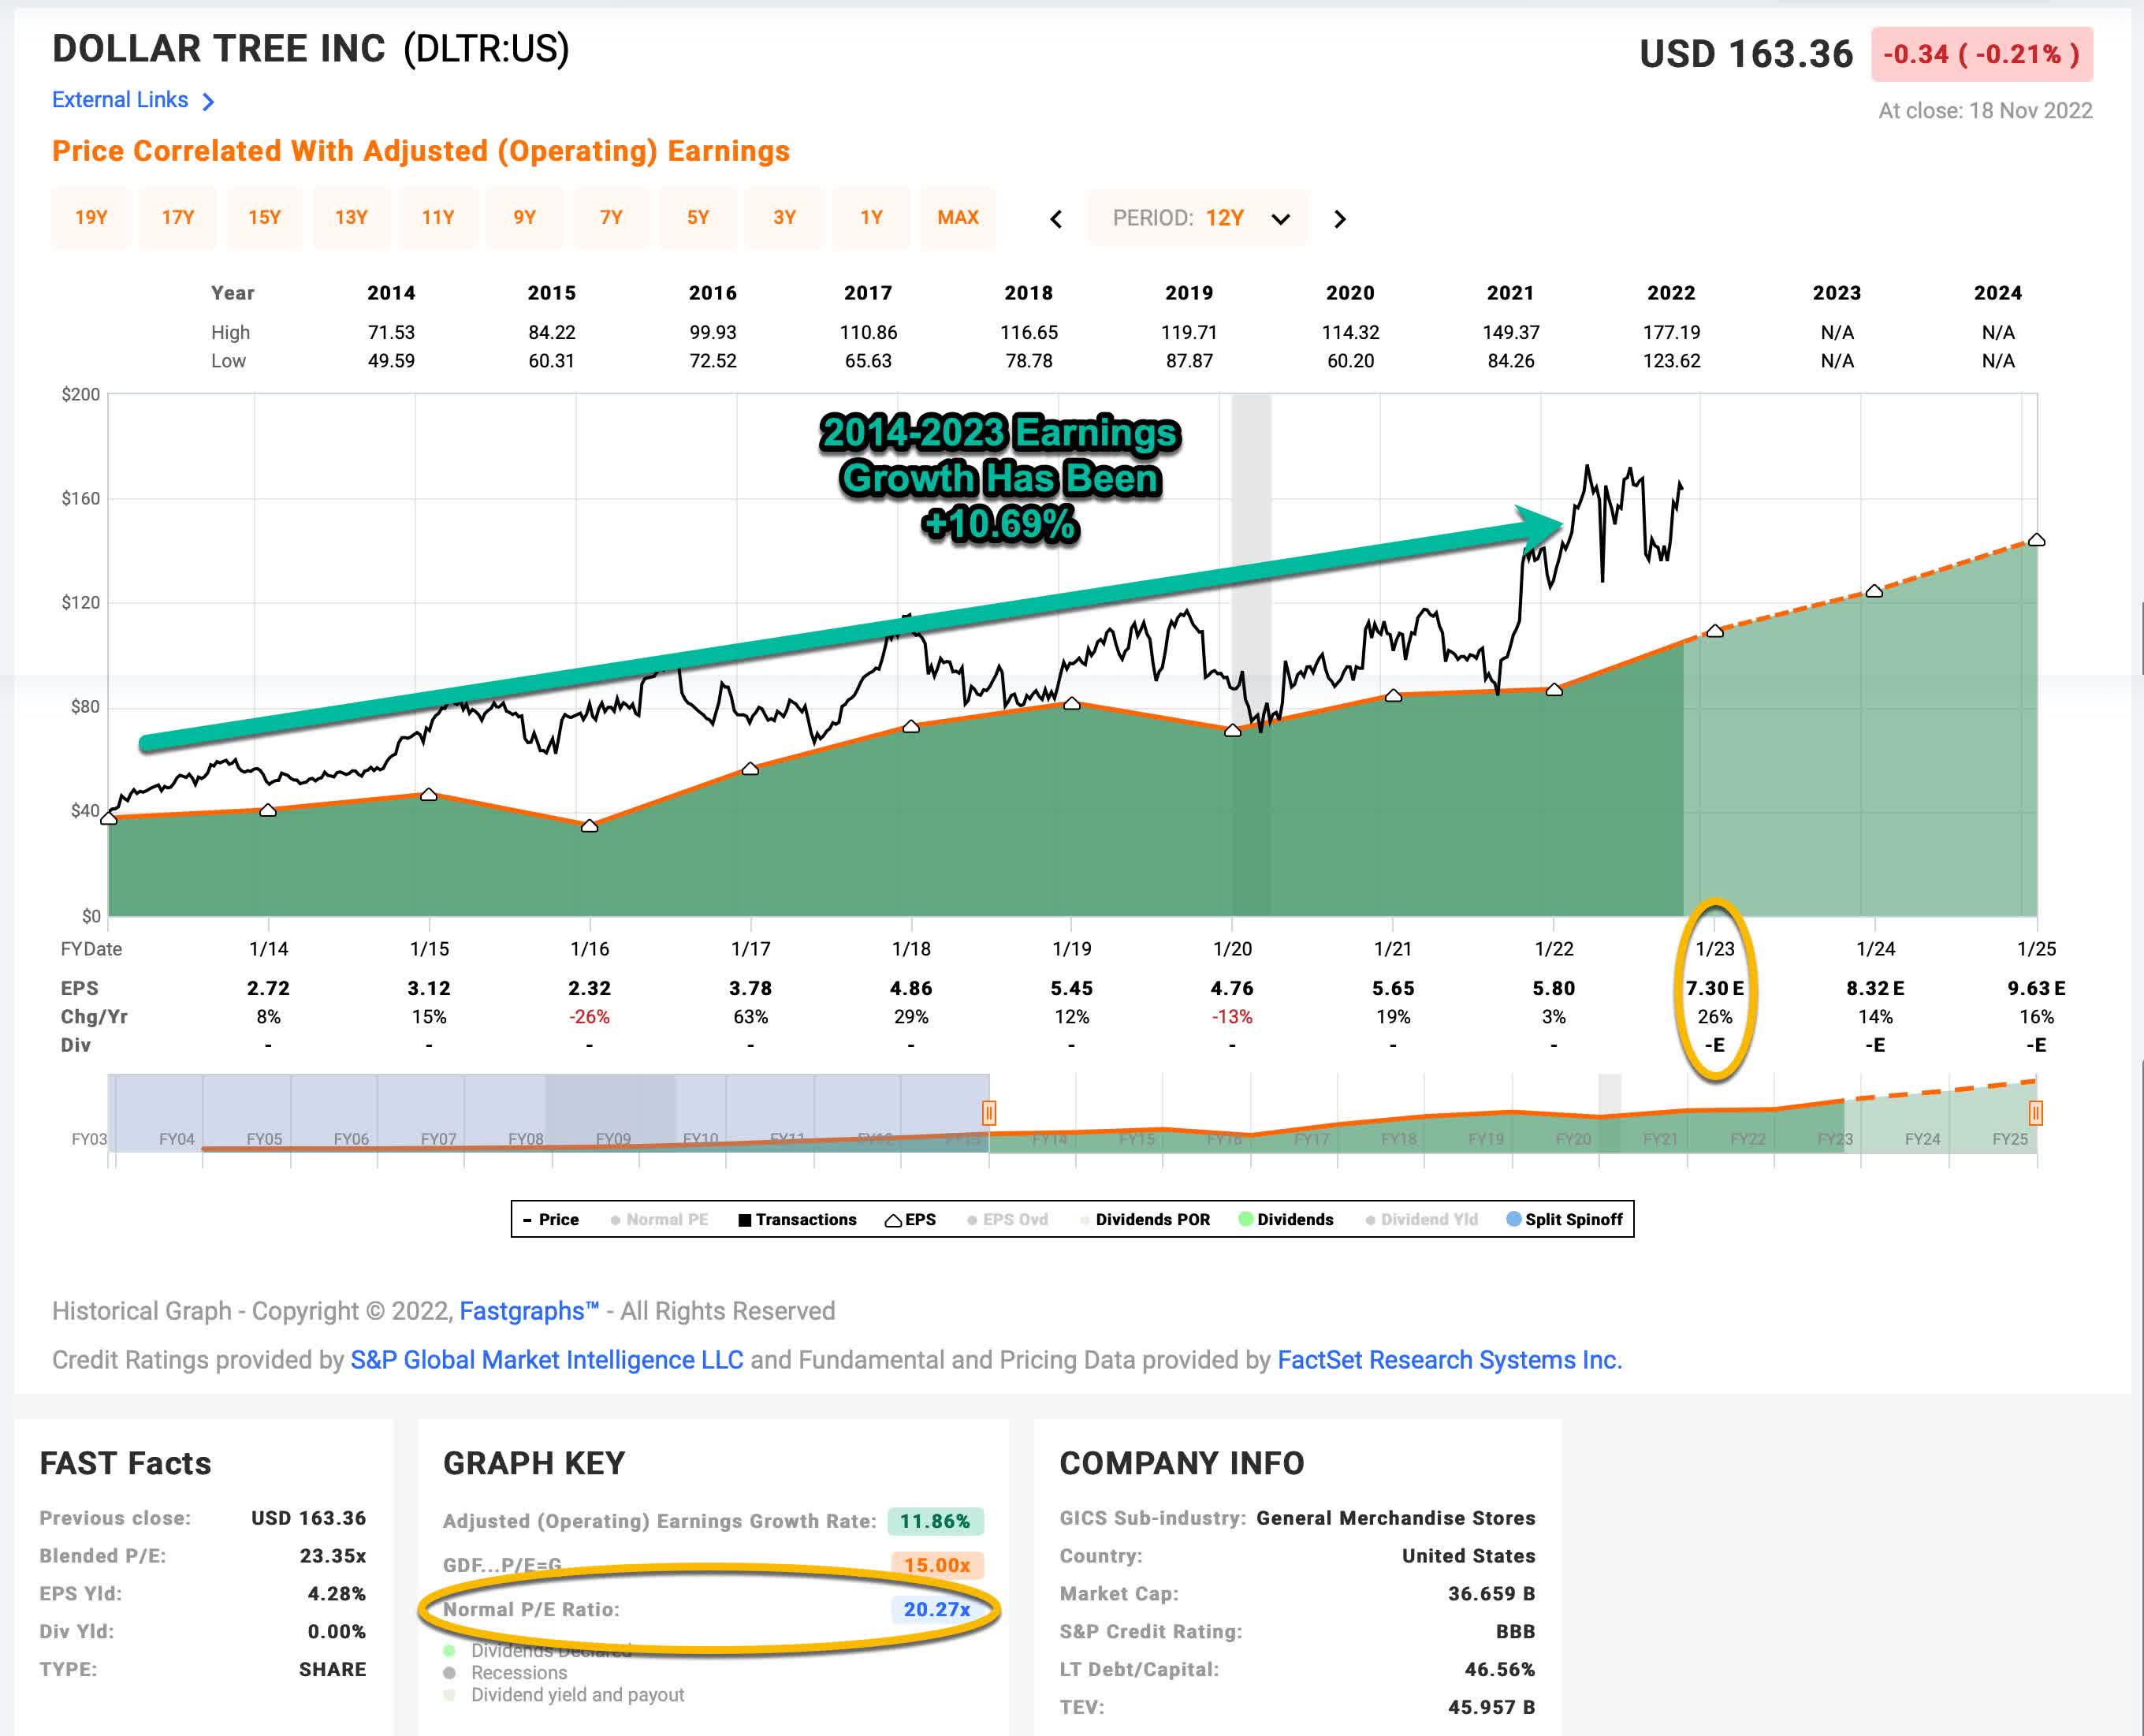
Dollar Tree’s average P/E from 2014 to the present has been about 20.27 (the blue number circled in gold near the bottom of the FAST Graph). Since my last article, EPS estimates for 2023 have risen from $7.25 to $7.30. This creates a forward P/E of about 22.38 for DLTR. If that 22.38 P/E were to revert to the average P/E of 20.27 over the course of the next 10 years and everything else was held the same, DLTR’s price would fall and it would produce a 10-Year CAGR of -0.98%. That’s the annual return we can expect from sentiment mean reversion if it takes 10 years to revert. If it takes less time to revert, the return would be lower.
Business Earnings Expectations
We previously examined what would happen if market sentiment reverted to the mean. This is entirely determined by the mood of the market and is quite often disconnected, or only loosely connected, to the performance of the actual business. In this section, I will examine the actual earnings of the business. The goal here is simple: We want to know how much money we would earn (expressed in the form of a CAGR %) over the course of 10 years if we bought the business at today’s prices and kept all of the earnings for ourselves.
There are two main components of this: the first is the earnings yield and the second is the rate at which the earnings can be expected to grow. Let’s start with the earnings yield (which is an inverted P/E ratio, so, the Earnings/Price ratio). The current earnings yield is about +4.47%. The way I like to think about this is, if I bought the company’s whole business right now for $100, I would earn $4.47 per year on my investment if earnings remained the same for the next 10 years.
The next step is to estimate the company’s earnings growth during this time period. I do that by figuring out at what rate earnings grew during the last cycle and applying that rate to the next 10 years. This involves calculating the historical EPS growth rate, taking into account each year’s EPS growth or decline, and then backing out any share buybacks that occurred over that time period (because reducing shares will increase the EPS due to fewer shares).
In Dollar Tree’s case, they had some M&A that distorted this number a little bit so I shortened my time frame to exclude the M&A. Recently they have bought back about 5% of the company via share repurchases. I will adjust for those buybacks and also make sure to include the two years during this time period when they had negative earnings growth. After doing that, I estimate an earnings growth rate for Dollar Tree of +10.69%, which is a respectable growth rate.
Next, I’ll apply that growth rate to current earnings, looking forward 10 years in order to get a final 10-year CAGR estimate. The way I think about this is, if I bought DLTR’s whole business for $100, it would pay me back $4.47 plus +10.69% growth the first year, and that amount would grow at +10.69% per year for 10 years after that. I want to know how much money I would have in total at the end of 10 years on my $100 investment, which I calculate to be about $181.49 (including the original $100). When I plug that growth into a CAGR calculator, that translates to a +6.14% 10-year CAGR estimate for the expected business earnings returns.
10-Year, Full-Cycle CAGR Estimate
Potential future returns can come from two main places: market sentiment returns or business earnings returns. If we assume that market sentiment reverts to the mean from the last cycle over the next 10 years for DLTR, it will produce a -0.98% CAGR. If the earnings yield and growth are similar to the last cycle, the company should produce somewhere around a +6.14% 10-year CAGR. If we put the two together, we get an expected 10-year, full-cycle CAGR of +5.16% at today’s price.
My Buy/Sell/Hold range for this category of stocks is: above a 12% CAGR is a Buy, below a 4% expected CAGR is a Sell, and in between 4% and 12% is a Hold. A +5.16% CAGR expectation makes Dollar Tree stock a “Hold” at today’s price. It is a little on the overvalued side, but I would expect it to produce roughly similar returns as the S&P 500 index going forward.
Assuming today’s earnings trends stay intact, I would be a potential buyer of Dollar Tree stock if the price were to fall below $105.15 per share.
Dollar Tree Stock As A Recession Safe Haven?
As we approach 2023, many strategists are calling for a recession. And I agree with them that a recession is likely. One thing I’ve noticed is that because so many investors are expecting a recession, quite a few have already piled into “recession-resistant” stocks. Utilities are trading at nosebleed valuations for example, and healthcare stocks have outperformed this year. These are classic recession rotations. Many money managers have mandates to be essentially fully invested, and if they are long-only that means the only real action they can take to guard their portfolios against recessions is to rotate into recession-resistant stocks. We saw a good example of this with Walmart’s (WMT) recent earnings report. Walmart’s earnings, when actually based on the numbers, were bad.
FAST Graphs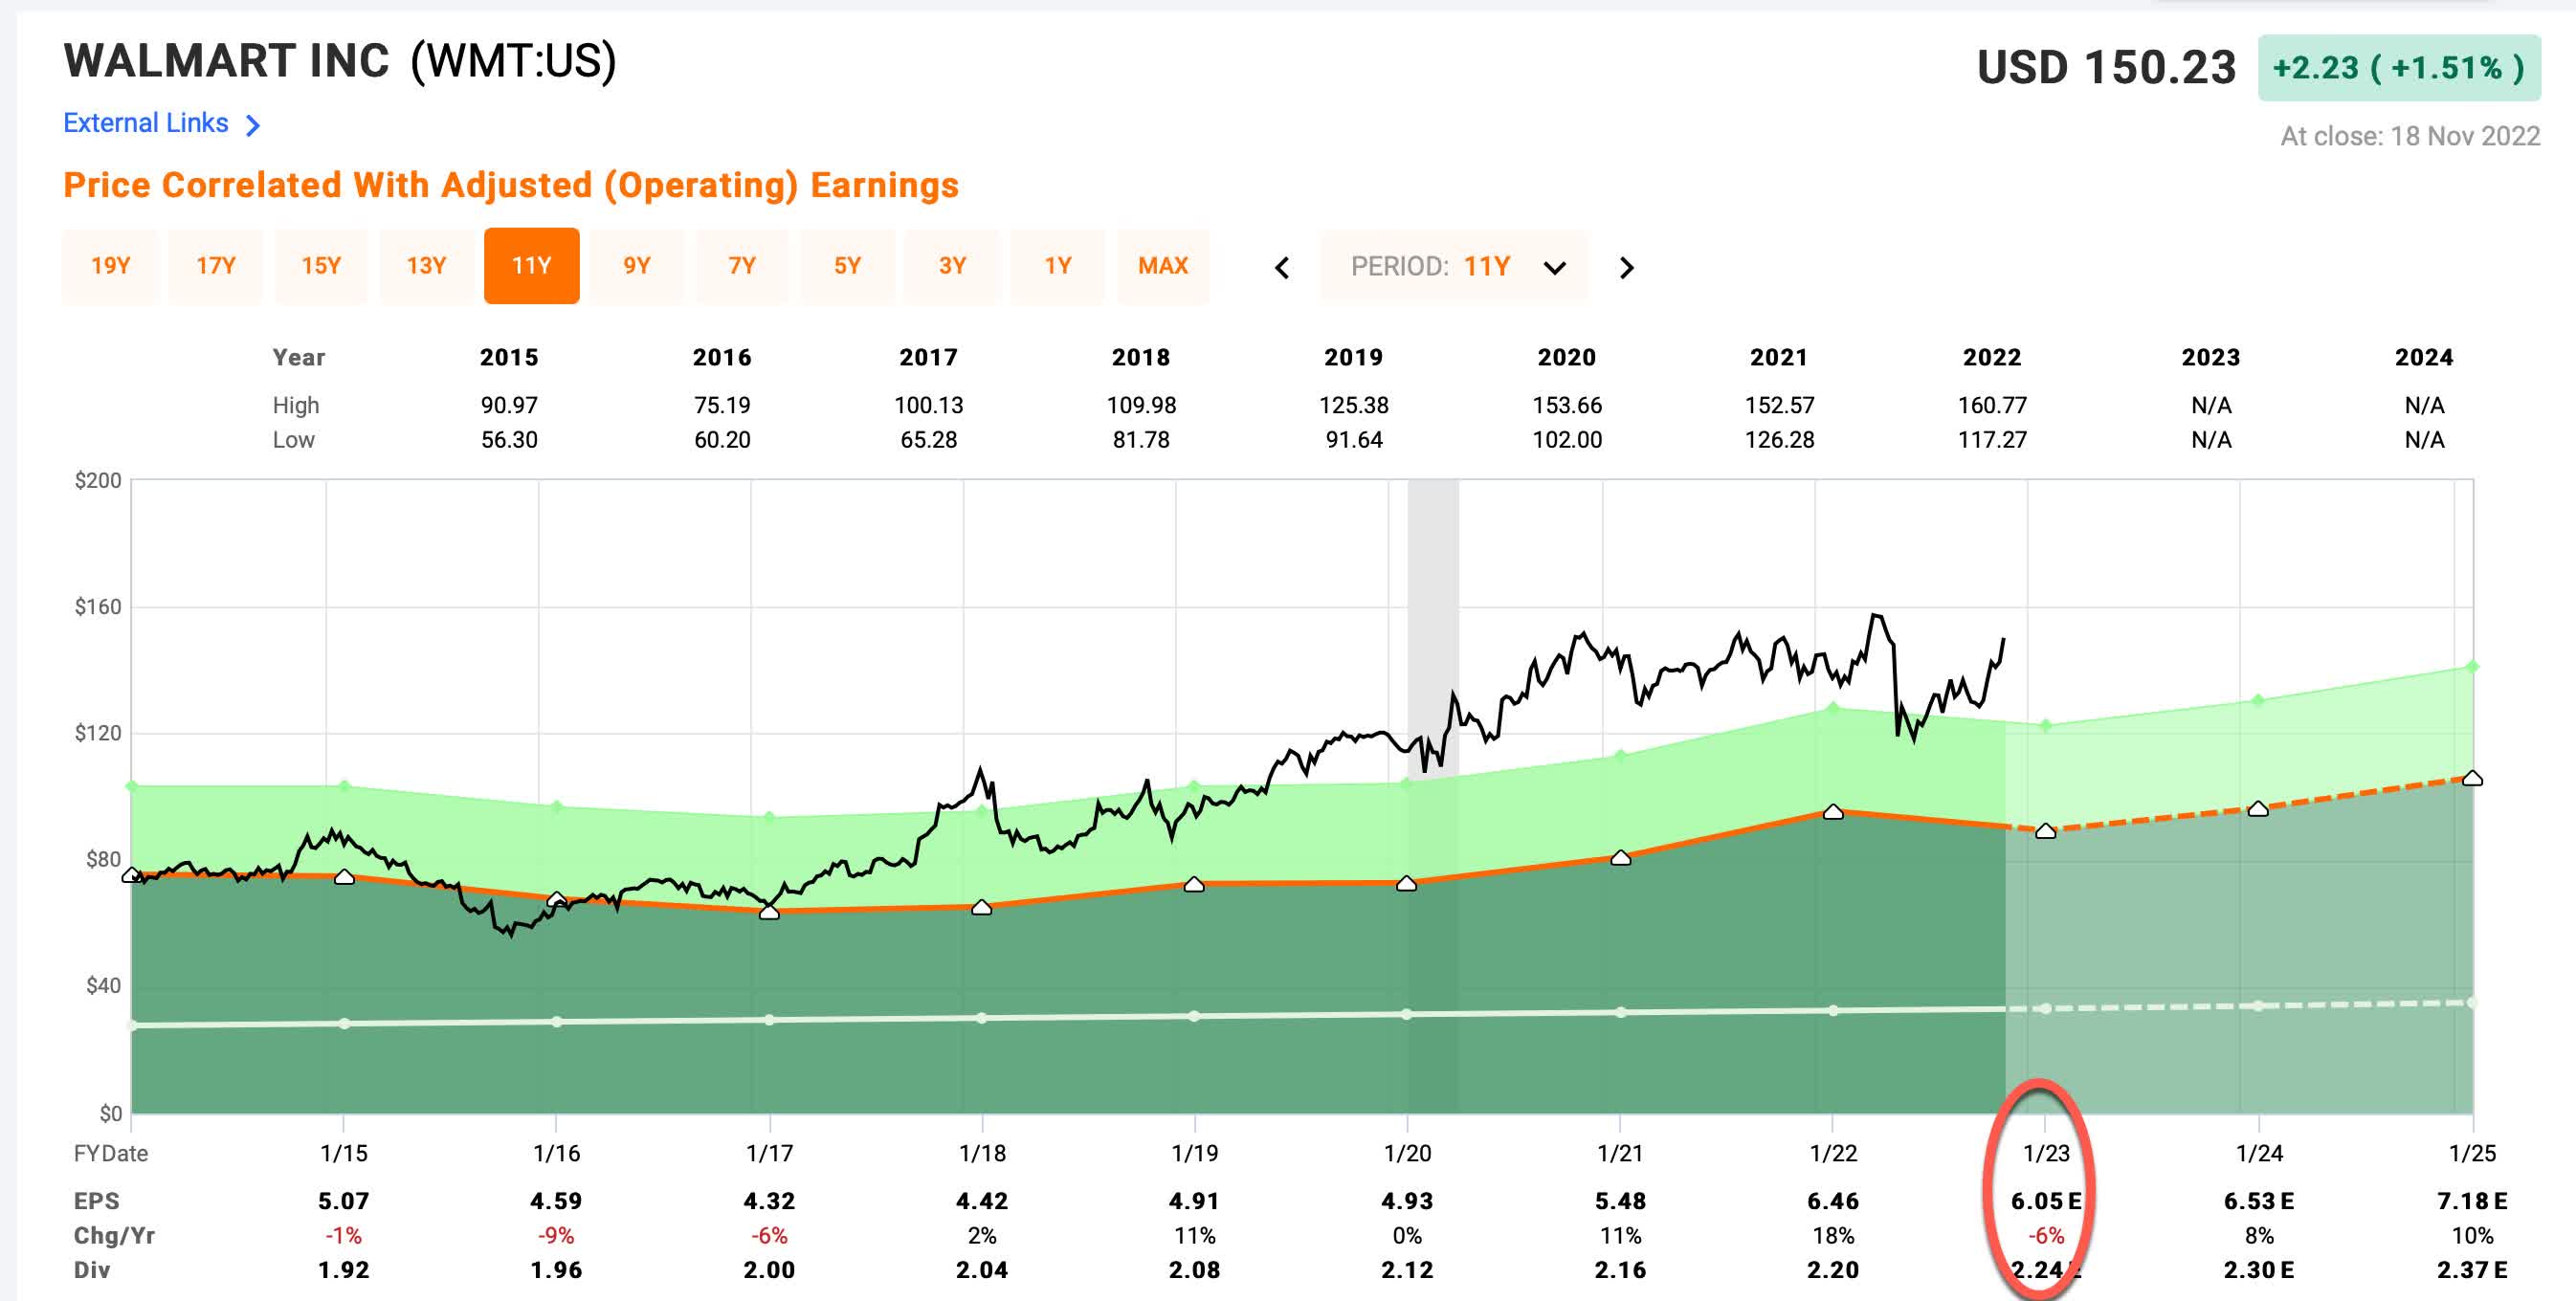
In a year with inflation running 7% or more, Walmart’s EPS, with one quarter left to report, are expected to fall -6%, and they would have been lower if we controlled for stock buybacks. Earnings growth has been flat to slightly negative since 2015 and the stock trades at an insane 25 P/E ratio. There really isn’t a way to spin this into a positive. Yet, the market did just that after their last earnings report and the stock rallied. I think the main reason it did so was that Walmart is viewed as a recession-resistant stock.
The reason I bring this up before Dollar Tree’s earnings report is that Dollar Tree is viewed as a recession-resistant stock as well, and this past year they have shown they can successfully raise prices and pass inflation onto their customers. It’s kind of the perfect stagflation stock, which is what we might experience next year. I don’t typically make earnings report predictions, but I wouldn’t be surprised if no matter how the report goes, the stock holds up well in the aftermath.
Conclusion
Based on historical earnings and earnings growth, even though I sold my Dollar Tree stock at the end of last year, and even though it’s a little overvalued now, I would continue to hold Dollar Tree stock if I still owned it. It’s not nearly as overvalued as other recession-resistant stocks, and I expect the media will find a way to spin earnings in a positive way, even if they aren’t great.
Be the first to comment