

crstrbrt/iStock via Getty Images
Introduction
A great pair trade can do wonders for portfolio diversification, but designing and managing one can be challenging. I think a great pair trade requires a mix of fundamental, technical, and statistical analysis since there’s an element of market timing involved. If we get down to its components, pair trading relies on some aspect of mean reversion, betting that the perceived gap in prices will either narrow or widen within the investment period.
For it to work, the pair needs to have a fundamental (e.g. revenue sources, products, etc.) link, a historical price relationship, and a few good reasons why the gap might change. My thesis is that Intel Corporation (NASDAQ:INTC) and Taiwan Semiconductor Company (NYSE:TSM) are showing signs that their current valuation gap might close within the next 9-18 months. Therefore, I recommend going long INTC and simultaneously going short TSM.
TSM and INTC have been historically very correlated in most periods and moves away from trend tended to follow with mean reversion
Figure 1 shows the log chart of TSM and INTC to illustrate % moves (top) and the bottom is the running 100-Week Z-Score on the ratio of INTC/TSM. This shows periods where the ratio has moved significantly, indicating periods where one stock is outperforming the other in terms of price momentum. Periods where one outperforms the other tend to follow periods of reversion, where the lagging stock closes the gap, or the outperformer loses out.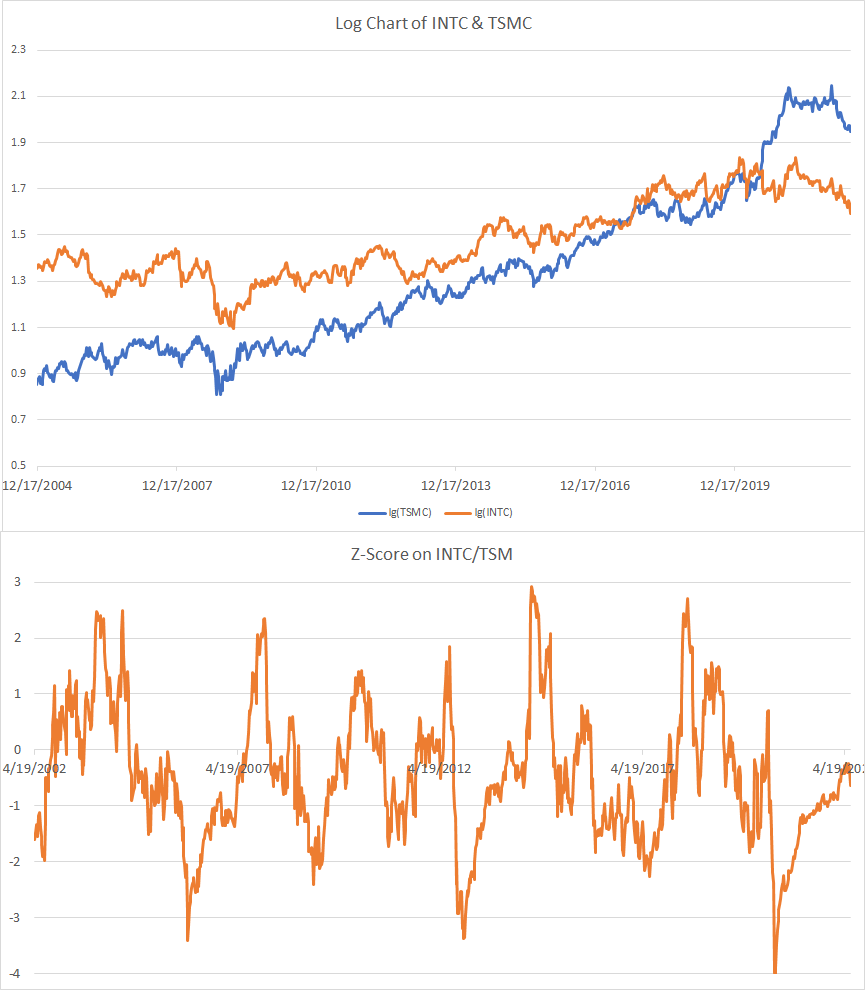
Figure 1 (bottom) shows that prices for INTC and TSM have been fairly stable with bouts of strong negative correlation mainly driven by the outperformance of one over the other in terms of earnings and technology (and the financial crisis). As figure 1 shows, when the momentum of INTC or TSM starts to shift significantly positive or negative (via 100-week moving z-scores of the price ratios) against each other, the next few years follow a reveal of that pattern. For example, in late 2013, when the z-score touched -3, and INTC and TSM price moved toward each other, it follows a period of the price diverging. Currently, in 2020, that divergence occurred once again, this time touching -4 standard deviations, the reversion has started to occur and may continue to do so, closing the gap that has opened up.
Overall, in terms of absolute prices, TSM has consistently traded at a premium to INTC slowly, but historically, we’ve seen multiple mean reversion episodes between periods of price changes (figure 1). This suggests that TSM might outperform INTC in the long term. However, if we look at history, sharp changes in price for TSM, as seen post-2020, may revert back to a historical long-run moving average. I believe that in this case, in the short to medium term, TSM has a good chance of going down in price as prices have overshot fundamentals and the price may mean revert.
TSM has benefited from strong demand from the onset of COVID-19, while INTC failed to do the same
COVID-19 provided a lot of tailwinds for TSM due to high amounts of forward demand pushing revenue growth to some of the highest, it’s ever been shown in figure 2. Since demand is much higher for TSM products, TSM was able to increase prices, which was reflected in higher gross margins seen in figure 2. However, INTC has failed to benefit from the same tailwinds and has even seen its gross margins contract over the same period. This has led to INTC losing a lot of market value and has been used to justify INTC trading at significantly low multiples.
Figure 2. Time series of INTC and TSM (2330 TT Equity) revenue growth and gross margins from 2010-2022.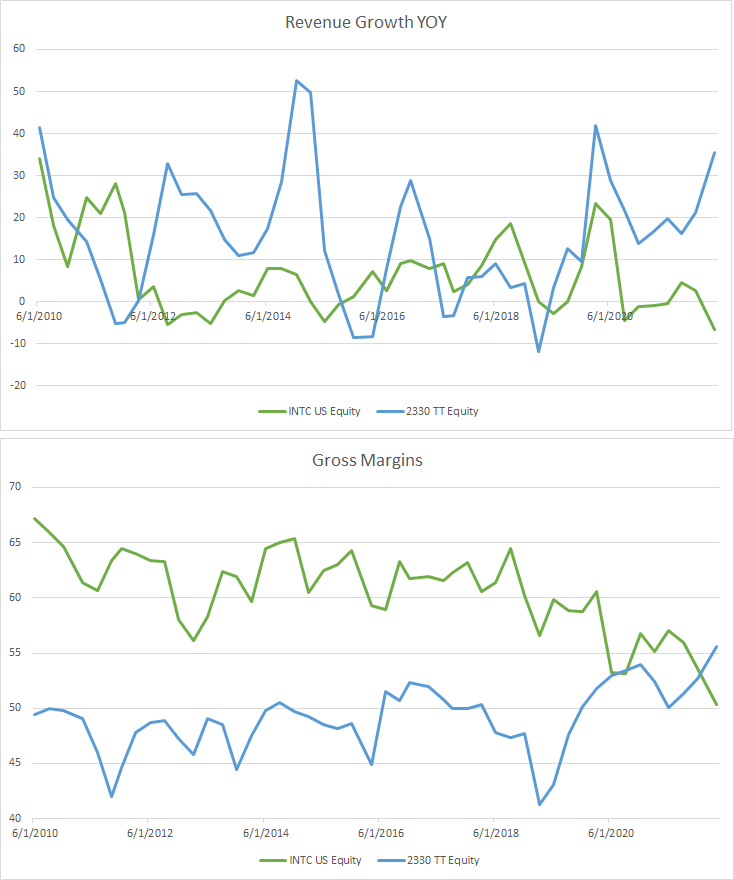
How did INTC get to this point?
Intel was a dominant player in the semiconductor industry, innovating every year. However INTC lost this position, from a series of moves starting with:
- The board hiring a CEO whose focus was cash flow and the stock price which contributed to cash drain.
- Failing to deliver on their 7 mm node.
- INTC’s competitors – TSM, Nvidia (NVDA) and Advanced Micro Devices (AMD) – taking a growing market share.
Figure 3 shows the historical revenues (adjusted to USD) for INTC and TSM.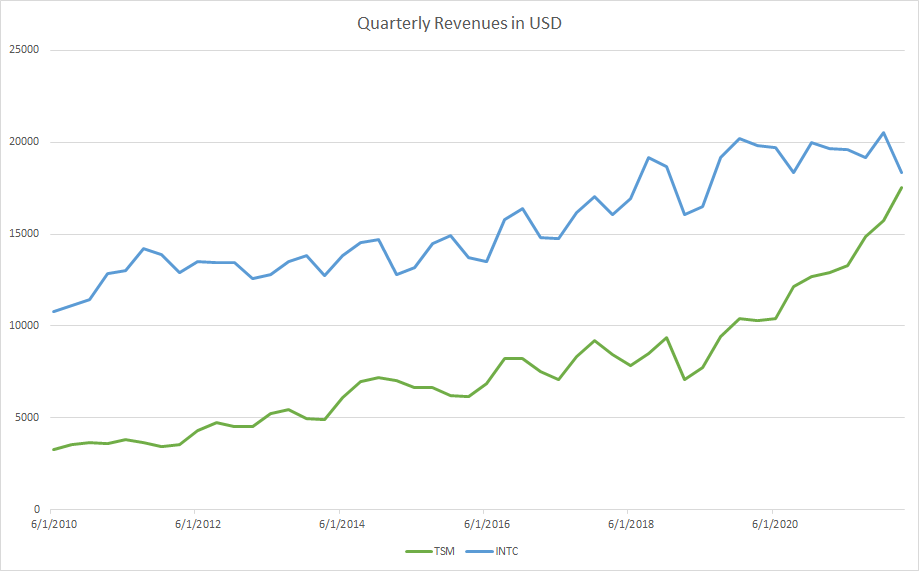
Looking at INTC’s revenues in Figure 3, they got complacent, forgetting R&D, and are now close to losing market leadership. Currently, TSM produces better chips than INTC and has a timeline of new chips that could outperform INTC’s. When Apple ditched them for their own chips, that was a massive blow. This has obviously led to much selling pressure and a decline in the future outlook for INTC. This suggests that P/E and P/S multiples should be higher for TSM but not as high as they currently are currently.
This has led to today, where INTC is trading like it’s going to lose even more market share to its competitors and can no longer compete on the same playing field. For potential investors of INTC, it’s really binary, if Pat Gelsinger, INTC’s new CEO achieves his roadmap, then INTC may be trading at a significant discount to intrinsic value, otherwise, the price may be just right for a company that will now supply to the lower end product market. INTC presents itself as a company with a significant margin of safety for value investors.
Figure 4. shows SA’s Quant Factor Grades and consolidated SA authors ratings.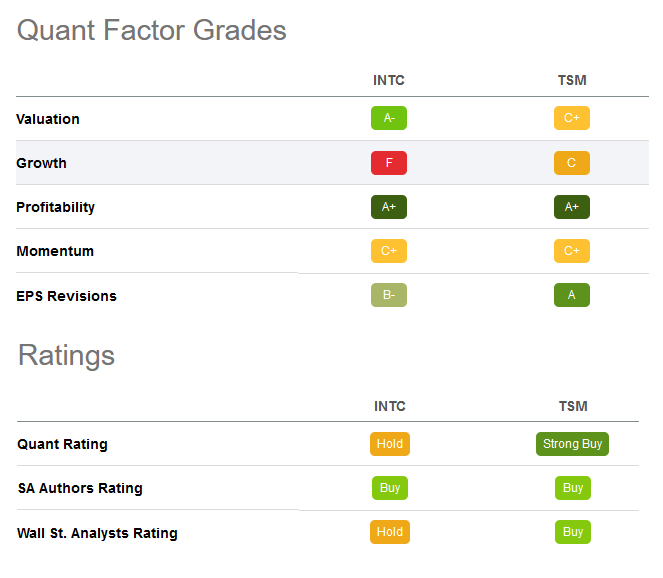
The results are in: INTC is now a Value Stock
Making use of SA’s quant factor grades shown in figure 4, we can see valuation looks great for INTC, but growth is abysmal. The opposite is true for TSM. Another thing is that they’re both profitable, very profitable if we look at Figure 4. As for consensus, figure 4 shows that TSM has a consensus buy rating across the Quant, SA authors and the street. While INTC is mixed with hold being the average rating for Quant and the street while SA authors are more positive. So we can establish here that INTC in the near term doesn’t have much growth in it, but is quite the value stock. Its high earnings and margins show that if management can steer INTC back into a path of growth, INTC may be rewarded with more growth-like multiples and may increase in price significantly.
While TSM is profitable (slightly more than INTC according to Figure 3), growth is poor. The most common theses by SA contributors on TSM is that TSM stock is a great long-term buy since revenues are expected to grow further and it’s currently the greatest innovator in the silicon manufacturing space. While this could be true, trading at much higher multiples of earnings makes TSM prone to multiple contraction and I believe contraction in multiples for TSM is likely in the next 6-18 months supported by the macro environment we are in currently discussed next.
Figure 5. shows the price multiples of comparable stocks within INTC and TSMC’s Industry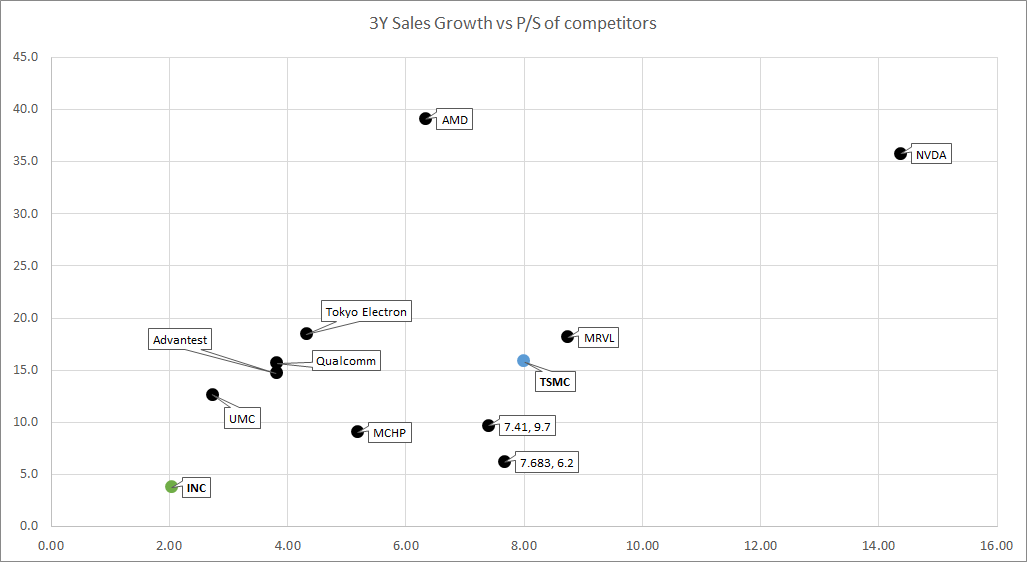
TSM is a good valuation short in the current macro environment
If a lot of your cashflows are far off into the future, when long-end rates go up, markets start to pay attention to multiples, a lot more. Taking a look at comparable stocks in figure 4 shows that TSM has a P/S of 16 and INTC has a P/S of 4. Knowing their current profit margins and similar revenues, it’s hard to justify TSM’s current valuations, even forgetting AMD and NVDA which TSM supplies. Since INTC is a value stock by most metrics (figure 4) and even against comparables (figure 5). INTC currently has a good offer price to go long, while TSM’s price may just contract from growth concerns near term.
Figure 6 shows the Inflation rate vs SPY P/E. During high inflation periods, PE tends to contract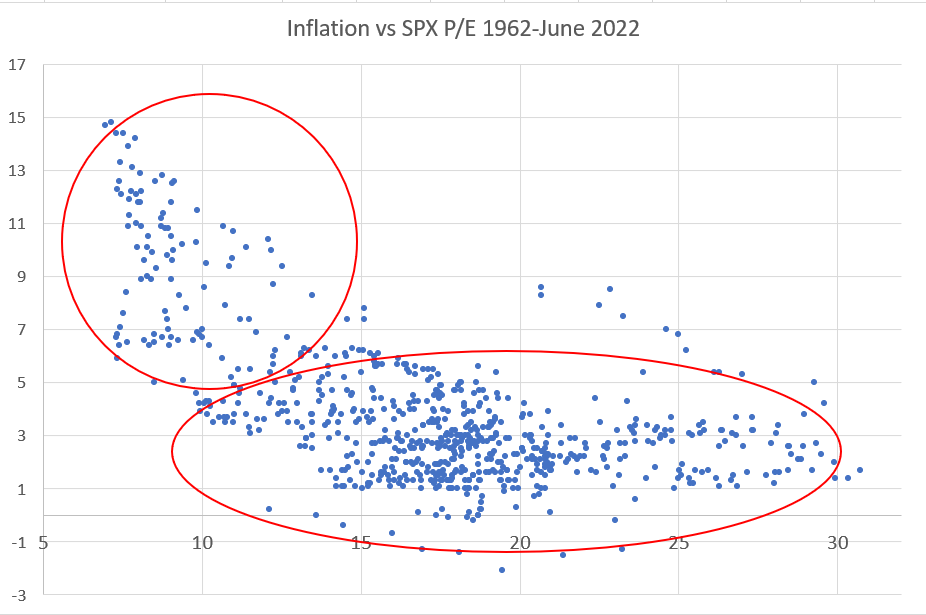
Inflation has already led to a multiples contraction and this may continue further.
Figure 6 shows that during more inflationary periods, P/E tends to be a lot higher. This is somewhat skewed and many might disagree about future inflation. However, it stands to reason that this uncertainty makes growth equities a lot less attractive and multiples may contract further. TSM may be the victim of a contraction of its multiples while INTC which is still maintaining profitability and minimal revenue loss may not lose value further. Looking at Figure 6 again, high multiples tend to contract in most cases in periods of higher inflation, which is where we are right now. While INTC is trading at the right multiples due to exogenous reasons, TSM is still trading like a growth stock, this may change.
Demand has already been pulled forward, and now is set to decline.
With inflation going higher, borrowed capital getting more expensive and wage growth not keeping up, it’s fairly obvious if this keeps up, the average consumer will start to reduce buying consumer discretionary goods. People also bought new computers when the COVID-19 started at sky-high prices.
Add to this again, the fact that the newer generation graphics cards and processors are just slightly better. As an investor of TSM, you have to ask yourself, “am I going to see more sales growth in these companies to justify such a high P/S in the next few quarters?”. I hope we can agree that the answer to that is no.
The widened spreads are already narrowing
Figure 7 below shows a normalised price (i.e. the price of a dollar invested in 2017) up until now. The prices trade very closely spread-wise pre-2020 against a moving average. Now the spreads that have widened after the first wave of COVID-19 have started to narrow and probably will narrow further. At least looking at price action, INTC has been a consistent decliner since 2021 but has shown very low volatility. Fundamentally, INTC has been maintaining profitability and is now with the new CEO will attempt to start innovating again.
TSM, however, benefited from the massive revenue growth from COVID-19, but now is much more volatile and has been failing to meet numbers. More importantly, TSM broke its support somewhere around March/April and may continue trending downwards. This suggests that in the medium to short term, the spreads may continue to narrow and revert to the historical mean.
Figure 7 shows the normalized price chart to see the price gap that’s been building up since 2020.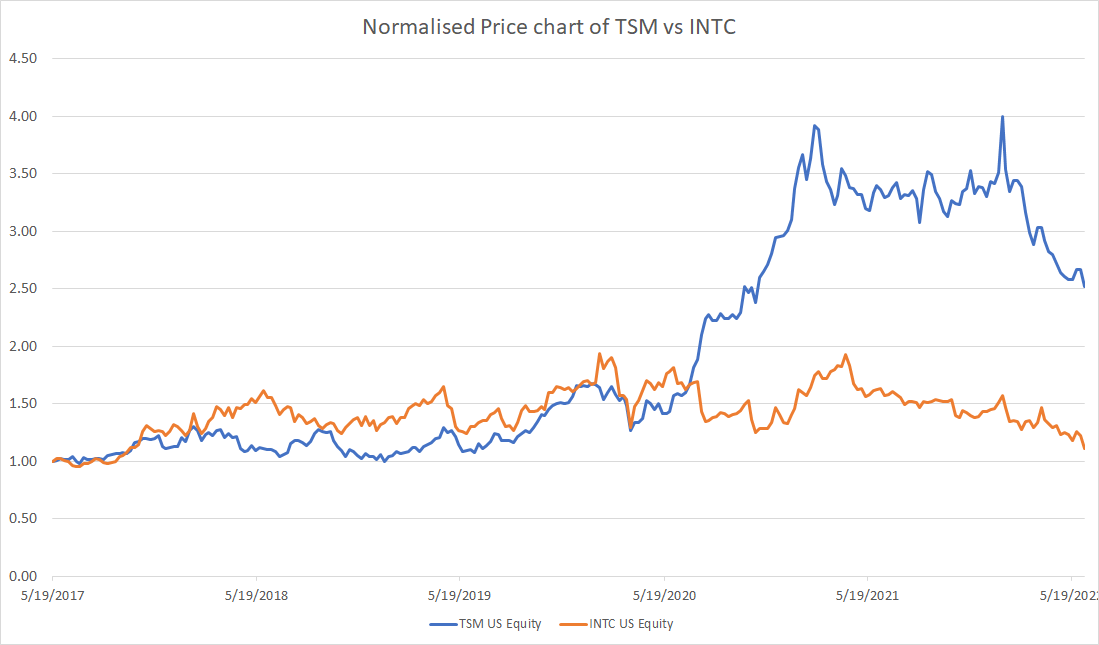
The trade is positive carry
Looking at figure 8, we see that the dividend spread for TSM/INTC is 1.69. For some, this makes it a no-brainer. With a borrowing cost of 0-0.5% for a liquid stock like TSM, this makes the trade +1% carry — not much, but since this trade does include a short sale, the pair trade still has a positive carry. This allows investors who enter into this trade to hold the position without experiencing significant borrow costs and to get paid to hold it.
Figure 8. Shows the dividends for the two stocks.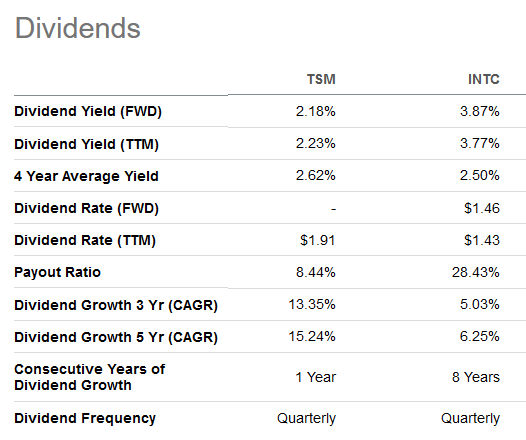
Then there’s the elephant in the room
In my opinion, it is unlikely that a Ukraine-style invasion would happen to Taiwan by China. However, no one is pricing this risk according to the tails of the implied volatility. TSM is mildly outperforming the SPX since March if we look at the ratio of TSM/SPX. This suggests that everyone is more hopeful about TSM’s financial metrics in the next few quarters, which I would argue may look worse than better.
If the likelihood increases, then game theory suggests that explicitly laying out the scorched earth strategy starts to become very likely. The volatility on TSM ADR stock is trading at 35 Vol for the > 3-month ATM put options, and 55% for the 50 strike price. What would happen if Taiwan even hints at this strategy being usable if China becomes heavy-handed? How would anyone even price that risk? Probably with much higher implied volatility and a steeper discount to the intrinsic price for TSM.
Finally, the INTC tailwinds and the TSM headwinds
INTC is finally investing in more factories and innovation. It’s hard to say when or if this will pay off, but in the short to medium term, this may transition the company to be assessed from a growth angle. How about the new TSM factories in the US?. Those are unfortunately only able to make older models of chips AFTER they’ve been built, which seems to be longer and longer now. The INTC/TSM relative value trade just seems to be coming at the right place at the right time.
How would I construct this pair trade?
Two ways I think may be good:
- Traditional Relative Value: Long INTC/Short TSM at about 10-30% of the portfolio gross exposure for people who like the trade, 5-15% for each leg. The reason for the high level of exposure is because this strategy has zero net exposure and theoretically has zero beta (and therefore will return the risk-free rate). So, ultimately, the risk in this trade is that TSM becomes goes higher during the investment period. This will force portfolios with higher exposures to buy back to maintain parity with INTC. Portfolios starting with smaller exposures can buy more INTC to maintain parity. The trade provides a positive cash return because of INTC’s higher dividend. You may buy OTM TSM calls to offset a crash upwards risk to your short position.
- Long TSM Puts/Short INTC Puts (6-12 months out): Implied volatility for INTC and TSM are similar, so you may short INTC ATM puts and long TSM puts for a zero cost (volatility-wise, not cost-wise, if you don’t understand this please don’t consider this option). You may also do it with OTM puts if you like the crash risk angle. The advantage of this is a much lower cash overlay on the portfolio, the higher dividend for INTC also decreases the forward price of the option and increases the value of the put option, with the change that you’d need to buy INTC at a lower price.
For the traditional relative value trade, once the P/S reaches 5 for TSM which is ~40% down from current prices without any change in sales and INTC goes to P/S of 3 which represents a 50% increase in price might be an optimistic estimate.
What are the risks to this thesis?
I should first state that short-selling anything is only for high-risk takers and more importantly, sophisticated investors should do. Buying OTM calls helps prevent a portfolio disaster, but it may still impact your portfolio negatively (buying far OTM calls gives you much less protection and buying closer calls makes it too expensive). In order to manage the risks of the short position, you need to buy on the way up and realize the loss in order to maintain parity with the INTC trade.
Then there are specific risks in my thesis:
- TSM continues to grow sales/profits despite the macro headwinds started in my thesis and INTC accelerates revenue loss. This would make the spread wider.
- TSM announces a product that is significantly (>30%) better than any of their current offerings rather than marginal improvements (1-10%) would immediately push demand for their products likely pricing their stock higher.
- INTC’s financial performance significantly deteriorates more than it has already. INTC is in a growth transition, this may come with hiccups and may occur while you have your trade on.
Summary
I believe that INTC is still a great long-term buy from the macro tailwinds from the US government supporting diversification of its important silicon sources for the functioning of the digital economy. INTC is also trading at a very significant discount to its peers in terms of multiples. Their long-term outlook is potentially very good if they can at least match and keep market share against TSMC.
TSMC is a great company with good long-term prospects, but in the short term is just clouded by many long-term headwinds, which is a big issue when you look at its valuations. So, in the next 9-18 months, I believe going long INTC and short TSMC can provide good absolute returns and may provide good portfolio diversification on a long-only portfolio.
Please leave a comment, criticisms and points I’ve missed. I wanted to try writing about a relative value trade since writing relative value trades is something I’m unfamiliar with. So I want to hear the thoughts and opinions of others, particularly on the relative value trade (not talking points of the individual stocks).
Be the first to comment