

adaask
Thesis
The Xtrackers USD High Yield Corporate Bond ETF (NYSEARCA:HYLB) is a U.S. high yield exchange traded fund. As per its literature:
Xtrackers USD High Yield Corporate Bond ETF seeks investment results that correspond generally to the performance, before fees and expenses, of the Solactive USD High Yield Corporates Total Market Index; a rules-based, market value weighted index engineered to mirror the performance of high-yield-rated corporate bonds issued in U.S. dollars.
In this article, we are going to analyze HYLB’s composition and performance and compare it to some of the best HY CEFs. We are also going to take a closer look at the fundamental question around utilizing HY CEFs versus taking a long position in HY CEFs. We are going to look at the benefits and drawbacks for each structure and present a savvy investor with the tools necessary to make an informed decision.
HYLB Holdings
The fund aims to mirror the composition of the Solactive USD High Yield Corporates Total Market Index. To that end, the ETF has a balanced credit allocation:
Ratings (Fund Fact Sheet)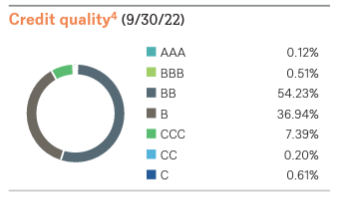
We can see how the vehicle is overweight BB names, with the second-largest bucket being B credits. The CCC bucket is very small, at a sub 10% figure.
The fund is very granular, with no issuers breaching a 1% holdings threshold:
Holdings (Fund Fact Sheet)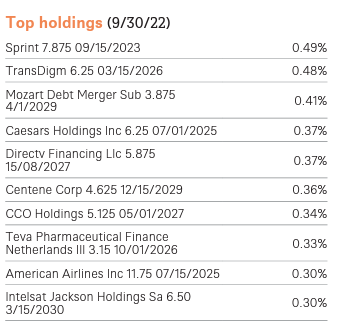
In the current portfolio composition, all credits actually fall under 0.5% of the fund size. From a sector standpoint, the ETF is overweight Consumer Discretionary:
Sector Allocation (Fund Fact Sheet)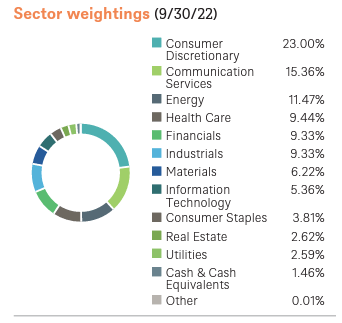
Generally, we would like to see industry concentration levels topped out at 15% to 17%, but it is not the case here.
The fund has a middle of the road maturity composition:
Duration Profile (Fund Fact Sheet)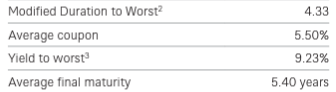
We can see how the modified duration for the fund comes in around the 5 years mark, the standard for the sector.
High Yield CEFs over ETFs
A retail investor looking to gain exposure to the high yield asset class has two broad choices – ETFs or CEFs. The names just refer to different legal structures, which at the end of the day delineate one large differentiator, namely Leverage. The CEF structure allows for the underlying junk bonds to be leveraged up, while the ETF wrapper does not. Leverage magnifies returns, so HY CEFs are going to outperform when markets are benign, and underperform when risk is sold off.
The more important question, though, is whether long term it makes more sense to buy a HY CEF versus an ETF. Is it just a cyclical choice (i.e. at the bottom buy CEFs then switch to ETFs mid-cycle) or are long term returns more favorable in one or the other structure?
Let us have a look:
YTD Performance (Seeking Alpha)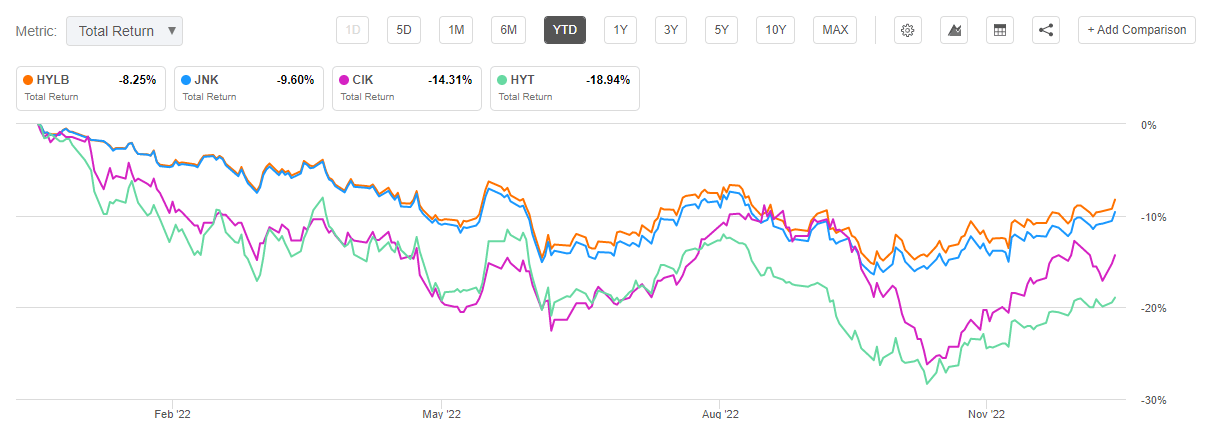
On a year to date basis, both ETFs and CEFs in the above graph are down. The ETF cohort is down roughly only -9%, while the CEF cohort is down -15% to -18%. That is almost a double downward performance for some of the CEFs.
Let us see how the performance stacks up on a 3-year time-frame:
Total Return – 3 Years (Seeking Alpha)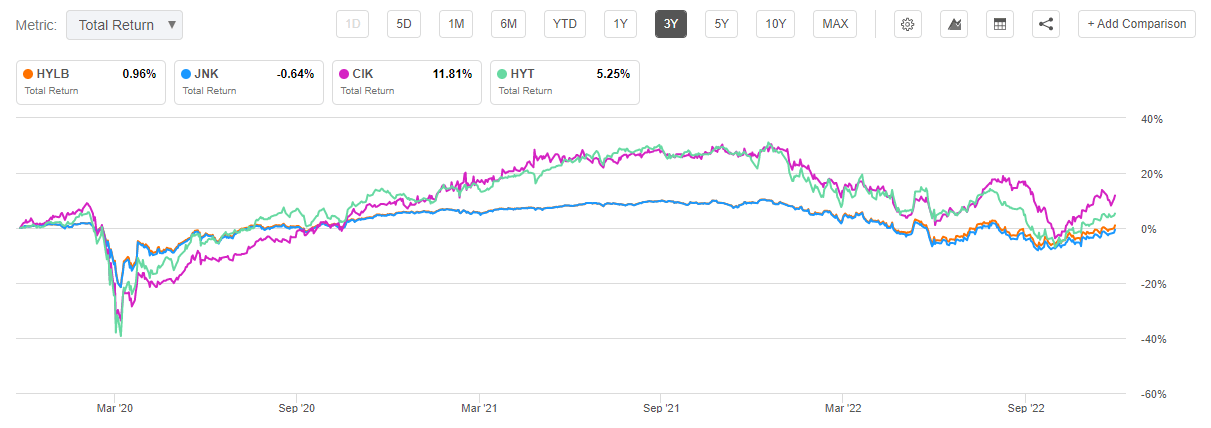
When normalized for a longer time frame, we can see the ETFs showing a flat total return performance, whereas CEFs are up from 5% to 11%. A 5-year chart brings the same dynamic even more into focus:
Total Return – 5 Years (Seeking Alpha)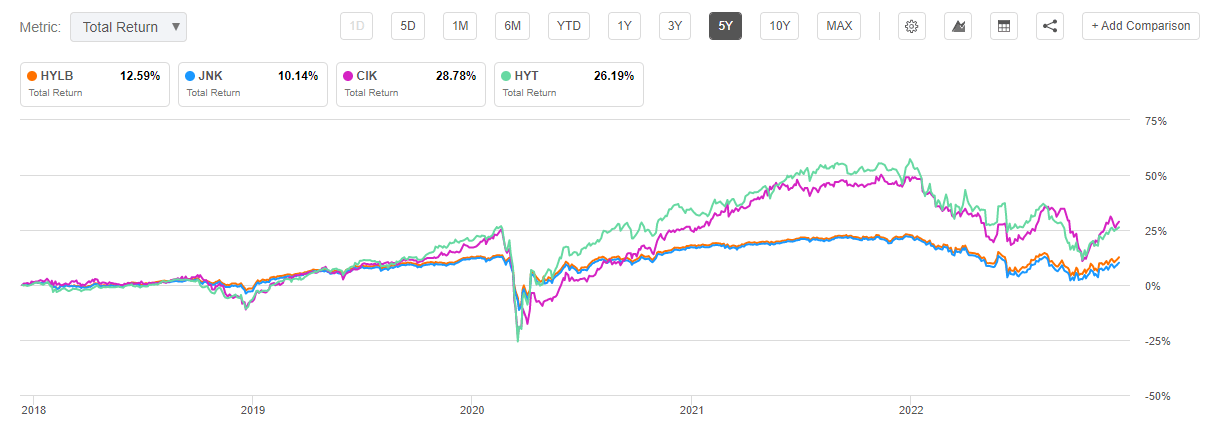
Firstly, we can observe that on a 5-year time frame the ETFs produce only 2% annualized returns while the CEFs produce 5% annualized returns. As predicted, the CEFs significantly outperform during benign interest rate and spread markets (i.e. 2021), but have a more pronounced down move during sell-offs like the one observed in 2022.
So far we have determined that HY CEFs produce substantially higher long term returns, but let us have a look at risk and volatility metrics:
Metrics (Author)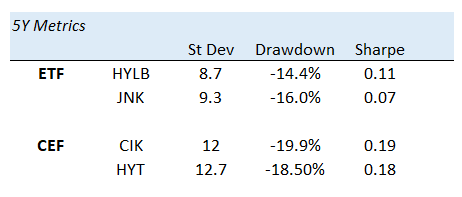
We can see the ETF cohort with a standard deviation around 9%, while the max drawdown is around -15%. On the other side we can see the CEFs with a 12% standard deviation and max drawdowns of around -19%. Net, the CEF exhibit better Sharpe ratios, meaning you get compensated better for the risk taken. To translate this in English, the CEFs pay you better per unit of risk taken, and generate better long term results.
Looking at analytics and performance we can see that while CEFs do indeed have higher drawdowns, they generate much better risk adjusted returns long term, and even better highlighted by our examples, are able to produce meaningful total returns for investors long term.
Conclusion
The Xtrackers USD High Yield Corporate Bond ETF is a U.S. high yield exchange traded fund. The ETF has a yield in excess of 5%, and has managed to keep its total return performance this year to around -10%. When thinking about income from the HY space, a retail investor would do well to understand the difference between HY ETFs and HY CEFs. While HY ETFs such as HYLB do provide for shallower drawdowns and lower standard deviations, their long term performance is not very appealing. On a total return basis, for example HYLB only managed a 2.5% annual total return on a 5-year period. The main differentiator for the CEF structure is the ability to layer in leverage on top of the underlying assets. Leverage magnifies returns, both on the downside and upside. We can observe from the studied cohort, though, that U.S. HY CEFs do provide a better risk/reward profile, with higher volatilities compensated by a much larger return profile. With annual total returns above 5% on a 5-year lookback, CEFs consistently outperform with a higher Sharpe ratio. We believe we are currently in a recession, with a last large market sell-off yet to come. Retail investors looking at U.S. HY need to understand that while ETFs are indeed less volatile, they offer lower returns, and more importantly lower risk adjusted returns. A retail investor looking to enter the U.S. HY market would do well to take a position in CEFs rather than ETFs and take advantage of the embedded leverage and current market cycle.
Be the first to comment