

benedek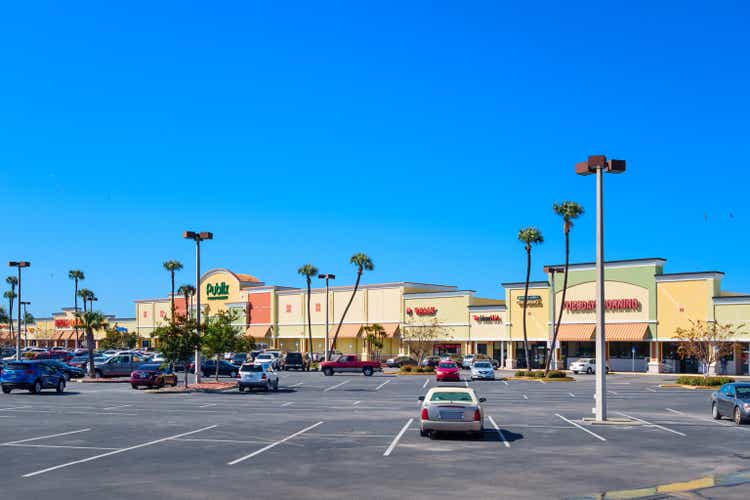
For much of the last decade, pundits have been calling for the death of brick-and-mortar retail. Rather than a supposed death knell, the last few years – marked by continued e-commerce growth, changing consumer behavior, and supply chain constraints – proved out the benefit of retailers offering customers multiple channels and highlighted the indispensability of brick-and-mortar retail.
With the need for retail clearly defined, demand for space has grown at an impressive clip. As we look to navigate clearly formed macro clouds on the horizon, we believe four key points set up Shopping Center REITs for above average performance: 1) lack of new supply going back to the GFC, 2) weaker retail tenants getting shaken out in 2020, 3) under expansion in brick and mortar space leaving many retailers competing for the same boxes, and 4) well positioned balance sheets allowing REITs to navigate and capitalize on any dislocations. Looking across the space, we continue to tilt towards 1) grocery-anchored, 2) essential/necessity-based and 3) Sunbelt-focused retail.
New Supply Remains Constrained
Before delving into the exceptionally encouraging leasing trends in 2022, we have to back up about a decade to detail the current supply backdrop for shopping centers. As highlighted in Figure 1, the industry on average was growing shopping center supply by ~2.5% per year in the early 2000s. After peaking close to +3% in 2005, new development fell off a cliff following the financial crisis and has remained in the 0.5-1.0% range ever since. Remember, historical obsolescence is around 0.5%-1.0% per annum, which means total existing supply has roughly been flat since 2010 (e.g., new construction is simply replacing older buildings being taken out of service). Observing the current landscape, rising construction costs coupled with rapidly rising interest rates further clamped down on new development. As such, Green Street estimates new supply falling even further to ~0.3% per year for 2022-26.
Green Street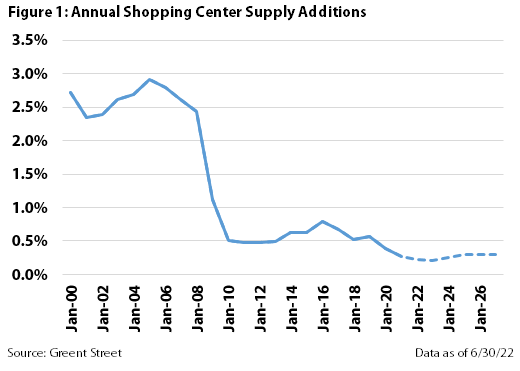
In addition to modest supply growth (or even potential decrease in supply) as a positive industry tailwind, we also see several tailwinds driving increased tenant demand.
Consumer Behavior Changed
Working from home is constantly mentioned as a headwind to office demand, but much less focus has been spent on how working from home changes consumer spending patterns. Increased flexibility around working hours has shifted a large portion of demand from the single weekend shopping trip to more frequent but smaller mid-week shopping stops. This has been a drag on central business district core retail locations but a boon for necessity focused centers in first ring (or further) suburbs. Additionally, the pandemic years have seen a marked increase in buy online pick up in store (BOPIS). As we further detail below, retailers have fully accepted the need for omni-channel distribution, which is the ability for customers to purchase and receive orders through any “channel” they choose. Aside from BOPIS introduced above, customers can buy online for home delivery, buy in store for home delivery, or go the traditional route of buying in a store and leaving with the product in hand. Further, the system becomes even more important when you consider returns (historically a thorn in retailers’ side).
Omni Channel Distribution is Essential
BOPIS and curbside pick-up were borne out of convenience for the consumer. However, aside from some up front reconfiguration costs, curbside pick-up also has the added benefit of boosting margins for the retailer. Figure 2 highlights an illustrative store reconfiguration to build out and cordon off its in-store pick-up capabilities. The reconfiguration includes adding ~3,000 square feet (or sqft) of stockroom space as well as a 2,000 sqft in-store pick-up section. Overall this modest adjustment is expected to increase inventory and distribution capabilities by over 100%! Retailers and landlords will continue to refine their layouts and processes, but the pandemic certainly pushed forward the transition.
SITC Company Presentation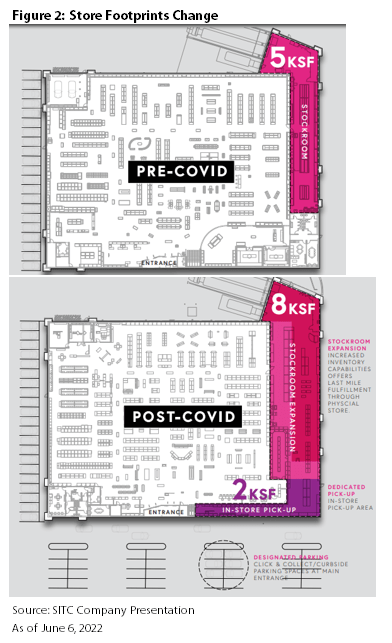
Retailers are Behind on Expansion Plans
Throughout 2015-2019, there was an endless stream of pundits calling for the end of brick and mortar retail. Now, due to the rise in the work from home trend and the omni-channel strategies noted above, many retailers across the space are finding themselves underinvested in brick and mortar retail locations. With that backdrop, even increased market uncertainty has not been enough to slow down the pace of openings. Specifically, through the first seven months of 2022 retail store openings had been nearly double the level of closures. This compares to 2019 when retailers closed nearly double the amount of stores than they opened. In all, Coresight Research reported a net gain of more than 49 million sqft year to date through July. With only minimal supply additions coming online, the availability of retail space has been steadily declining over the past 7 quarters (Figure 3).
CBRE
In particular, off-price retail has been driving net store openings, a trend we expect to continue even in declining economic conditions. Looking at some specific company examples, TJX (TJX) planned to open 150 new TJ Maxx stores in 2022, while Burlington (BURL) and Ross (ROST) planned almost 200 new stores between the two of them. Another group seeing record growth levels is the quick service restaurant (QSR) space. Shopping center REITs have benefited from the growth in these free-standing single tenant stores by developing peripheral lots (known as ‘out-parcels’) in under-utilized portions of parking lots, unlocking substantial value with little new investment. Figure 4 highlights the 2022 store opening plans for 2022 by company, many of whom compete over the same configuration of spaces and in the same markets.
JLL Research, PNC Creditntell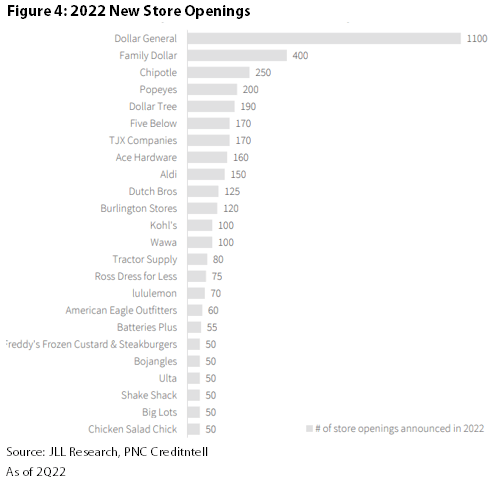
Potential Bankruptcies/Store Closures
We are constantly monitoring retailer watch lists to judge exposure across the REITs. Obviously the pandemic greatly impacted cinemas, which remain under pressure, but more recently Bed Bath & Beyond (BBBY) has been in the news for announcing store closures.
First, BBBY was on almost every retailer watch list before the pandemic started, and was certainly not a ‘coveted’ tenant driving traffic to retail centers. Additionally, bankruptcies are not single day events; many stores are still cash flow positive and creditors would keep them open through a reorganization to retain the most value for the shareholders. Finally, junior box space is the most competitive leasing space at shopping centers today. This means that most of the management teams we speak with would be delighted for Bed Bath to hand back any space as they could likely upgrade the tenant list while also increasing rents.
Supply/Demand Balance Drives Strong Leasing
When strong demand meets weak supply, the result is typically the same: increasing asking rents, leasing activity, and occupancy. Retail leasing has not been an exception. Even with the likelihood of a recession, most of the shopping center REITs have recorded record leasing volume in recent quarters. And, as a result, as Figure 5 highlights, asking rents have been on a solid upward trajectory since 2018.
CBRE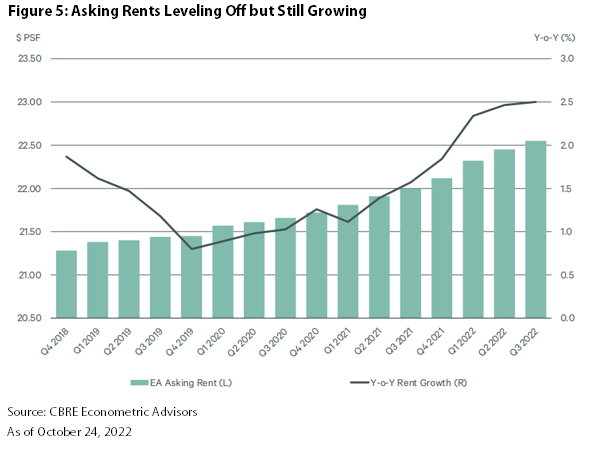
Signed Not Operating Pipelines Continue to Grow
Additionally, it is important not to forget about leasing that has already “occurred” but has not started paying rent, also called the signed not operating (SNO) pipeline. Highlighted in Figure 6, the average shopping center REIT in our coverage has a 273-bps spread between leases signed and leases operating as of 2Q22 financials. Remember, it typically takes several months (or longer for larger boxes) between a lease being signed and the tenant entering the property. What does this mean? Even if economic conditions lead to a slowdown in new leases signed, shopping center REITs will continue to see the higher occupancy and cash flow, assuming bankruptcies don’t accelerate meaningfully. Specific to SITE Centers (SITC), as of 2Q22, the spread of 340 bps in their SNO pipeline represented $22 million of new rent commencing by 2024 (or 5% of current annualized base rent). Furthermore, that pipeline is represented by 75% national tenants. Although there is always a risk companies could go bankrupt, this kind of tenant quality engenders a strong level of confidence.
Mizuho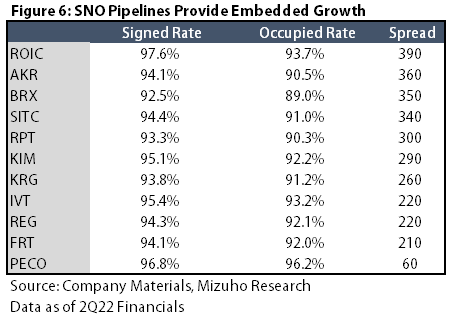
External Growth initiatives
Unsurprisingly, the fastest period of rising rates in 40 years has led to the acquisition market cooling significantly. The bidding pools have shrunk meaningfully as debt costs have made it difficult for transactions to pencil. There is potential that the public REITs could be a beneficiary of the high debt costs given private owners tend to use more debt (and more floating rate debt). If long term interest rates remain high well into 2023, we expect overleveraged landlords with meaningful floating rate debt exposure to capitulate and lower their asking prices for properties. This would lead to higher cap rates, which could be more accretive for public REITs, and drive earnings higher.
How Are We Positioned?
While we are positive on shopping center REITs – the Chilton REIT Composite is overweight by ~290 bps versus the MSCI US REIT Index (Bloomberg: RMZ) as of October 31st, 2022 – we believe that some provide a better risk-adjusted return prospect than others. Overall we look for companies with exposure to 1) the Sunbelt, 2) grocery-anchored stores, and 3) located in wealthy suburbs. Additionally, same as with any public REIT, we are focused on the names with the most flexible balance sheets and tenured management teams that provide growth at a good value.
Bloomberg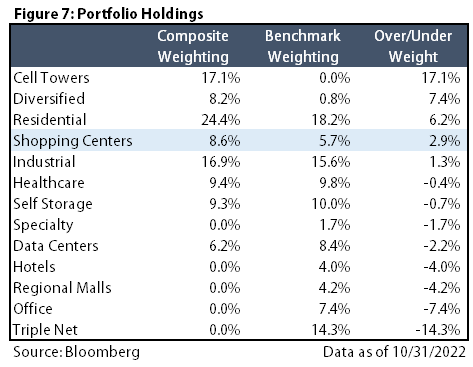
Be the first to comment