

Bilanol
Shoals Technologies’ (NASDAQ:SHLS) innovative solutions for customers provide strong market positioning and solid financials for the company. As a leader in one of the fastest-growing solar industries, Shoals will benefit from market acceleration across its various product lines, including utility-scale solar, energy storage, and EV charging infrastructure. Shoals might be a buying opportunity for patient investors who believe supply chain issues and regulatory barriers are temporary.
In this analysis, I explain why I’m bullish on the fundamentals long term, but rate the stock a hold – I acknowledge that shares might have limited upside until some concerns are cleared.
Overview
Shoals provide electrical balance of system (EBOS) solutions for utility-scale solar, solar storage, and EV charging infrastructure. EBOS has all the pieces needed to move power from a solar panel to an inverter and, ultimately, to the grid. They sell these critical components to engineering, procurement, and construction firms (EPCs) that build solar energy solutions. The benefits of EBOS’s “plug-and-play” design are that it requires very little technical knowledge or experience when installing the components.
Management’s strategy for the company thus far has been focused on growth. Growth opportunities are abundant, and the company is executing well by signing new customers, developing new products, and expanding internationally. Shoals is in the early stages of growth and generating many pieces of its business model, and as they all come together should translate to higher revenues in the future.
Q3 2022 Investors Presentation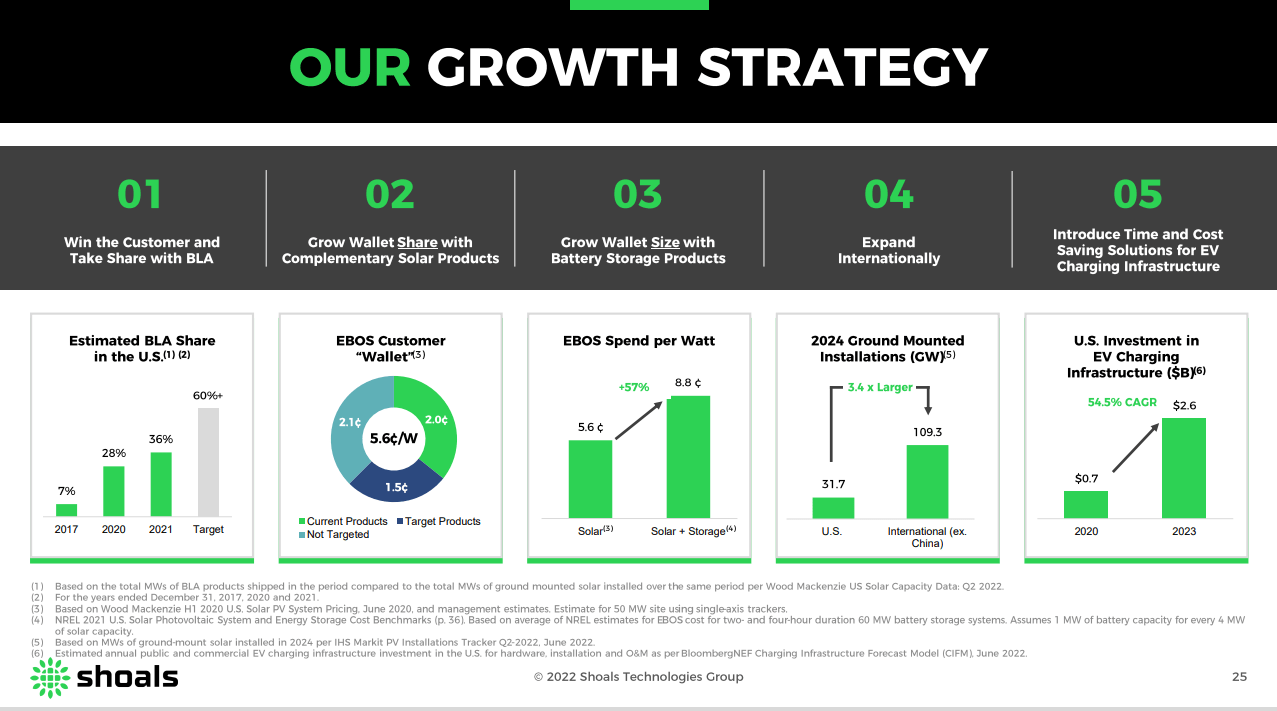
From a financial standpoint, the company has had a proven track record since its IPO in 2019. Revenues, gross profit, and adjusted EBITDA have grown at a CAGR of 22%, 37%, and 31%, respectively. Furthermore, Shoals reported record Q3 2022 results beating analyst expectations and reaffirming FY22 guidance. Backlog and awarded orders increased 74% and 44% versus the same time last year, respectively, which suggests a potential upside to the FY23 outlook.
Cash Conversion Cycle
One of several measures of management effectiveness and profitability is analyzing the company’s cash conversion cycle (CCC), also known as operating working capital. This metric measures how much time a company needs to convert inventory into cash. For industrial companies, the cycle starts when a business purchases raw materials, which are converted into finished goods, then sold, and receives payment from customers to end the cycle.
The three core accounts that makeup operating working capital are Accounts Receivable, Inventory, and Accounts Payable. Companies that are disciplined in controlling the collection of receivables, managing inventory effectively, and delaying payments to vendors will have a low cash conversion ratio.
The metric is calculated in three parts:
Days of Inventory Outstanding (DIO) = Inventory / COGS * days
Days of Sales Outstanding (DSO) = Accounts Receivable / Revenue * days
Days of Payables Outstanding (DPO) = Accounts Payable / COGS * days
Cash Conversion Cycle (CCC) = DIO + DSO – DPO
Shoals Cash Conversion Cycle Metrics:
Company Filings Prepared by Author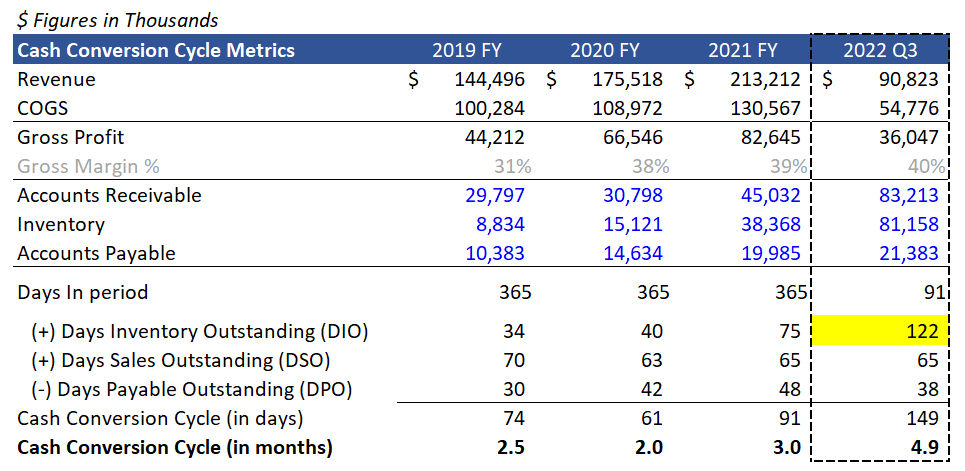
The custom nature of Shoals system solutions and the long development cycle for solar energy projects is evident due to their relatively high conversion ratio. For the 2021 fiscal year, it took Shoals 91 days (three months) to convert its inventory to cash, which has increased from 61 days (two months) at the end of 2020. In their 2022 Q3 earnings results, the cash conversion cycle jumped to 149 days (4.9 months). You can see that the inventory outstanding days are growing while receivable and payable days remain flat, resulting from too much inventory building up on the balance sheet. Shoals is sitting on $81m of inventory as of 2022 Q3 compared to $9m at the end of 2019. Ultimately, this indicates that too much cash is being tied up.
The basic concept of the inventory cycle starts when the product is finished and ends when a customer places an order. For Shoals, too much inventory could mean they have an unnecessary amount of raw materials or finished goods in the queue that they cannot sell. Management has stated that they do not stock large amounts of finished goods, so it’s likely that they’re sitting on too many raw materials.
Inventory buildup will eventually flow to the COGS on the income statement, which could suggest that gross margins deteriorate in the future. Gross margins have improved from 31% at the end of 2019 to 40% as of 2020 Q3. At the same time, inventory turnover days grew from 34 days to 122 days. Thus, as the inventory turnover ratio decreases (improves) and products move faster, gross margins should come down as COGS is impacted. During their recent earnings call, management noted that it has “opportunities to optimize working capital, particularly inventory and accounts receivable, in the coming quarters.”
Solar Demand Thwarted by Regulatory Barriers
Two key assumptions pose a risk to Shoal’s long-term success. First, demand for solar projects falls short of expectations, and second, government policy obstructs the deployment activity of renewable projects.
Demand risk is far less of a concern since a central theme over the last decade has been a push for green technology and a shift toward a zero-carbon-based world. Most countries have committed to carbon neutrality by 2050, which has led to an influx of investments in renewable energies. Shoals can benefit from demand tailwinds as more solar projects are deployed. It’s improbable that demand for solar energy will decelerate, especially after the Inflation Reduction Act (IRA) incentivizes solar adoption by allowing energy tax credits.
In JPMorgan’s 2022 Annual Energy Paper, they highlight why it’s so hard to get transmission projects approved and built. In summary, the current process is inefficient due to poor project management, and it can take up to 4 years to obtain a connection permit. Obstacles such as federal eminent domain, jurisdictions blocking multi-state line projects, and interconnection queue capacity issues can impede achieving a permit. U.S. transmission infrastructure has been growing at only 2% per year since the 1970s, and some projections now estimate just 1% of transmission growth until 2030. Compare that to the grid expansion required to achieve net-zero requirements, and you can see we’re not on track to meet this lofty goal.
J.P Morgan 2022 Annual Energy Paper, pg 12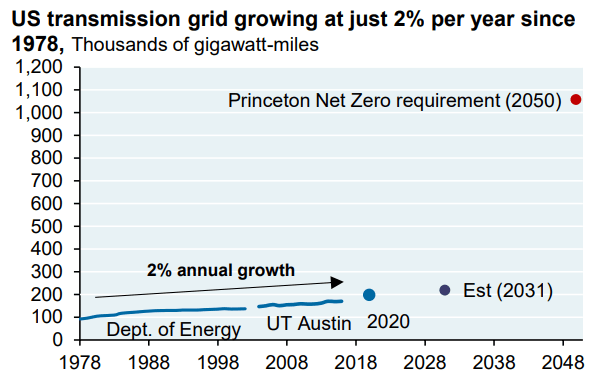
The paper also examined transmission projects in 15 midwestern and southern states (MISO region) and found that less than 50% of renewable energy projects ended up being completed. Evidence for this is shown in the chart on the top right.
J.P Morgan 2022 Annual Energy Paper, pg 14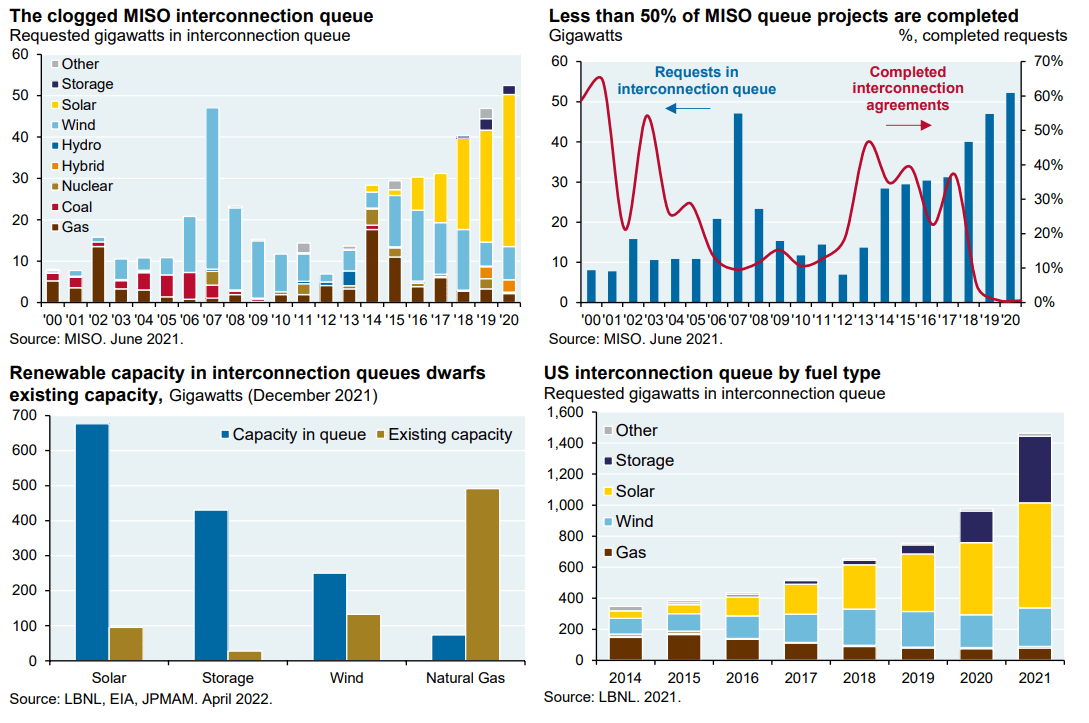
The graph on the top left shows the requested GW of generation entering the interconnection queue each year by renewable type. The yellow bars represent the growing backlog of solar projects, and you can see the enormous pipeline of projects. A timetable for the completion of these projects is still being determined due to the obstacles discussed earlier. The graphs on the bottom continue to highlight that there are a lot of solar projects “in limbo” relative to the existing capacity and that solar energy is the preferred fuel source compared to wind and natural gas.
There is a disconnect between what lawmakers are lobbying for versus what regulatory groups are opposed to highlighting the inefficiencies of incorporating more renewable sources onto the grid. Despite the political risk, I believe the solar project success rate will increase over the long run as regulators are pressured to meet net-zero carbon goals and forced to unclog the backlog of solar projects waiting to be connected. However, this might take time to work out as the jurisdictional process is known to be slow-moving.
Peer Comparison
Below is a table of relevant valuation metrics for Shoals compared to its related peers SunPower Corp. (SPWR), Array Technologies (ARRY), and First Solar (FSLR).
| Shoals Technologies Group, Inc. | SunPower Corporation | Array Technologies, Inc. | First Solar, Inc. | |
| Market Cap ($M) | $ 3,759 | $ 3,837 | $ 2,902 | $ 16,377 |
| Price/Sales (TTM) | 10.9 | 2.2 | 2.1 | 6.7 |
| EV/EBITDA (FWD) | 33.3 | 39.6 | 31.1 | 53.4 |
| Revenue 3 Year (CAGR) | 27% | 16% | 43% | 2% |
| Gross Profit Margin | 38% | 17% | 11% | 12% |
| Cash From Operations ($M) | $ 7.6 | $ (172.3) | $ (53.3) | $ 112.6 |
| Capital Expenditures ($M) | $ (4.0) | $ (43.0) | $ (7.8) | $ (771.5) |
| 10 Year Price Performance | – | 759% | 519% | 587% |
| Altman Z Score | 3.5 | 1.4 | 1.8 | 4.8 |
Source: Seeking Alpha
The metrics above depict how the market views Shoal’s current valuation. With the highest price-to-sales ratio relative to peers, Shoals investors pay a premium for their high revenue growth and robust gross margins. Gross margins are 14% points higher than its peer average. Shoals is the least capital-intensive amongst its peers and generates positive cash flow from operations.
Shoals’ competitors have been around for a decade and have produced an average absolute return of 620% (20% CAGR) since then. The market is pricing in the assumption that shoals will generate similar returns as it’s trading at higher multiples.
Additionally, Shoals has an Altman-Z score of 3.5, which is in the “safe zone.” This is an essential metric for emerging growth companies as the Altman Z-Score model is an accurate forecaster of failure up to two years before distress.
Final Thoughts
Shoals is a great company that has created a faster and more efficient electric installation solution for its customers. While the focus has been on solar solutions thus far, the EV system solutions are shipping, providing additional growth and diversification benefits as the electric vehicle battery storage market evolves. Additionally, increasing solar energy demand will help the company grow long term.
Be the first to comment