

Bryan Bedder/Getty Images Entertainment
Sherwin-Williams (NYSE:SHW) is a leader in the paints and specialty coatings business. They are largely focused on the Americas; however, they do manufacture and distribute their offerings throughout the Caribbean, Europe, and the Asia-Pacific region.
SHW Global Presence (SHW 2022 Investor Presentation)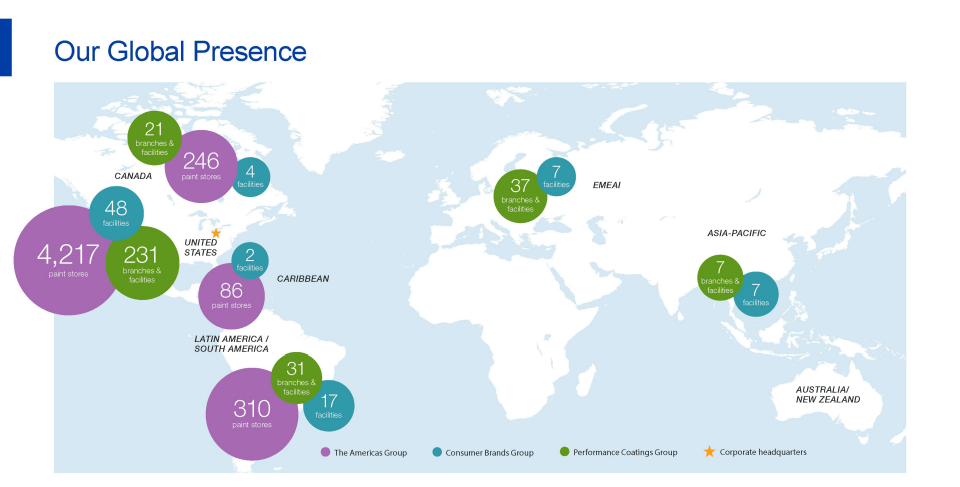
Sherwin-Williams is organized into three operating segments: (1) The Americas Group, (2) Consumer Brands Group, and (3) Performance Coatings Group.
Sherwin-Williams is largely tied to the residential markets through their relationships with professional painters. Pro painters rely on being able to get a consistent and quality product and Sherwin-Williams’ 4,850+ stores allow quick and easy access. While a potential continued cooling in the housing market would be a short-term headwind for Sherwin-Williams it shouldn’t be a long-term structural issue.
SHW US Architectural Paint Industry (SHW 2022 Investor Presentation)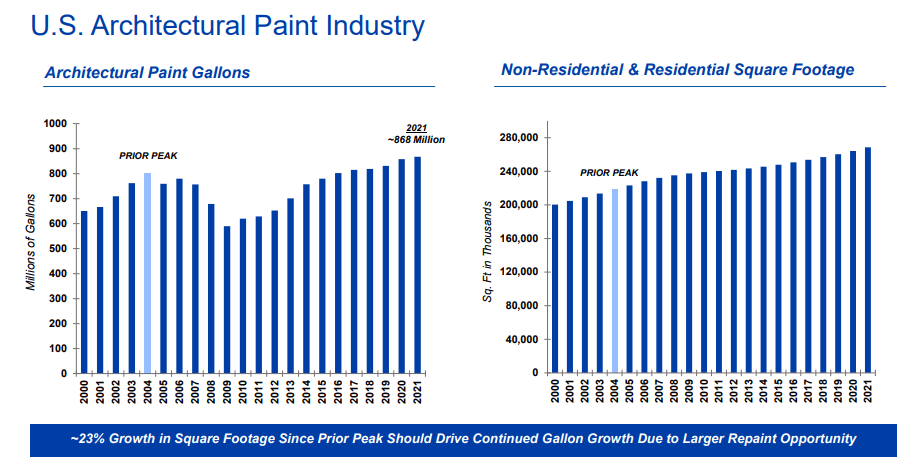
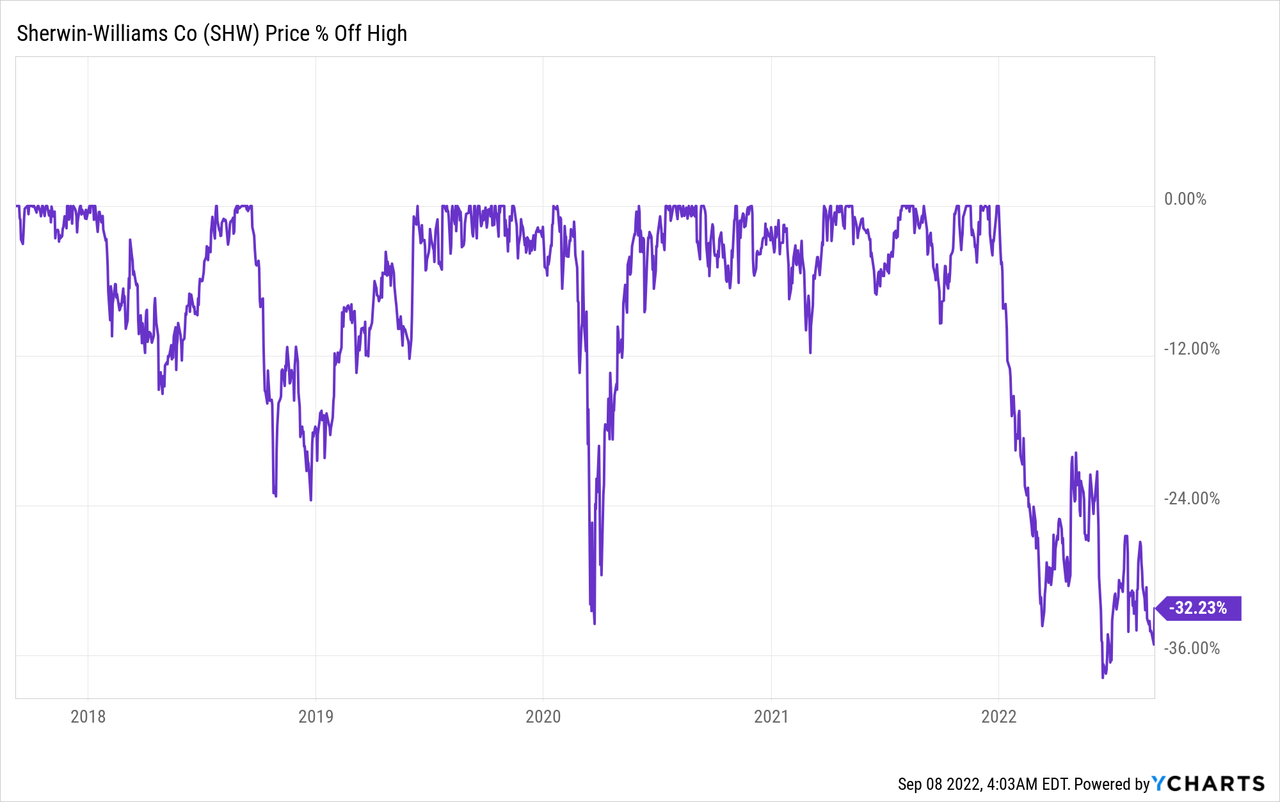
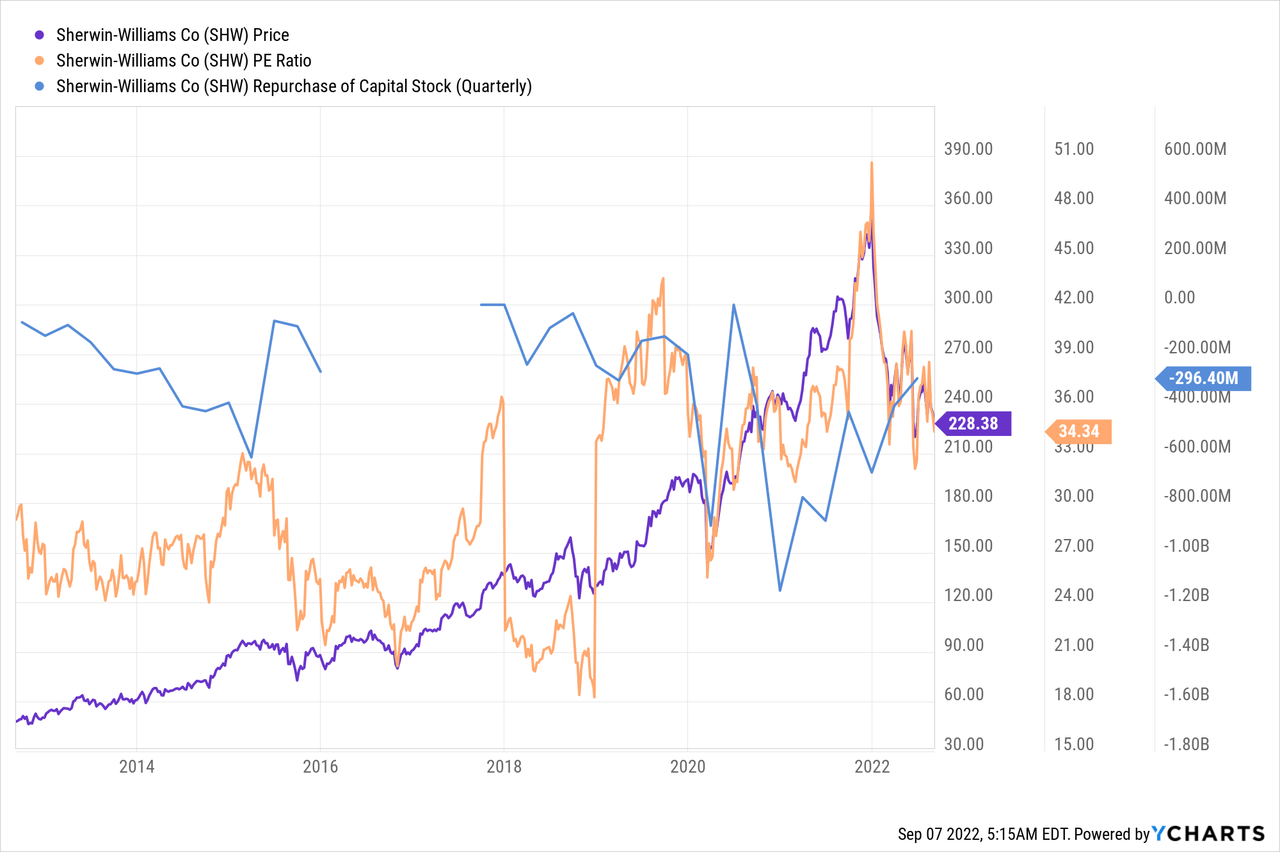
Sherwin-Williams’ share price is down 32% from its high reached in late 2021. Believe me I’ve felt that as I’ve seen my stake dwindle down in value. However, I believe that I purchased shares at what will prove to be fair value when looking at the long-term although in hindsight I should have been more nimble with a decision to at least trim back the position.
Seeing shares in what I believe is a quality business that should continue to reward shareholders over time with both strong dividend growth and capital appreciation, I wanted to re-examine the business to see if it makes sense to add to my stake.
Dividend History
The dividend growth strategy is the one that I gravitated towards most when I began investing in individual businesses. As such my goal is to find businesses with a consistent track record of growing their dividend over time and to purchase said businesses at reasonable valuations.
Sherwin-Williams Dividend History (Sherwin-Williams Investor Relations)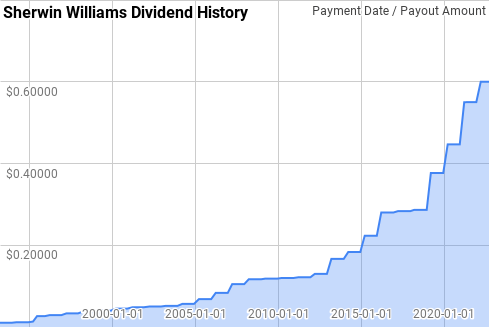
According to the CCC list, Sherwin-Williams is a Dividend Champion with 43 consecutive years of dividend growth. Dividend growth has had periods of underwhelming growth; however, over time dividend growth has been quite impressive.
Dating back to 1993, year over year dividend growth from Sherwin-Williams has ranged from 1.2% to 100.0% with an average of 16.1% and a median of 11.8%.
Over that same time there’s been 25 rolling 5-year periods with annualized dividend growth spanning from 4.4% to 29.2% with an average of 13.4% and a median of 13.2%.
There’s also been 20 rolling 10-year periods with Sherwin-Williams’ annualized dividend growth coming in between 9.4% and 17.3% with an average of 12.6% and a median of 12.2%.
The rolling 1-, 3-, 5-, and 10-year annualized dividend growth rates from Sherwin-Williams since 1993 can be found in the following table.
| Year | Annual Dividend | 1 Year | 3 Year | 5 Year | 10 Year |
| 1993 | $0.042 | ||||
| 1994 | $0.047 | 11.82% | |||
| 1995 | $0.093 | 100.00% | |||
| 1996 | $0.117 | 25.00% | 40.87% | ||
| 1997 | $0.133 | 14.29% | 41.90% | ||
| 1998 | $0.150 | 12.50% | 17.13% | 29.16% | |
| 1999 | $0.160 | 6.67% | 11.10% | 27.94% | |
| 2000 | $0.180 | 12.50% | 10.52% | 14.04% | |
| 2001 | $0.193 | 7.41% | 8.83% | 10.63% | |
| 2002 | $0.200 | 3.45% | 7.72% | 8.45% | |
| 2003 | $0.207 | 3.33% | 4.71% | 6.62% | 17.35% |
| 2004 | $0.227 | 9.68% | 5.45% | 7.21% | 17.12% |
| 2005 | $0.273 | 20.59% | 10.97% | 8.71% | 11.34% |
| 2006 | $0.333 | 21.95% | 17.27% | 11.51% | 11.07% |
| 2007 | $0.420 | 26.00% | 22.83% | 16.00% | 12.16% |
| 2008 | $0.467 | 11.11% | 19.52% | 17.69% | 12.02% |
| 2009 | $0.473 | 1.43% | 12.40% | 15.87% | 11.46% |
| 2010 | $0.480 | 1.41% | 4.55% | 11.92% | 10.31% |
| 2011 | $0.487 | 1.39% | 1.41% | 7.86% | 9.67% |
| 2012 | $0.520 | 6.85% | 3.18% | 4.36% | 10.03% |
| 2013 | $0.667 | 28.21% | 11.57% | 7.39% | 12.43% |
| 2014 | $0.733 | 10.00% | 14.65% | 9.15% | 12.46% |
| 2015 | $0.893 | 21.82% | 19.77% | 13.23% | 12.57% |
| 2016 | $1.120 | 25.37% | 18.88% | 18.14% | 12.88% |
| 2017 | $1.133 | 1.19% | 15.62% | 16.86% | 10.44% |
| 2018 | $1.147 | 1.18% | 8.68% | 11.46% | 9.41% |
| 2019 | $1.507 | 31.40% | 10.39% | 15.49% | 12.28% |
| 2020 | $1.787 | 18.58% | 16.38% | 14.87% | 14.05% |
| 2021 | $2.200 | 23.13% | 24.26% | 14.46% | 16.28% |
| 2022* | $2.400 | 9.09% | 16.79% | 16.19% | 16.53% |
Source: Author; Data Source: Sherwin-Williams Investor Relations
*Assumes a 4Q payment of $0.60 per share is declared and paid.
The humble dividend payout ratio gives you a lot more information about the business other than just how much of the profits or free cash flow has been committed to rewarding shareholders. A flat payout ratio lets you know that any dividend growth over time has been supported by growth improving company fundamentals.
SHW Dividend Payout Ratios (SHW SEC filings)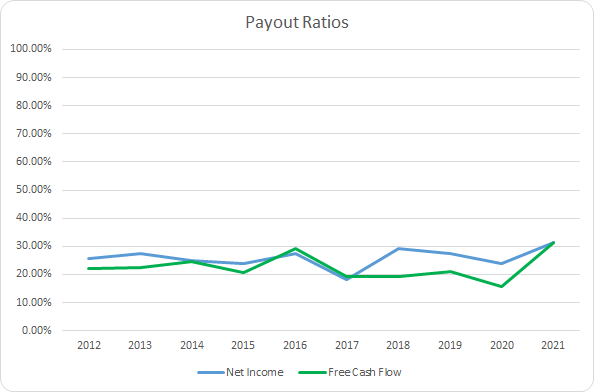
Even in the face of very strong dividend growth, Sherwin-Williams’ underlying profits and cash flows have justified that rapid growth. The 10-year average net income payout ratio for Sherwin-Williams is 25.9% with the 5-year average coming to 26.0%. Similarly, the free cash flow payout ratios are 22.5% and 21.3%, respectively.
Sherwin-Williams’ dividend has historically been well covered by both profits and cash flow and if that trend continues then I fully expect dividend growth to be quite strong over time.
Quantitative Quality
A lengthy dividend growth history is just one metric that I want to see from my investments. When looking into a company I like to track the business across a wide variety of financial metrics and ratios to see how the business has changed over time. This helps me to get a grasp on the financial capabilities of the underlying business and in turn get a feel for the quality of the enterprise.
SHW Revenue Profits and Cash Flow (SHW SEC filings)
Sherwin-Williams has had a very strong run over the last decade with improving fundamentals. With organic growth as well as the Valspar acquisition, revenues grew by 133.7% over the last decade or 9.9% annualized. Gross profits lagged slightly behind, rising 103.1% or 8.2% annualized.
Meanwhile operating profits surged forward by 183.6% or 12.3% annualized with operating cash flow rising by 152.8% or 10.9% annualized. Free cash flow was equally impressive showing a total increase of 156.2% or 11.0% annualized.
Good businesses should be able to defend their positions and margin structure over time. Generally I would expect to see margins at least stable and more than likely rising as they flex their strengths versus competitors. I prefer to see free cash flow margins greater than 10%.
SHW Margins (SHW SEC filings)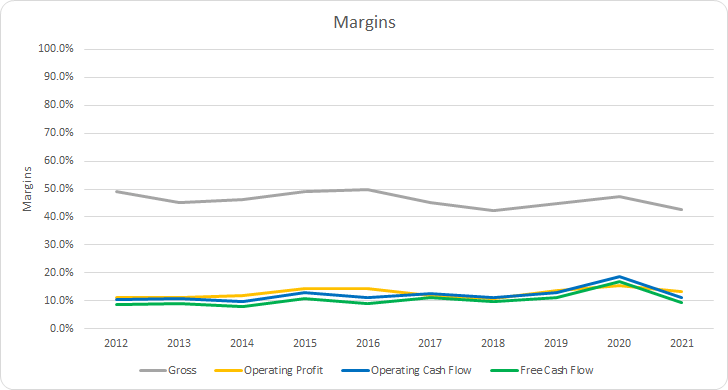
Sherwin-Williams has averaged a 46.3% gross margin over the last decade with the 5-year average coming to 44.5%. The current inflationary environment has exacerbated that with gross margins down to 41.0% for the TTM period; however, the trend was already in place well before that.
Sherwin-Williams’ free cash flow margin hasn’t been the most consistent surpassing 10% in just 4 of the last 10 years. Although the 10-year average free cash flow margin is 10.3% with the 5-year average coming to 11.6%.
Margins are important to track; however, I place more weight on the free cash flow returns versus some measure of capital, i.e. assets, invested capital, tangible capital, or capital employed. I believe these metrics give a better idea of the capital efficiency of the business as margins are largely determined by the sector of the economy that a business operates in. My preference is to see stable and improving FCF ROIC’s over time that are greater than 10%.
SHW Free Cash Flow Returns (SHW SEC filings)
We see quite a bit of variability in the FCF returns from Sherwin-Williams over the last decade. Despite the variability they have maintained strong FCF ROA which surpassed 10% in 6 of the last 10 years. The 10-year average FCF ROA for Sherwin-Williams is 12.9% with the 5-year average working out to 10.2%.
When looking at the FCF ROIC Sherwin-Williams once again has seen large fluctuations; however, they have maintained >10% each year over that time although there was a significant drop leading up to the Valspar acquisition that they are still working to recover from. The 10-year average FCF ROIC comes to 22.4% with the 5-year average at 14.9%.
The FCF ROTC attempts to try and figure out the returns on the tangible assets the business controls by removing things such as goodwill and intangibles from the capital base. Goodwill especially is a very real cost in terms of capital allocation as overpaying for acquisitions will be a drag on future returns; however, it doesn’t really effect the return the business is able to generate. The 10-year average FCF ROTC comes to 68.6% with the 5-year average at 73.3% and has remained strong even after the Valspar acquisition.
To understand how Sherwin-Williams uses its free cash flow I calculate three variations of the metric, defined below:
- Free Cash Flow, FCF: Operating cash flow less capital expenditures
- Free Cash Flow after Dividend, FCFaD: FCF less total cash dividend payments
- Free Cash Flow after Dividend and Buybacks, FCFaDB: FCFaD less net cash spent on share repurchases
SHW Free Cash Flows (SHW SEC filings)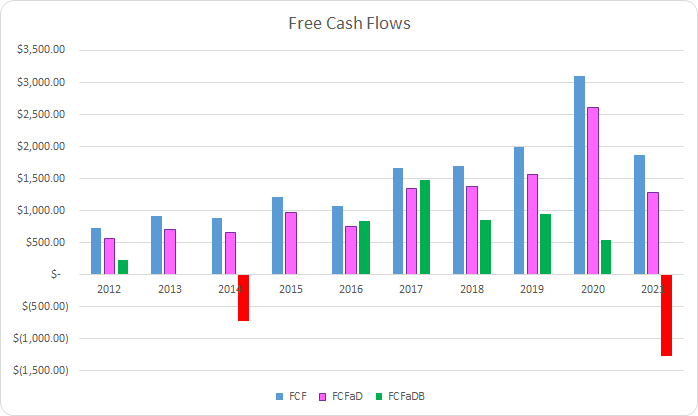
Sherwin-Williams has been able to generate roughly its market cap from 10 years ago in FCF over the ensuing decade. In total the business generated $15.1 B in FCF while sending $3.3 B back to shareholders via dividends. That puts the cumulative FCFaD at $11.9 B for the last decade.
Sherwin-Williams has also spent a net total of $8.9 B on share repurchases over that time. That brings the cumulative FCFaDB to $2.9 B. Sherwin-Williams has been a bit inconsistent with their share repurchases, which I like to see as it points to potential attempts to be aggressive when the valuation is cheap.
Of the cash returned to shareholders through dividends and share repurchases over the last decade roughly $0.36 was paid in dividends for every net $1.00 on share buybacks.
Share repurchases can be an additional way for management teams to return additional cash to shareholders. While I would prefer special dividends, I understand that most businesses will opt for buybacks.
SHW Shares Outstanding (SHW SEC filings)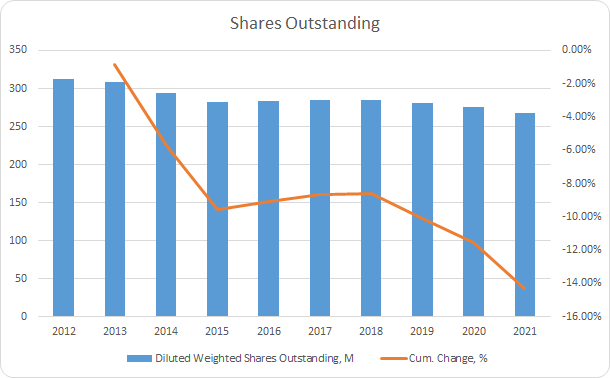
Sherwin-Williams has seen its share count fall by 14.3% in total with the $8.9 B net spent on share repurchases. That works out to around a 1.7% annual decline. The bulk of the reduction came in 3 years: FY 2014, FY 2015, and FY 2021 which showed year over year declines of 4.9%, 4.1% and 3.2%, respectively.
My aim for my investment capital is to find opportunities where I believe I can invest my capital with an intermediate term outlook, i.e. 3-5 years at a minimum. As such I want to make sure the balance sheet appears safe and not excessively leveraged and potentially putting my equity stake at risk should the interest rate environment change.
SHW Debt to Capitalization (SHW SEC filings)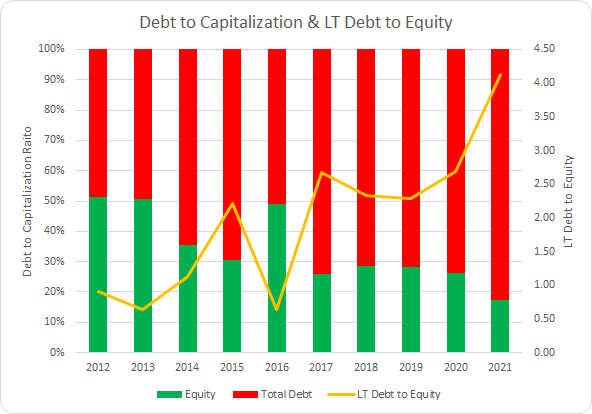
Sherwin-Williams is financed in large part through debt. The 10-year average debt-to-capitalization ratio for Sherwin-Williams is 66% with the 5-year average up to 75%. This is a yellow flag; however, it’s partially offset by Sherwin-Williams’ debt schedule which doesn’t have a sizable maturity until 2024 and 2025 which adds flexibility. Additionally the debt they do carry is largely very low, historically speaking, in terms of interest rates.
SHW Debt Schedule FY 2021 (SHW FY 2021 Annual Report)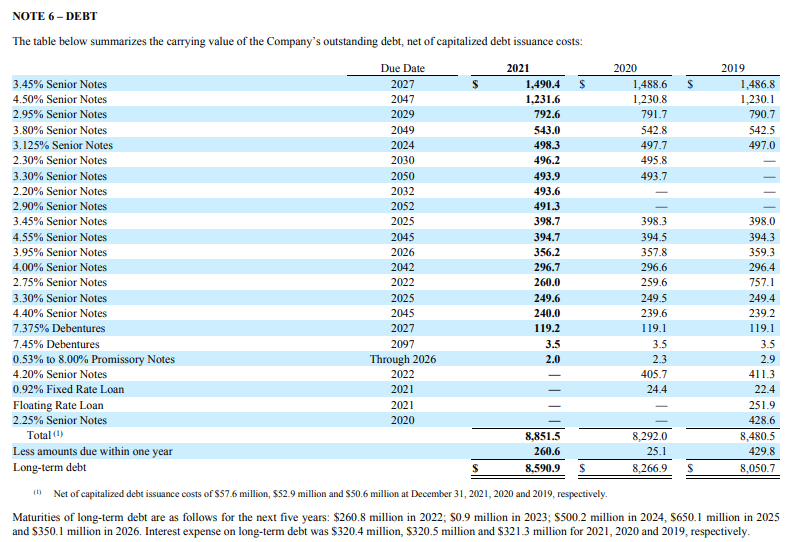
In my opinion the net debt ratios give a better idea of the leverage placed upon the business. The net debt ratio examines the level of net debt compared to some measure of profits or cash flow and represent how quickly the business could extinguish all of its outstanding debt.
SHW Debt Ratios (SHW SEC filings)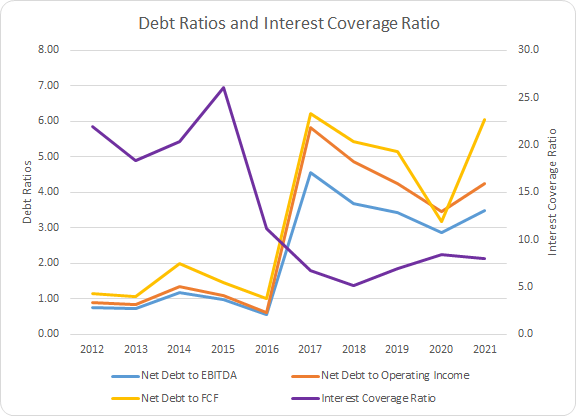
The 10-year average net debt-to-EBITDA, net debt-to-operating income, and net debt-to-FCF for Sherwin-Williams comes to 2.2x, 2.7x, and 3.3x, respectively. The 5-year averages work out to 3.6x, 4.5x, and 5.2x accordingly.
Sherwin-Williams carries a bit more debt than I’d like to see; however, given the maturity schedule and relatively low interest rates there’s no major concern for me at this time.
Valuation
Identifying a business is only part of the problem when it comes to investing in individual businesses. One must also determine a fair price to pay for that asset. When determining a fair value for the business I utilize several valuation methods in order to home in on an attractive price to pay. The valuation methods that I use are dividend yield theory, a reverse discounted cash flow analysis, and a minimum acceptable rate of return, “MARR”, analysis.
Dividend yield theory is a simple valuation model that bases the valuation around the dividend yield that shares offer. The idea is that over time investors, collectively, will value a business such that it offers a similar dividend yield and will gravitate back towards the normal dividend yield.
Sherwin-Williams Dividend Yield Theory (SHW Investor Relations and Google Finance)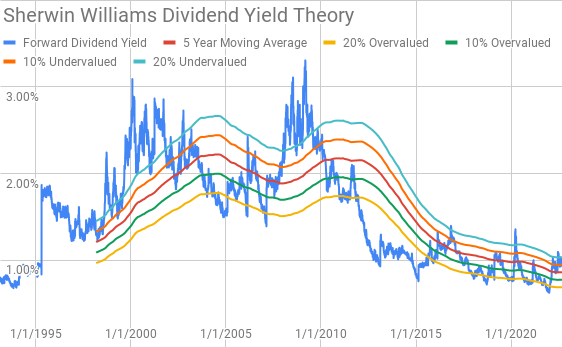
Over the last decade Sherwin-Williams has seen its dividend yield cut in half from roughly 2% annually to being fairly consistently around 1% since around 2012/2013.
The yield bands appear to mark points of intermediate-term under- and -overvaluation. The 5-year average forward dividend yield for Sherwin-Williams is 0.86% and shares currently offer a forward yield of 1.01%.
A reverse discounted cash flow analysis can be used to reverse engineer the growth and margin structure that a business must have in order to generate the cash flows that would justify the current valuation.
I use a simplified DCF model built on revenue growth, an initial FCF margin of 8.5% that improves to 12.5% during the forecast period. The terminal growth rate is estimated at 3.0%.
For the discount rate I’ve used an after-tax cost of debt of 3.21% along with both a 10% and 8% cost of equity. That yields an 8.9% discount rate for the 10% cost of equity scenario and 7.2% for the 8.0% cost of equity.
Under those assumptions Sherwin-Williams needs to grow revenues 11.1% annually during the forecast period in order to generate the cash flows that would support purchasing shares at the current valuation at a 10% return target. With the 8% cost of equity scenario the required revenue drops to 5.7% annually over the same period.
The MARR analysis requires you to estimate the future earnings and dividends that a business will generate during a given time period. You then apply a reasonable and conservative multiple on those future earnings in order to determine what the future share price might be and calculate the expected return. If the expected return is greater than your minimum threshold for investment then you can feel free to invest.
Analysts expect Sherwin-Williams to earn $8.64 per share for FY 2022 with $10.44 in EPS for FY 2023. They also expect Sherwin-Williams to be able to grow EPS 9.5% annually for the next 5 years. I then assumed that EPS growth would slow to 5.0% annually for the following 5 years. Dividends are assumed to target a 30% payout ratio of the prior year EPS.
The following table shows the potential internal rates of return that an investment in Sherwin-Williams could generate if the assumptions from above prove to be reasonable forecasts for how the future plays out. Returns assume that shares are purchased for $238.65, Wednesday’s closing price, and that dividends are taken in cash as well as paid and increased on the schedule Sherwin-Williams has usually followed.
| IRR | ||
| P/E Level | 5 Year | 10 Year |
| 35 | 20.7% | 12.5% |
| 30 | 16.5% | 10.8% |
| 25 | 11.8% | 8.7% |
| 22.5 | 9.1% | 7.5% |
| 20 | 6.3% | 6.3% |
| 15 | -0.4% | 3.2% |
Source: Author
Additionally I use the MARR analysis framework to work backwards in order to determine the maximum that I could pay for shares today in order to generate the returns that I desire from my investments. My standard hurdle rate is a 10% IRR and for Sherwin-Williams I’ll also examine 12% and 8% return thresholds.
| Purchase Price Targets | ||||||
| 10% Return Target | 12% Return Target | 8% Return Target | ||||
| P/E Level | 5 Year | 10 Year | 5 Year | 10 Year | 5 Year | 10 Year |
| 35 | $360 | $298 | $335 | $254 | $388 | $350 |
| 30 | $310 | $258 | $288 | $221 | $334 | $303 |
| 25 | $260 | $219 | $242 | $187 | $280 | $257 |
| 22.5 | $235 | $199 | $219 | $171 | $253 | $233 |
| 20 | $210 | $179 | $195 | $154 | $226 | $210 |
| 15 | $160 | $140 | $149 | $120 | $172 | $163 |
Source: Author
How Did We Get Here?
There’s usually a stark difference between the underlying business results and the returns that investors are able to earn. I like the concept of looking at a business over time compared to the returns the stock provided to try and distill out what returns were justified by the business versus what was due to the sentiment change by investors.
Between December 31, 2012 and December 31, 2021 Sherwin-Williams’ share price rose from $51.27 to $352.16. That’s a very impressive 586.8% total gain across 9 years or a 21.3% CAGR in share price. Adding in the 1.0% yield from the start brings the total CAGR to around 22.3% over that time.
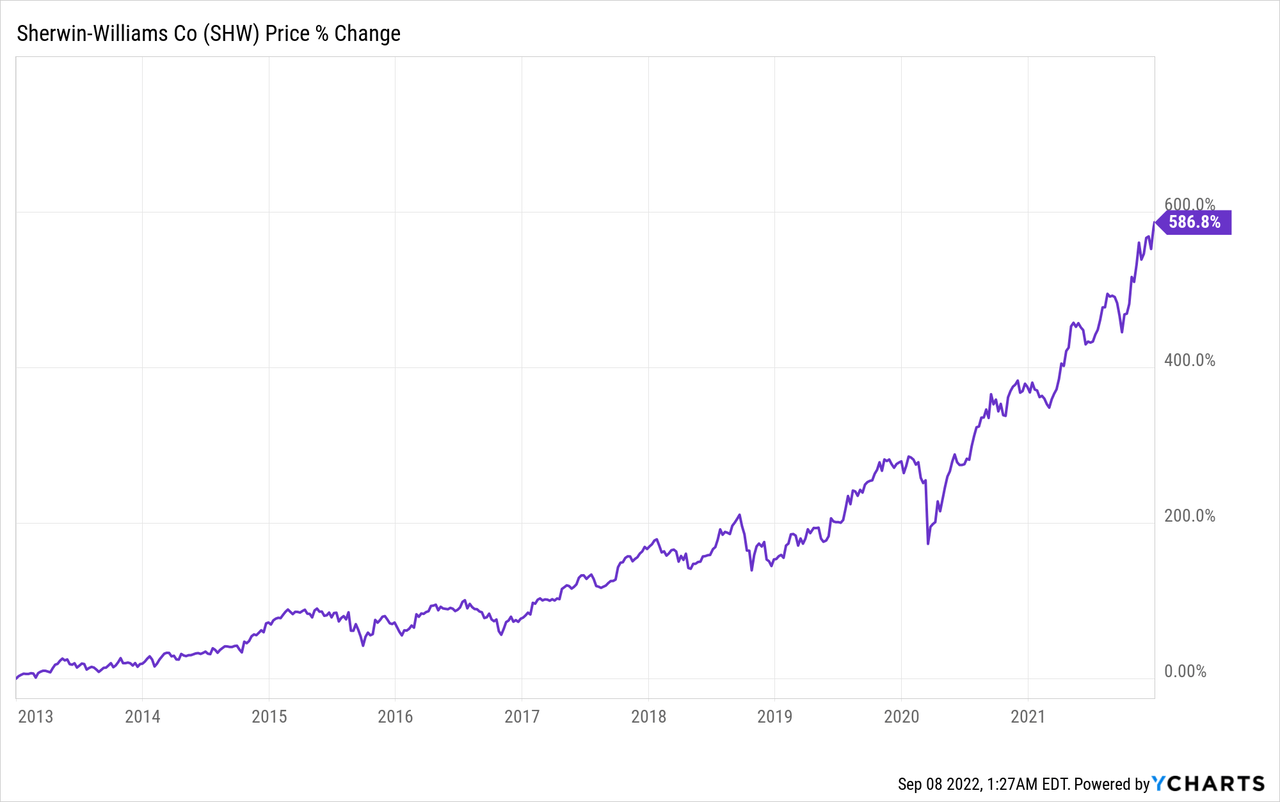
No doubt Sherwin-Williams has been a fantastic investment over that time. There’s not many companies that can boast a track record of a 22.3% CAGR.
I want to break down the returns into three components:
- Business Returns: As measured by sales growth and net profit margin
- Capital Allocation Returns: As measured by dividend yield and share repurchases
- Sentiment Change Returns: As measured by change in beginning and ending multiple
Over that 9 year period sales grew by 9.8% annually thanks to organic growth as well as the Valspar acquisition. The net profit margin increased by 26.4% accounting for 2.6% annualized returns. The total business results returns therefore come to 12.5%.
On the capital allocation front we already saw that the initial dividend yield was 1.0%. Sherwin-Williams reduced their share count over that time by 14.3% which boosted returns by 1.7% annually which brings the annualized capital allocation return attribution to 2.7%.
The multiple that investors were willing to pay for Sherwin-Williams was already rich at the beginning of the period and roughly doubled over the 9 years. That brings the sentiment change attribution of annualized returns to 7.1%.
| Annualized Returns | % of Returns | |
| Business Returns | 12.5% | 56% |
| Capital Allocation Returns | 2.7% | 12% |
| Sentiment Change | 7.1% | 32% |
| Total Annualized Returns | 22.3% |
Source: Author
The underlying business and capital allocation decisions clearly led to good results with an estimated 15.2% annualized return being justified from those two components.
However, sentiment change added a huge amount to the CAGR that investors earned over that time.
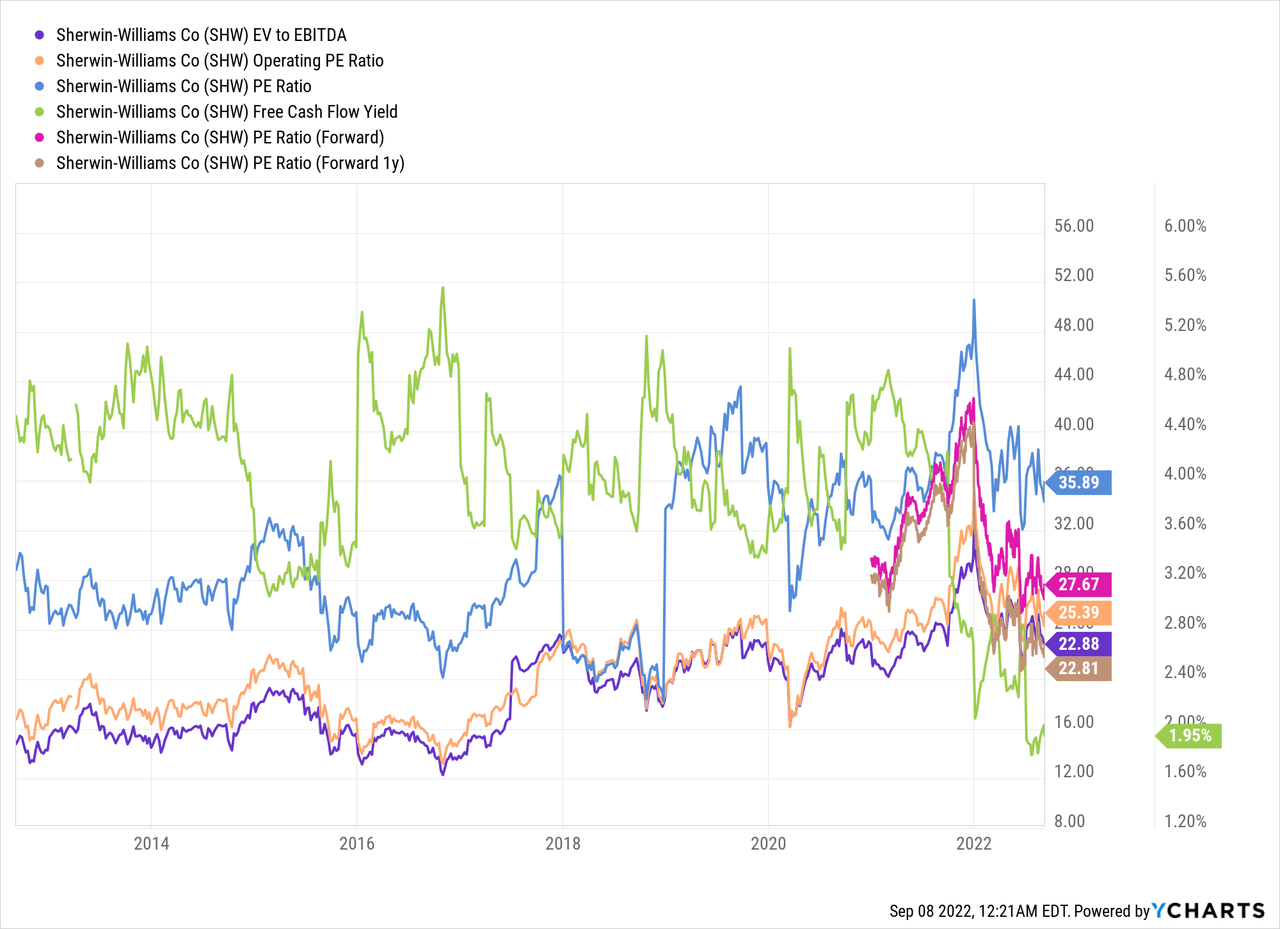
I wouldn’t expect to see sentiment returns anywhere close to 7% annualized over the ensuing decade. Given that shares are currently trading at 35.9x on a TTM basis, 27.6x on FY 2022 est., and 22.9x on FY 2023 est., sentiment change could potentially be a slight tailwind to a slight headwind. In other words I wouldn’t expect sentiment change to be a big determining factor in returns moving forward leaving us with business results and capital allocation as the primary source of returns.
Moving forward I wouldn’t be surprised to see the business results and capital allocation to offer somewhere in the area of 8-12% annualized returns.
SHW How Did We Get Here Return Breakdown (SHW SEC filings, Analyst Estimates, Google Finance)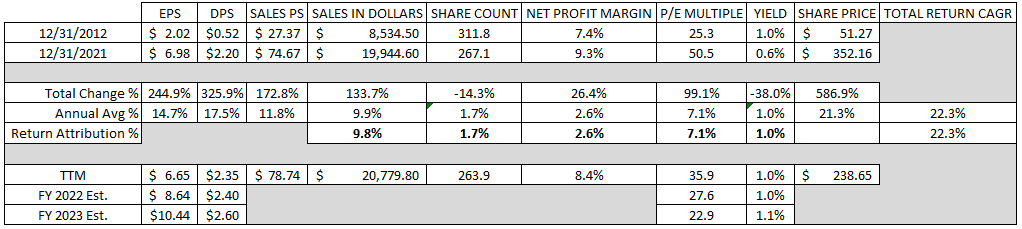
Conclusion
Sherwin-Williams is a very strong business as evidenced by the business justified returns between 2012 and 2021. Granted sales growth was aided by the Valspar acquisition although consolidation in an industry, especially a growing one, can lead to very strong returns. Sherwin-Williams doesn’t carry as strong of margins as I would have expected; however, their cash flow returns are very strong.
Dividend yield theory suggests a fair value range for Sherwin-Williams between $252 and $311 if you believe the 5-year average forward dividend yield is a good proxy for fair value. With interest rates on the rise I wouldn’t be surprised to see the average dividend yield trend back higher. That being said whenever Sherwin-Williams has approached the 10% or 20% undervalued yield band forward returns have been solid over the intermediate term.
The reverse DCF analysis suggests that 10% returns aren’t likely unless you’re quite optimistic on the future sales growth and margin expansion for Sherwin-Williams. However, 8% returns do appear quite achievable given more modest revenue growth and margin improvement.
One thing to note is that the reverse DCF does not account for potential share repurchases which I would expect to continue. Management has stated that they do not want to hoard cash which means continued buybacks, M&A, and potentially special dividends are likely in store.
SHW Capital Allocation (SHW 2022 Investor Presentation)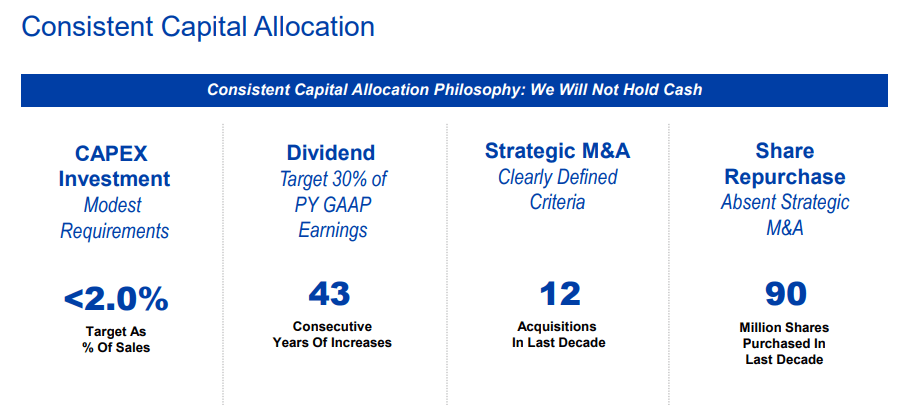
Based on the current market cap of $60 B and the average of the FY 2019 – FY 2021 and TTM FCFaD if 100% of FCFaD was committed to repurchasing shares Sherwin-Williams could reduce the share count by 2.5%. Should buybacks approach that level of annual reduction then the 8% returns would move closer to 10% on a per share basis for the reverse DCF.
Additionally the MARR analysis suggests a fair value range between $210 and $260 when targeting 10% returns 5-years out assuming a terminal multiple between 20x and 25x. With a 12% return target the fair value range declines to between $195 and $242. Meanwhile with an 8% return target the fair value range rises to between $226 and $280.
In hindsight, I think it’s pretty obvious the stock got well ahead of the underlying business by late 2021 and early 2022. So this pullback, while steep at around 32%, is very much warranted.
In my opinion Sherwin-Williams appears reasonably valued at current levels, not necessarily cheap, but reasonable. As such investors are likely to earn returns that roughly line up with the business although should inflation continue to run hot margins are likely to continue to be squeezed for Sherwin-Williams. For a quality business such as Sherwin-Williams sometimes that’s all you can ask and hope for. I’d still prefer to be a bit more cautious here as I already own a stake in Sherwin-Williams and would hope to increase my stake should we see <$225 and preferably closer to <$215 levels.
Be the first to comment