

Robert Way/iStock Editorial via Getty Images
Introduction
Shell plc (NYSE:SHEL) is Europe’s largest oil company.
The London-based Shell plc was the former Anglo-Dutch major. The company dropped its Dutch headquarters last year to become a fully British-based company. On February 2, 2023, SHEL reported its fourth-quarter and full-year 2022 results, concluding an exceptional year.
Note: I have followed SHEL quarterly since 2017. This new article is a quarterly update of my article published on October 30, 2022.
1 – 4Q22 and Full-year results snapshot
Shell plc reported fourth-quarter adjusted earnings per ADS of $2.76 or $9.814 billion, up 3.8% sequentially.
SHEL’s revenues were $101.20 billion, up 12.2% compared to the same quarter a year ago.
As pledged earlier, SHEL increased its dividend by 15%, to a quarterly dividend of $0.575 per ADS share.
SHEL announced that it repurchased $4.5 billion in shares in the fourth quarter. SHEL completed the $4 billion buyback program announced during the third quarter earnings release and expects another $4 billion worth of repurchases for the first quarter of 2023.
SHEL 2022 and 4Q22 Highlights (SHEL Presentation) SHEL Quarterly Liquid prices history (Fun Trading)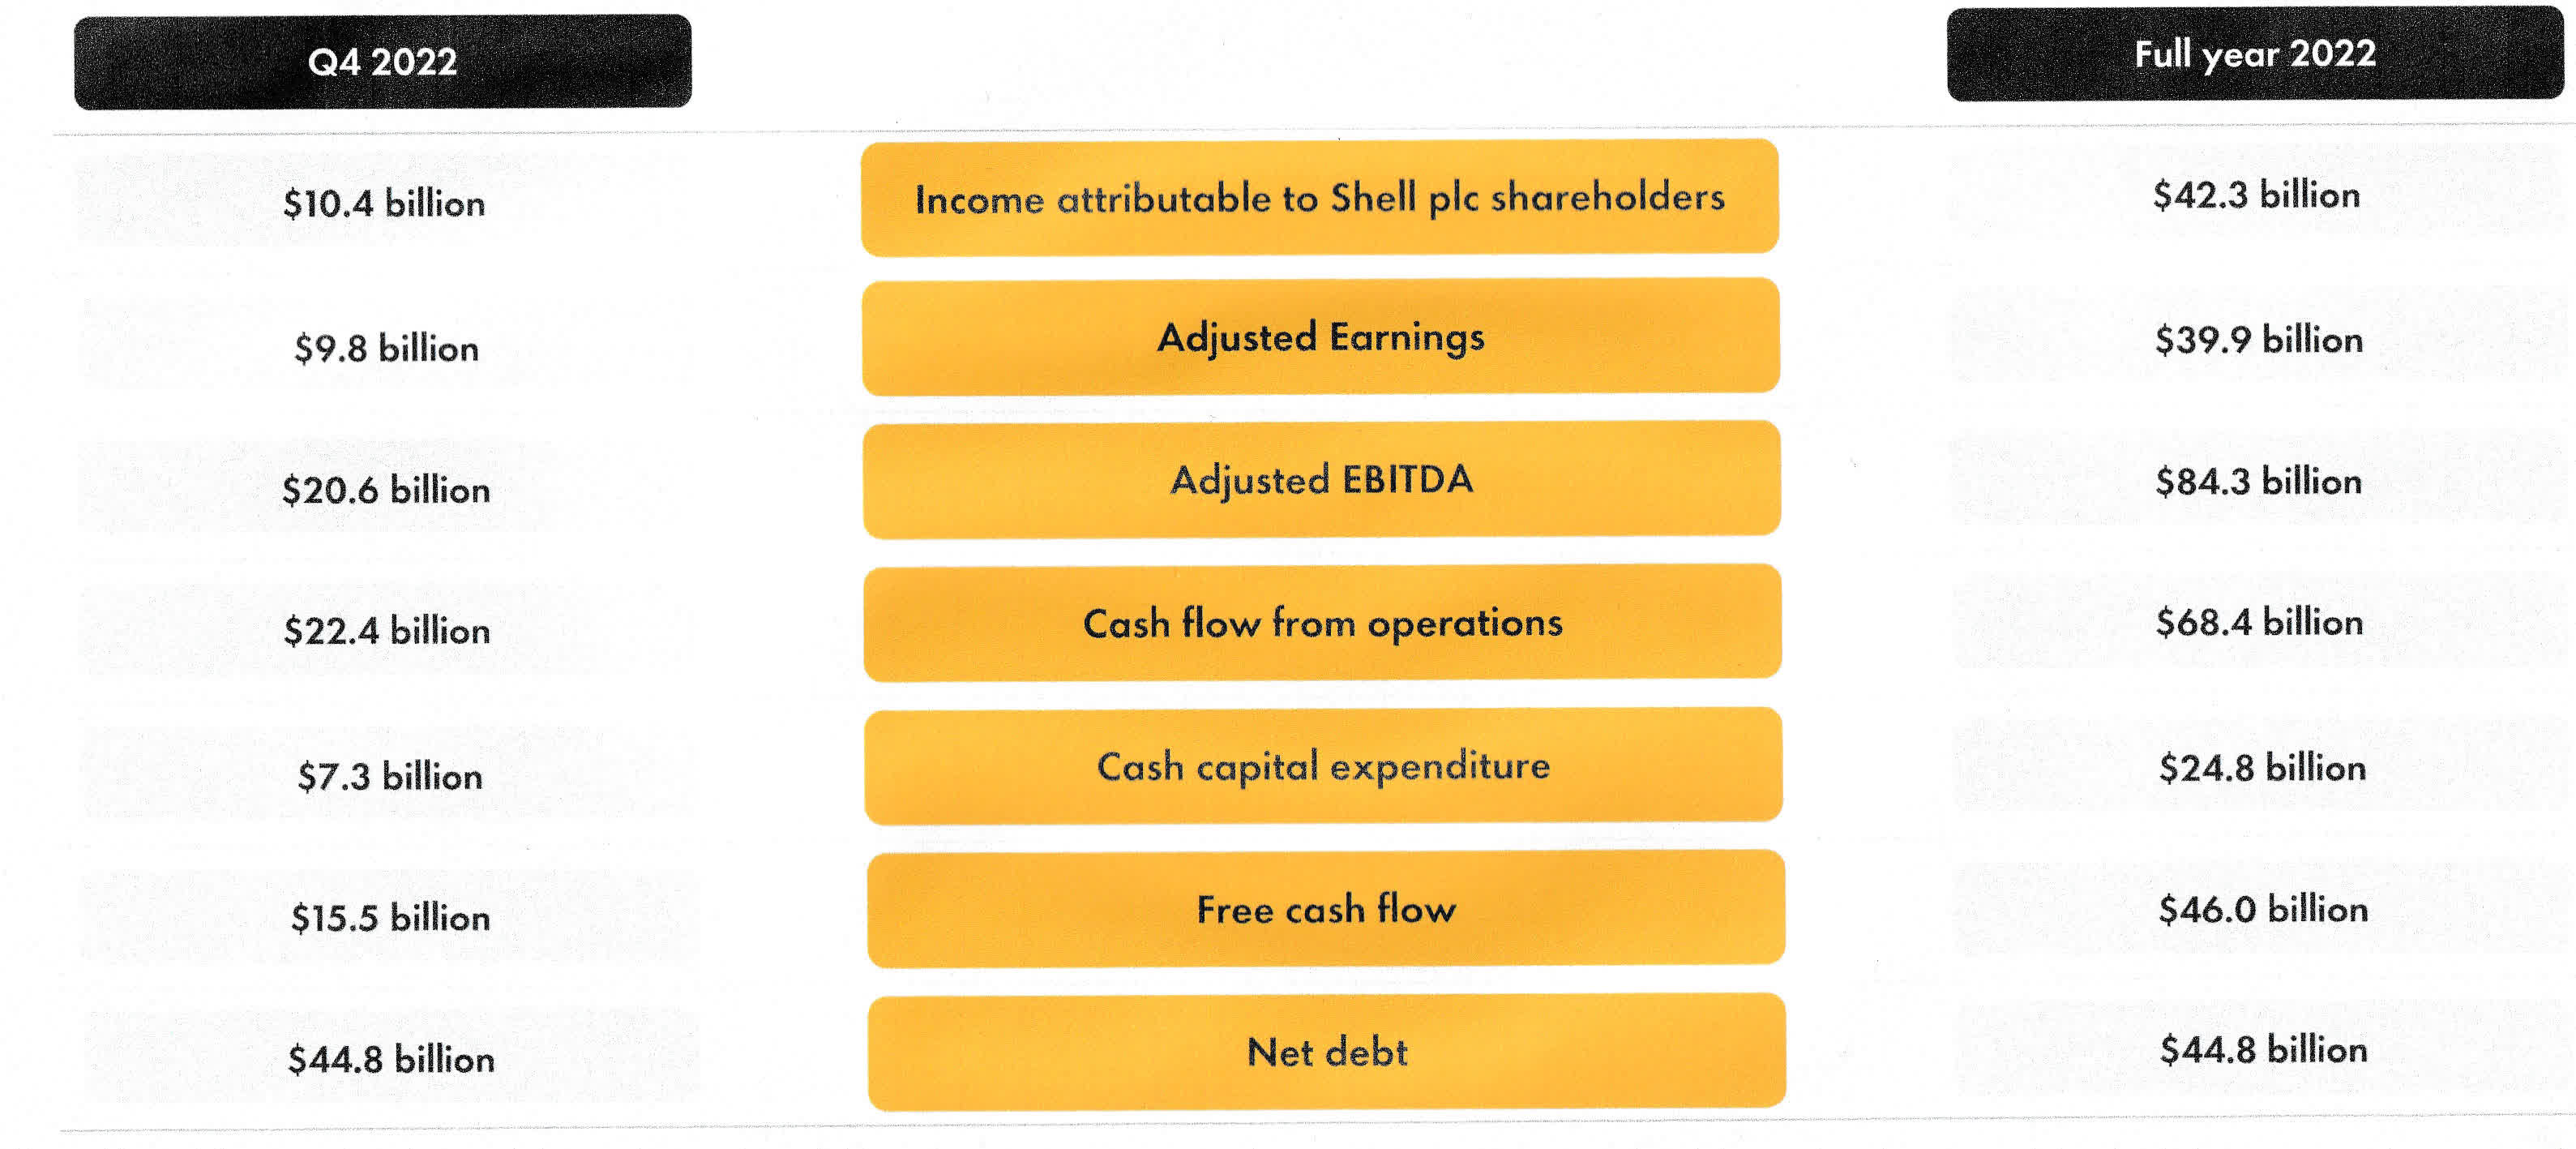

2 – Investment thesis
Shell plc, Exxon Mobil (XOM), Chevron Corp. (CVX), and TotalEnergies (TTE) are the four main supermajors that I have owned for decades.
As I have said for many years on Seeking Alpha, oil supermajors like Shell plc are the best long-term option to profit from the oil sector. They are solid companies and present excellent growth potential. With its European peers, SHEL is shifting to green energy, which will pay off down the road.
Furthermore, they have managed a steady cash flow generation that has supported great dividends. However, unlike XOM and CVX, SHEL cut its dividends deeply a few years back and lost its “dividend Aristocrat status.”
However, the oil and gas industry is anything but stable. It is regularly shaken by ups and downs due to demand and supply issues and geopolitical crises that have no end.
One last remark. Shell plc’s stellar fourth-quarter earnings are due mainly to its integrated Gas segment. Shell produces and trades liquefied natural gas, a critical fuel for Europe, as Russia shrank its exports. Thus, these exceptional results are not typical and should be taken with a grain of salt.
Oil and gas are slowly retracing from their record high of 2022, as we can see in the chart below:
SHEL Oil and Gas 1-Year (Fun Trading StockCharts)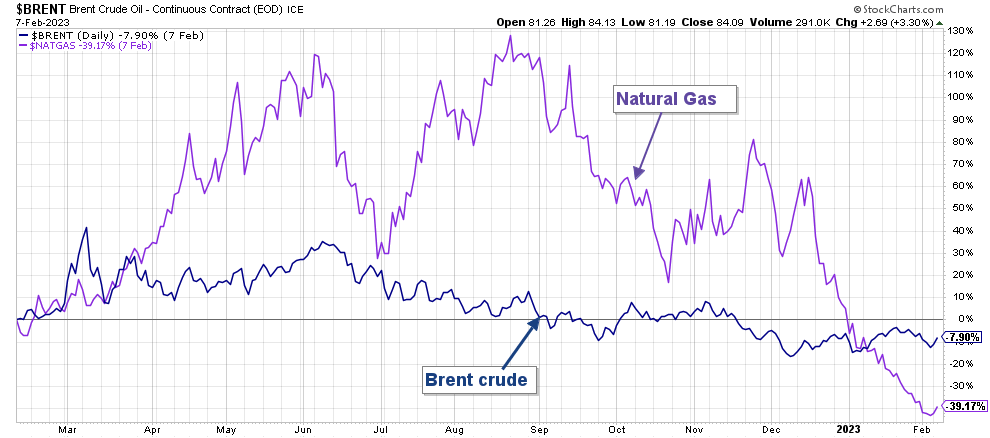
Even if the oil prices look solid now, we can’t assume that 2023 will be another good year for oil and gas. Natural gas has dropped precipitously since December and is now down 40% on a one-year basis.
So, it is crucial to take profits when SHEL is technically overbought, as I believe it is now again. I think the first quarter of 2023 will have a much weaker free cash flow.
Taking out some precious cash regularly will allow you to buy back on any significant retracement is the name of the game. Profiting from the volatility is the best way to benefit in this sector.
Thus, long-term investors should continue accumulating this cyclical stock on any significant retracement. So, I recommend short-term trading LIFO for about 35% of your SHEL position.
3 – Stock performance
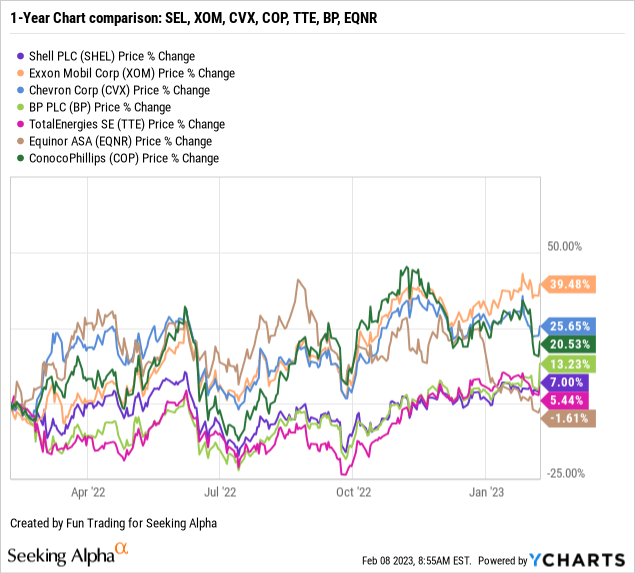
All three European oil majors, SHEL, BP, and TTE, have done quite poorly on a one-year basis compared to XOM, CVX, and COP, as shown below. EQNR is the exception, probably due to its gas production. Shell plc is up 12% on a one-year basis.
Shell plc – Financial History Table ending in 4Q22, The Raw Numbers (per ADS)
Important Note: Each American Depositary Share [ADS] represents two Shell plc ordinary shares.
| Royal Dutch Shell | 4Q21 | 1Q22 | 2Q22 | 3Q22 | 4Q22 |
| Total Revenues in $ Billion | 85.28 | 84.20 | 100.06 | 95.75 | 101.30 |
| Total Revenues and others in $ Billion | 90.22 | 83.16 | 103.08 | 98.76 | 101.20 |
| Net income in $ Billion |
11.46 |
7.12 |
18.04 |
6.74 |
10.41 |
| EBITDA $ Billion | 23.68 | 18.84 | 32.46 | 17.78 | 23.21 |
|
EPS diluted in $/share |
2.96 | 1.86 | 4.80 | 1.84 | 2.92 |
| Cash from operating activities in $ Billion | 8.17 | 14.82 | 18.66 | 12.54 | 22.40 |
| CapEx in $ Billion | 6.24 | 4.24 | 6.68 | 5.27 | 6.42 |
| Free Cash Flow in $ Billion | 1.93 | 10.58 | 11.98 | 7.27 | 15.99 |
| Total cash $ Billion | 36.97 | 38.36 | 38.97 | 35.98 | 40.25 |
| (non-current and current) Debt in $ Billion | 80.87 | 79.02 | 83.74 | 81.99 | 83.80 |
| Dividend per share [ADS] in $/share | 0.48 | 0.48 | 0.50 | 0.50 | 0.575 |
| Shares outstanding (diluted) in Billion [ADS=1/2] | 3.87 | 3.83 | 3.76 | 3.67 | 3.56 |
| Oil Production | 4Q21 | 1Q22 | 2Q22 | 3Q22 | 4Q22 |
| Oil Equivalent Production in K Boepd (including Integrated gas) | 3,088 | 2,921 | 2,861 | 2,713 | 2,776 |
| Integrated gas K Boepd | 927 | 896 | 944 | 924 | 916 |
| Global liquid price ($/b) | 77.75 | 88.63 | 101.42 | 93.02 | 82.42 |
Sources: SHEL filing
Analysis: Revenues, Earnings Details, Total Debt, Free Cash Flow, And Oil & Gas Production Upstream
1 – Revenues and other income were $101.20 billion in 4Q22
SHEL Quarterly Revenues history (Fun Trading)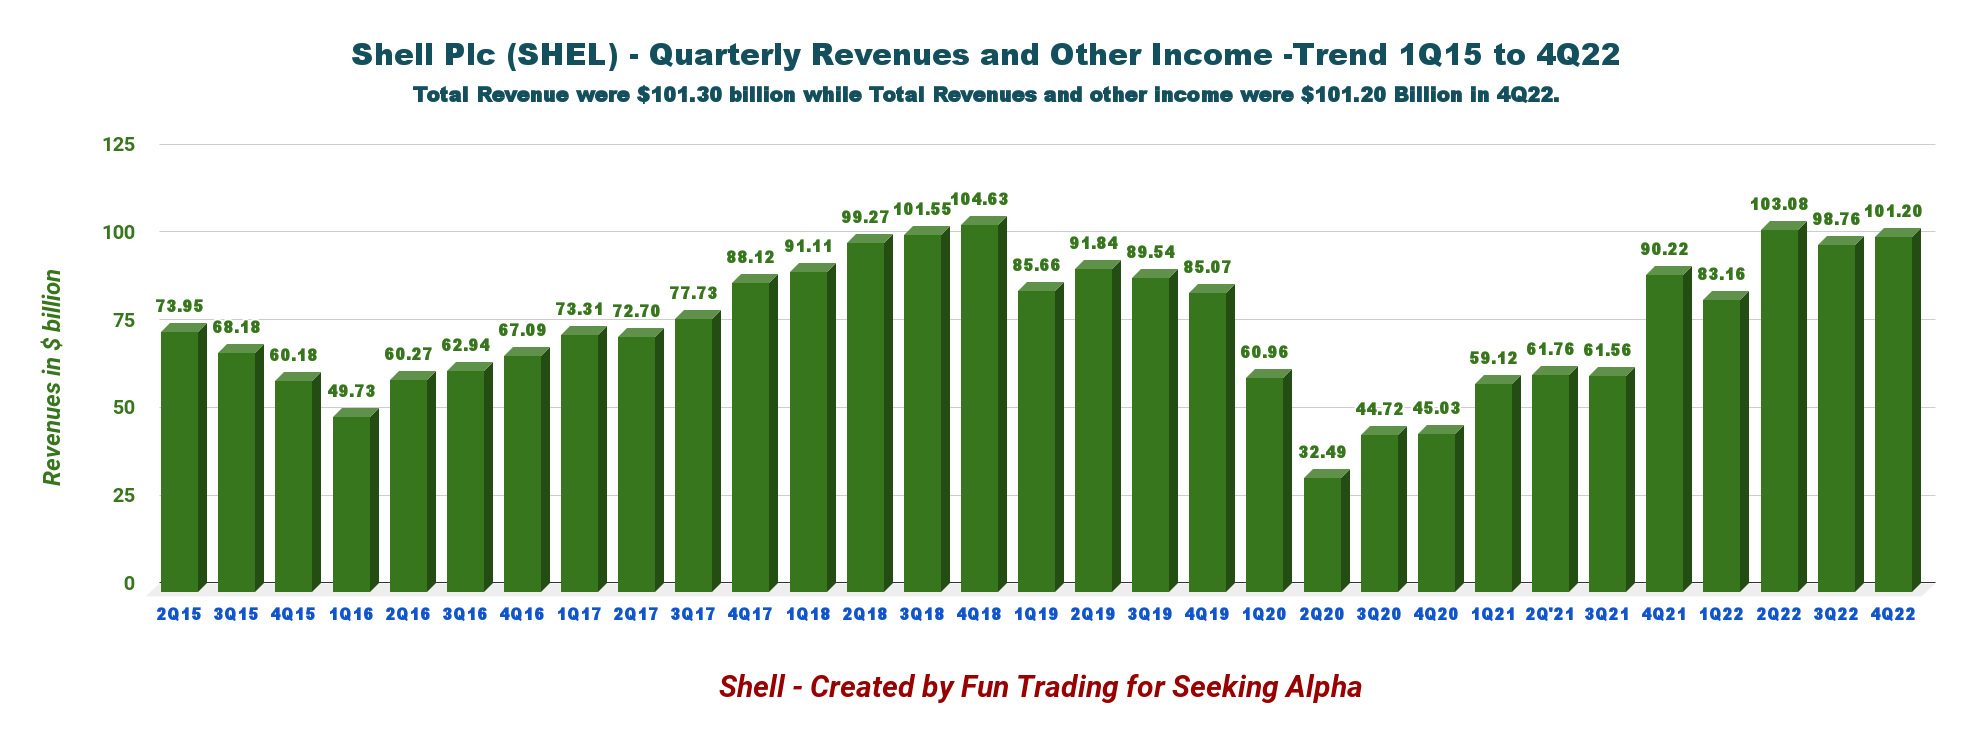
The adjusted earnings surged to $9,814 million this quarter compared to $9,454 million in 3Q22.
During the fourth quarter, Shell generated cash flow from operations of $22.404 billion, up significantly from $8.169 billion a year ago.
CFFO of $22.4 billion for Q4 2022 benefited from a working capital inflow of $10.4 billion. The working capital inflow reflects the impact of lower oil and gas prices, active management of initial margin positions, decrease in accounts receivable and cash relating to joint ventures. (press release)
2 – Generic Free cash flow was a record of $15.99 billion in 4Q22
Note: I use cash from operating activities minus CapEx to calculate the generic free cash flow. It differs from the free cash flow indicated by Shell, which was $15.5 billion in 4Q22.
Trailing 12-month free cash flow is now $45.813 billion, with a 4Q22 free cash flow of $15.99 billion.
SHEL Quarterly Free Cash flow history (Fun Trading)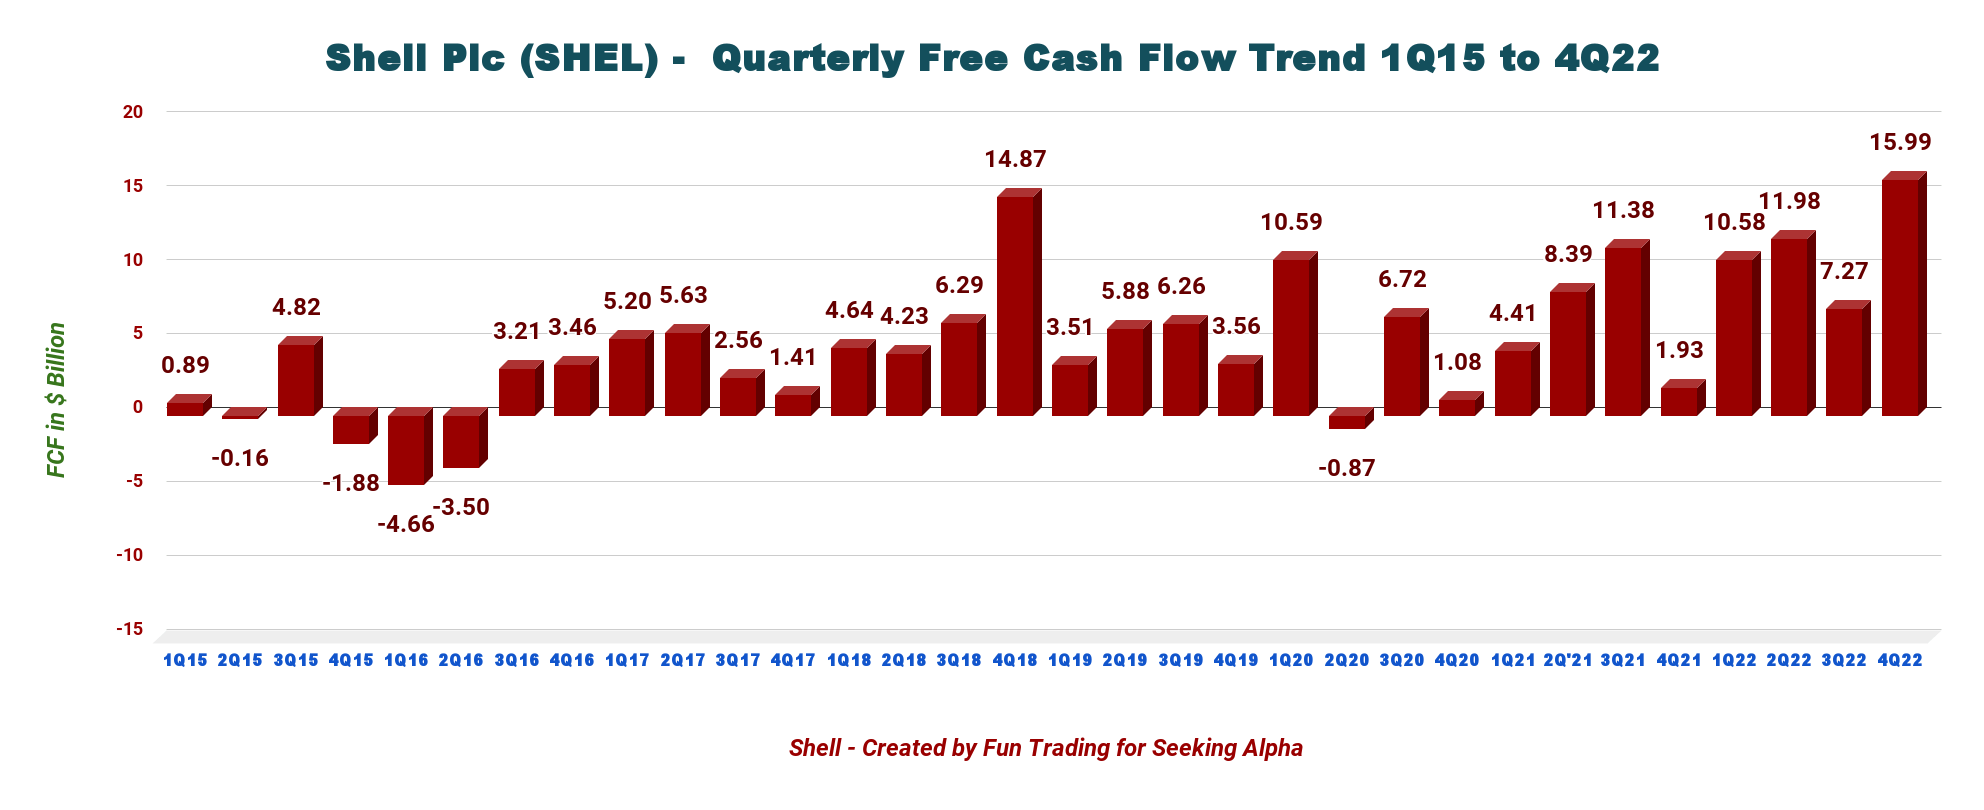
3 – Oil-equivalent production and other
SHEL Quarterly oil equivalent production history (Fun Trading)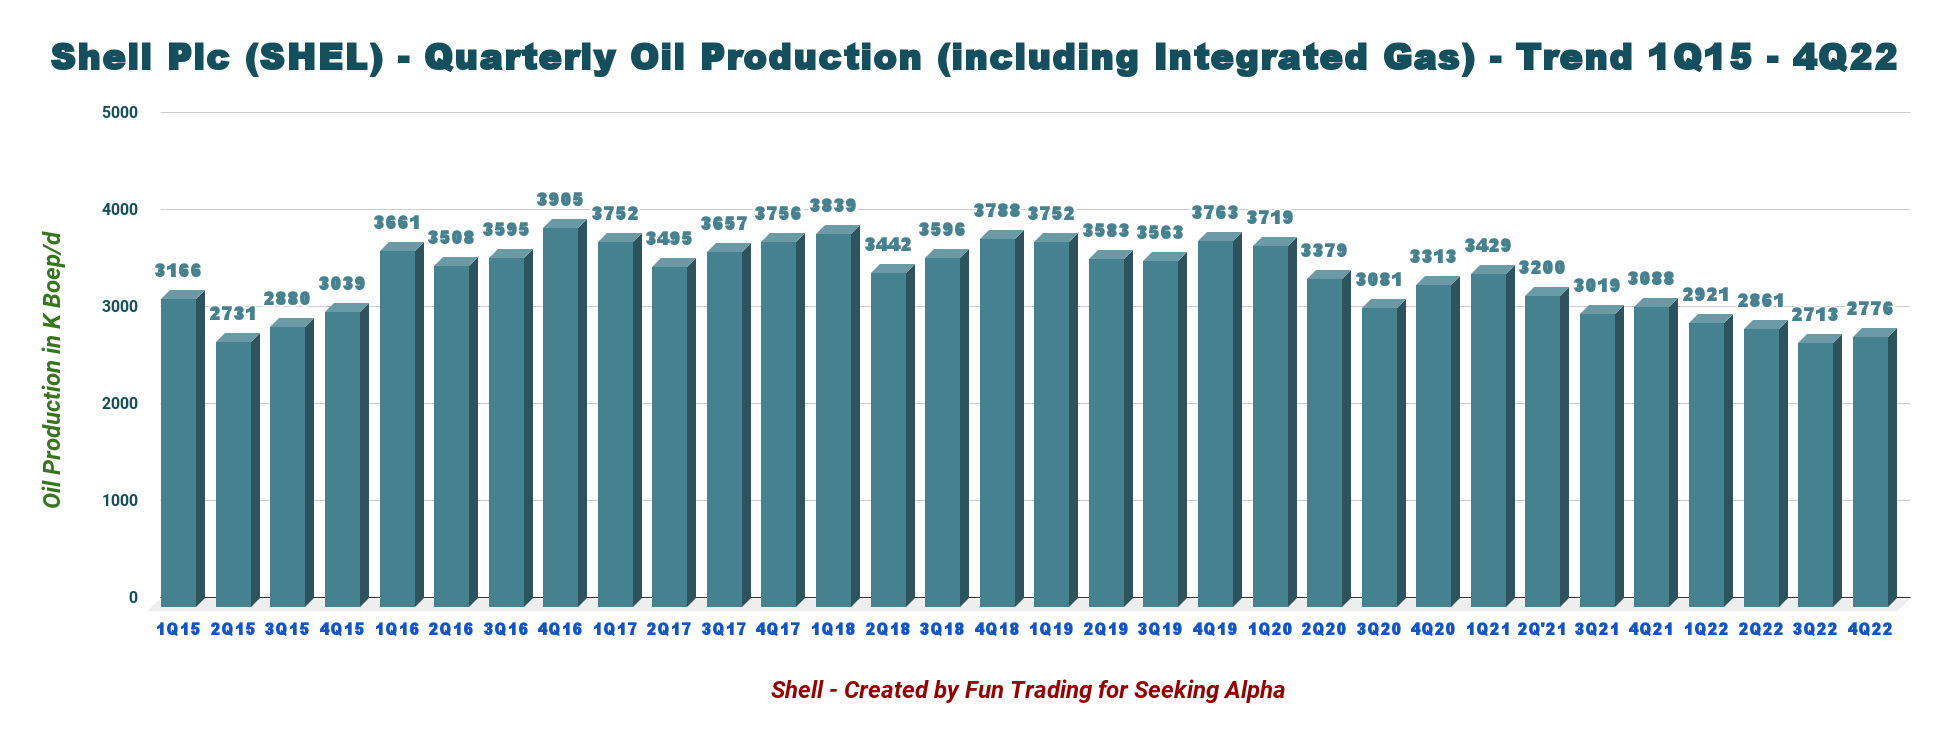
This amount doesn’t include the LNG sales volumes, which were 16.82 Million Tonnes in 4Q22, up from 15.66 million Tonnes in 3Q22.
The company operates five different segments:
3.1 – Upstream: The income was $3.1 billion (excluding items) compared to an income of $2.8 billion last year. The increase reflects the impact of higher oil and gas prices, partly offset by lower volumes.
Shell’s upstream volumes averaged 1,859K Boepd, down 11.9% from the year-ago period, mainly due to the loss of contribution due to the company’s asset sales and maintenance downtime. The Liquids production totaled 1,331K Boepd, down 8.6% from last year. Natural gas production was 3,067 million standard cubic feet per day, down 19.3% from last year.
3.2 – Chemicals and Products: The income was $744 million, much higher than last year’s $130 million loss. The significant increase was due to strong refining margins and deferred tax movements.
3.3 – Integrated Gas: The adjusted income was $6 billion, up from $4 billion in 4Q21. The increase was due to higher LNG sales volumes. Total Integrated Gas production fell 6.2% yearly to 917K Boepd.
3.4 – Marketing: The segment registered an income of $446 million (excluding items) in 4Q22 compared to the year-ago earnings of $611 million due to lower margins.
3.5 – Renewables and Energy Solutions: The adjusted income of $293 million increased significantly from the year-ago profit of $43 million. The increase was due to higher trading and optimization margins for gas and power in Europe. Additionally, external power sales increased 11.9% yearly to 66 terawatt hours, whereas piped gas sales fell 3.2% to 241 terawatt hours.
4 – Cash vs. debt. Net debt is now $44.84 billion (Gearing 18.9%)
The net debt decreased to $44.84 billion on December 31, 2022, compared with $48.34 billion in 3Q22.
Gearing is down to 18.9%, down from 23.1% (Gearing is a measure of Shell’s capital structure and is defined as net debt as a percentage of total capital).
SHEL Quarterly Cash versus Debt history (Fun Trading)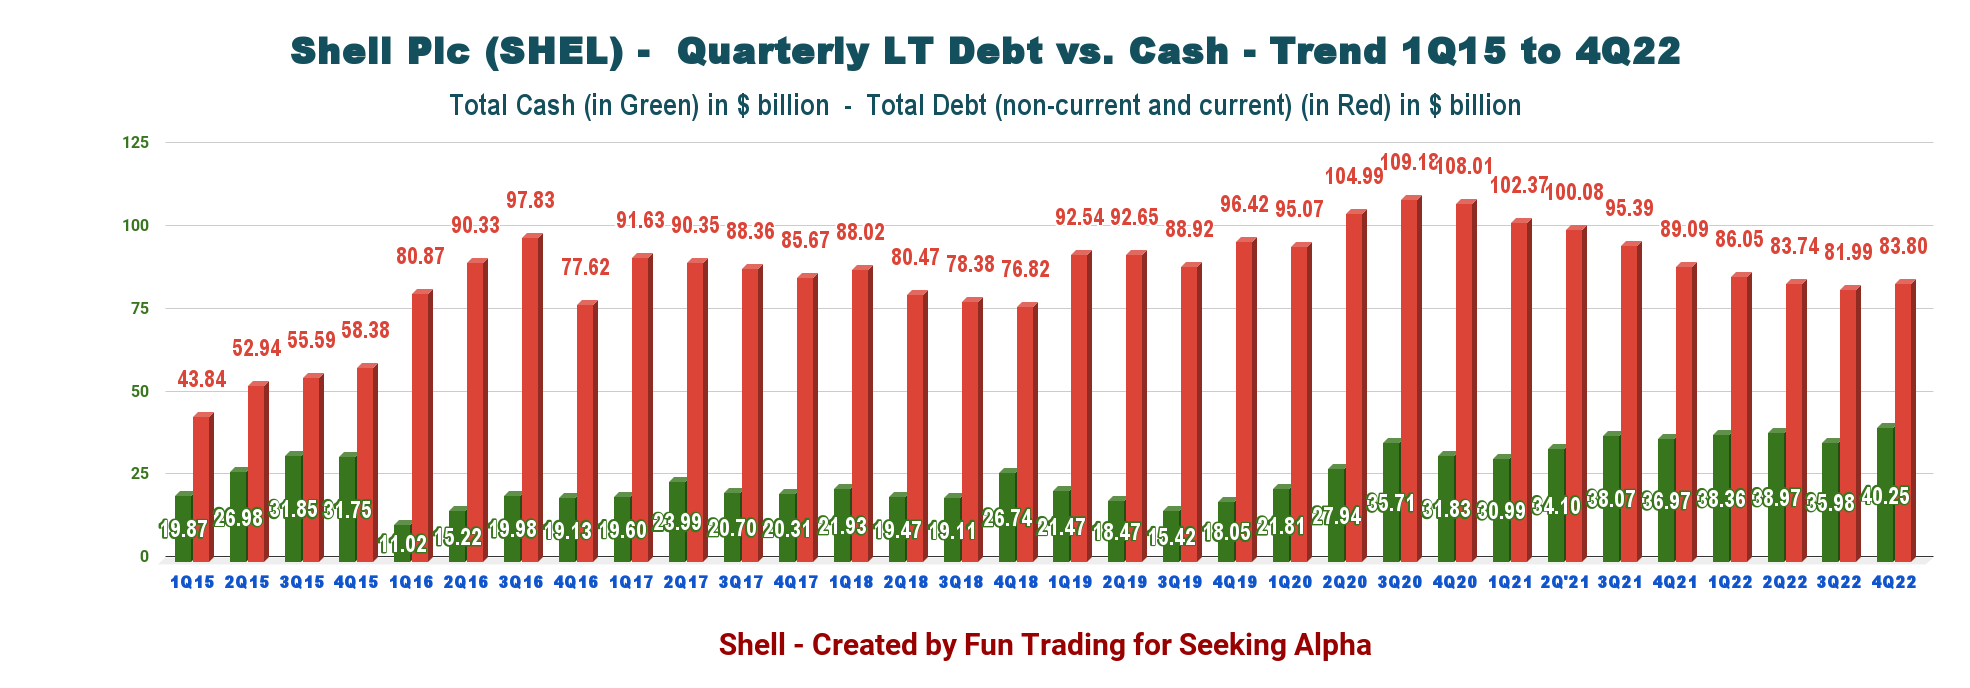
Unfortunately, Shell is not prioritizing debt as it should, albeit the net debt is dropping fast.
The company has allocated more cash for buybacks, and I believe it is not the best solution. In fact, I think it is a total waste of money.
Shell should focus on cutting debt faster and eventually achieve a gearing below 10%. Another alternative could be to use the extra cash to invest in new energy sources to replace oil in 2030 partially.
5 – 1Q23 Guidance
Shell anticipates 1Q23 upstream volumes of 1,750 -1,950K Boepd, while Integrated Gas production is expected between 910K and 970K Boepd. Total production using the mid-point will be slightly above 4Q22.
The company expects marketing sales volumes of 2,150 -2,650K b/d and refinery utilization of 87%-95%.
Technical analysis and commentary
SHEL TA Chart Short-term (Fun Trading StockCharts)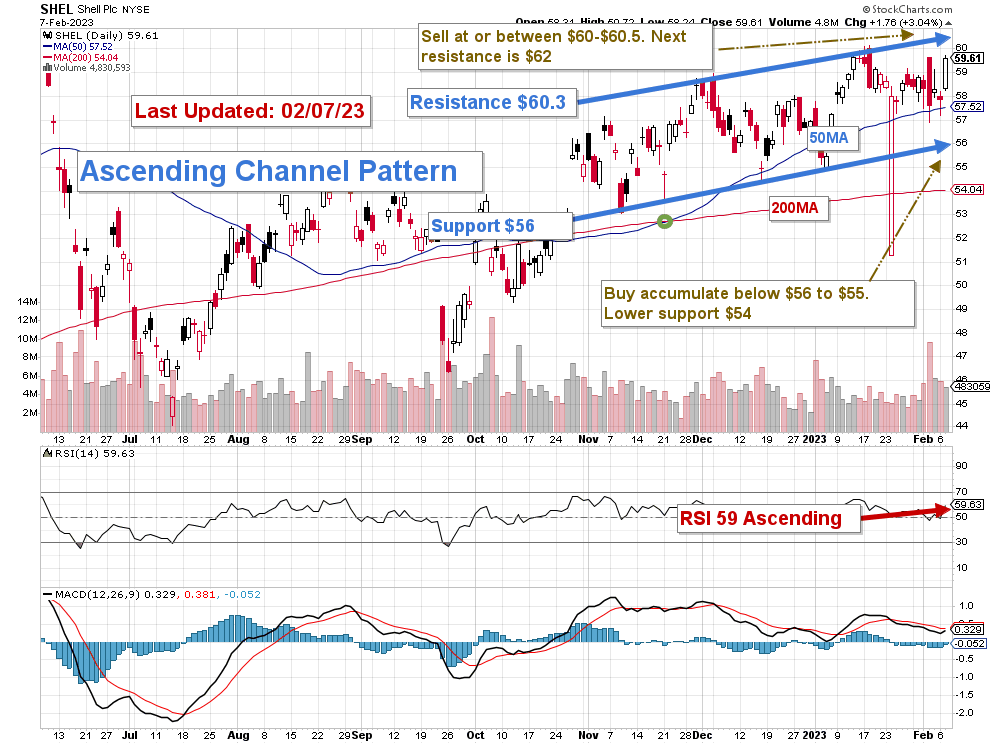
Note: The chart is adjusted for the dividend.
SHEL forms an ascending channel pattern with resistance at $57.5 and support at $50.5.
Ascending channel patterns or rising channels are short-term bullish in that a stock moves higher within an ascending channel, but these patterns often form within longer-term downtrends as continuation patterns. The ascending channel pattern is often followed by lower prices, but only after a downside penetration of the lower trend line. The stock will continue channeling upward until it is able to break either the upper or lower trend line.
Note: However, the chart pattern is shifting slightly and could be an ascending triangle with resistance at about $59.80. We need a few days to confirm it.
The short-term trading strategy is to trade LIFO about 30%-35% of your position. I suggest selling between $60 and $60.5 with possible higher resistance at $62 and waiting for a retracement between $55 and $56 to consider buying with potential lower support at $54.
The oil and gas market has corrected from its peak in June last year, and we have entered a new phase of uncertainty in 2023. Thus, I strongly recommend trading LIFO more regularly to take advantage of the wild swings that will shake the oil world this year.
Warning: The TA chart must be updated frequently to be relevant. It is what I am doing in my stock tracker. The chart above has a possible validity of about a week. Remember, the TA chart is a tool only to help you adopt the right strategy. It is not a way to foresee the future. No one and nothing can.
Editor’s Note: This article discusses one or more securities that do not trade on a major U.S. exchange. Please be aware of the risks associated with these stocks.
Be the first to comment