

Abu Hanifah/iStock via Getty Images
Investment Thesis
The SoFi Select 500 ETF (NYSEARCA:SFY) is a zero-fee ETF with over $322 million in assets under management, primarily attractive to younger investors with a long investment time horizon and a slight growth bias. YTD, it’s underperformed the SPDR S&P 500 ETF (SPY) by 4%, and this will be my third time reviewing this fund. Initially, I gave SFY a not-so-favorable review, but the second time around, I acknowledged it for what it is: a zero-cost growth-light ETF most appropriate for those believing growth stocks will outperform value from now on.
This article provides some research suggesting that there likely is a small opportunity in the short term given the market’s recent declines. The fundamentals I will highlight indicate SFY has a slight advantage over SPY in the form of superior revenue and earnings growth and a lower forward price-earnings-growth ratio. These may not be good enough reasons to hold SFY over the long run, but they’re certainly good enough to keep you from selling. Therefore, my rating on SFY remains a hold, and I look forward to taking you through the latest numbers.
ETF Overview
Strategy, Sector Allocations, and Top Ten Holdings
SFY’s selection process begins with 3,000 of the largest U.S. equities by market capitalization, with the 500 largest selected, subject to a 20% buffer rule. The buffer rule means as long as current constituents stay within the top 600, they take priority over new entrants. Effectively, this reduces portfolio turnover and increases trading efficiency, given how stocks this far down the list likely have negligible weights anyways.
Composite scores are calculated based on trailing one-year revenue growth, trailing one-year earnings per share growth, and forward one-year earnings per share estimates. However, the Index is factor-influenced rather than factor-weighted. Market capitalization is still the primary determinant of a securities’ weighting, which is why its top ten list is similar to SPY.
SoFi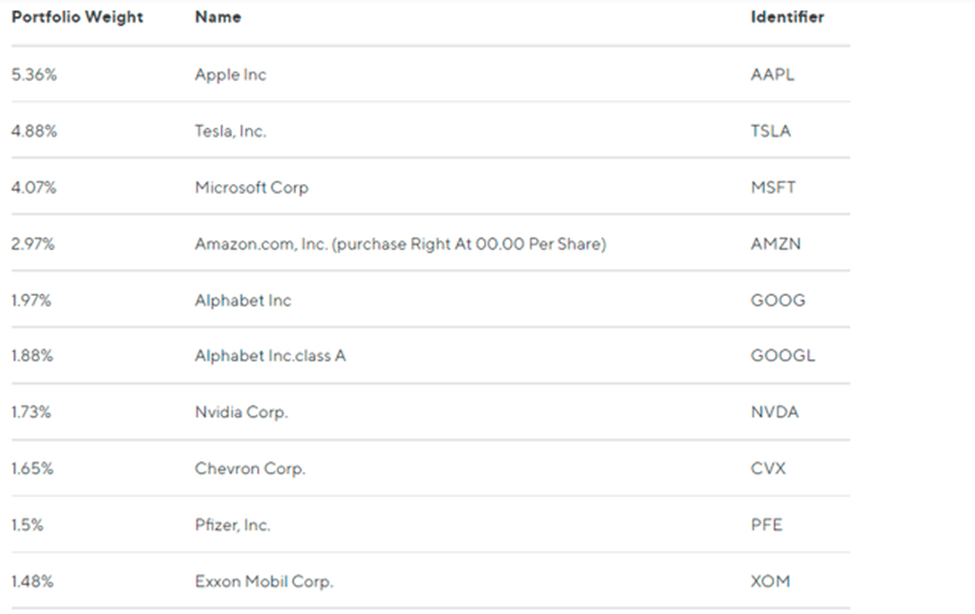
Apple (AAPL) is the top holding, followed by Tesla (TSLA), Microsoft (MSFT), and Amazon (AMZN). The two share classes for Alphabet (GOOG) (GOOGL) combine for a 3.85% weighting, making it the fourth-largest holding. Chevron (CVX), Pfizer (PFE), and Exxon Mobil (XOM) are the 19th, 17th, and 12th largest holdings in SPY. I’ll highlight how this re-weighting impacts the ETF as a whole shortly.
The sector exposures table helps explain why I consider SFY a growth-light fund. However, after the most recent semi-annual reconstitution in May, it looks closer to a blended ETF like SPY than a standard growth-focused fund like the SPDR S&P 500 Growth ETF (SPYG). While SFY’s Consumer Discretionary exposure is nearly the same as SPYG, its Technology exposure is actually less than SPY at the moment (25.53% vs. 27.18%).
Morningstar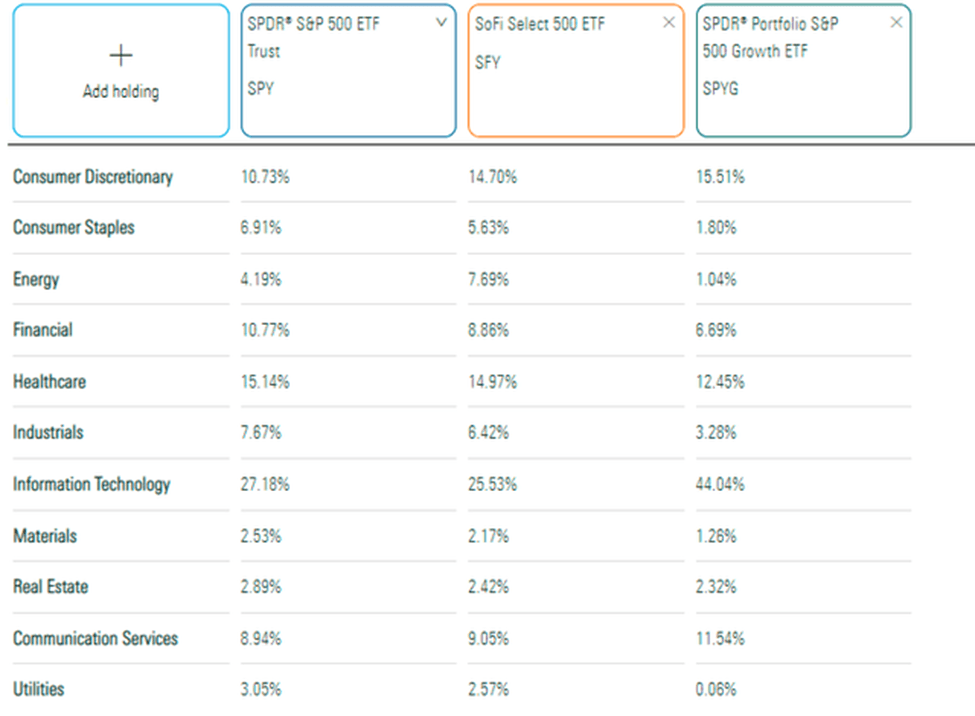
Performance
Since April 2019, SFY has gained an annualized 9.68% compared to 10.10% for SPY and 11.46% for SPYG. Indeed, markets favored growth for the most part, so I view this as a slight underperformance. However, as expected, SFY’s annualized standard deviation, worst year, and maximum drawdown figures are between SPY and SPYG. YTD, SFY is outperforming SPYG by 3% but underperforming SPY by 4%. This is the dynamic I expect to see going forward.
Portfolio Visualizer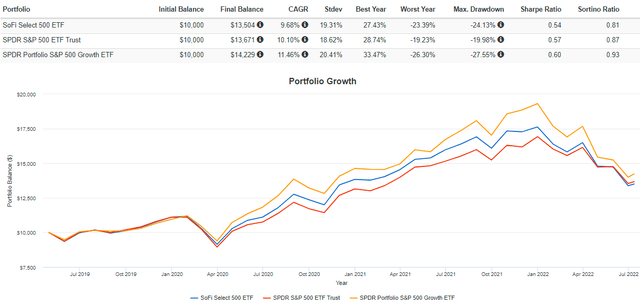
Fundamental Analysis
Industry Snapshot
Fundamentals for SFY’s top 20 industries are below. They include summary metrics on volatility, growth, valuation, and profitability. Have a quick look at what the portfolio looks like today relative to SPY and SPYG, and I’ll offer my thoughts afterward.
The Sunday Investor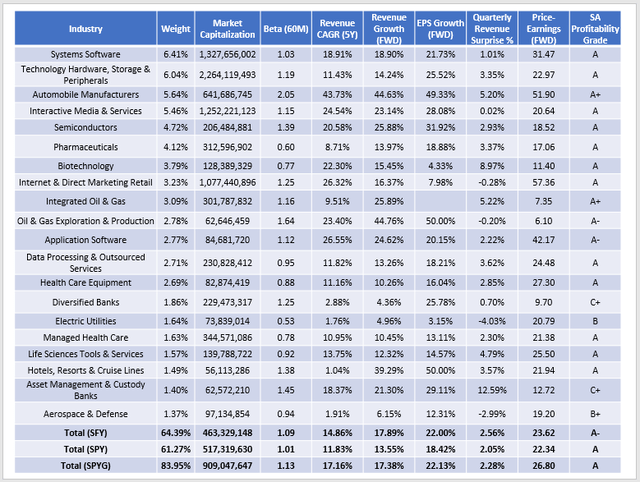
1. SFY is slightly less diversified than SPY at the industry level, which may surprise readers since it’s at least partially factor-weighted. The percentage of assets in the top 10 holdings is also slightly more (29.03% vs. 28.58%), so I don’t think SFY is any better diversified than the more straightforward S&P 500 Index.
2. SFY’s five-year beta is 1.09 compared to 1.01 for SPY and 1.13, putting it closer to the growth end since growth stocks are usually more volatile. Still, it’s one of the least-volatile growth ETFs available, with the Invesco S&P 500 GARP ETF (SPGP) being the exception. For perspective, the Invesco QQQ ETF (QQQ) and the iShares Russell Top 200 Growth ETF (IWY) both have 1.19 five-year betas. All things considered, SFY is a relatively conservative growth ETF.
3. SFY has impressive estimated revenue and earnings per share growth rates of 17.89% and 22.00%. These rates are roughly 4% better than SPY, yet SFY trades at nearly the same forward earnings valuation (23.62x vs. 22.34x). SFY’s growth is also on par with SPYG’s, yet it trades about three points cheaper on forward earnings. I will go into more detail on this soon because I think it’s a potential source of outperformance, at least in the near term.
4. The re-weighting resulted in a slightly lower-quality portfolio than SPY, as measured by Seeking Alpha’s Profitability Grade (A- vs. A). The reason looks to be more exposure to custody and regional banks and the addition of smaller Systems Software stocks like Block (SQ) and Palo Alto Networks (PANW). However, these are so small that I can’t imagine it making much difference.
The 20 Most Overweighted Stocks
Consider these growth and valuation metrics for the following 20 constituents, which are the ones SFY overweights the most relative to SPY.
The Sunday Investor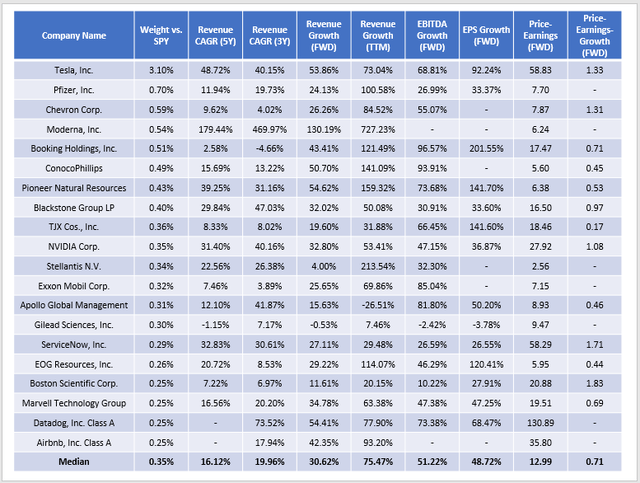
Tesla is the most overweighted stock by 3.10%, and the rest have relatively minor weight differences compared to SPY. These results reflect the screens which emphasize sales and earnings growth. For these 20 stocks, the median estimated sales and earnings growth rates are 30.62% and 75.47%. These are far more than what SPY and SPYG offer, but what’s most intriguing is that their valuations are reasonable. Tesla’s forward price-earnings ratio has dropped substantially to 58.83, and the median for these stocks is only 12.99. Higher weightings given to Energy stocks like Chevron and Exxon Mobil and defensive Health Care stocks like Pfizer (PFE) boost the fund’s quality.
The median forward price-earnings-growth for these stocks is only 0.71, and although not shown, the weighted-average ratio for the entire ETF is 2.15. That’s less than the 2.25 SPGP offers, and that ETF is explicitly designed for the growth-at-a-reasonable price investor. I think SFY has stumbled upon these superior fundamentals since there’s nothing in the methodology to account for valuation. However, current shareholders should take the win, which is why I don’t recommend selling into recent weakness.
Investment Recommendation
I remain neutral on SFY since I view it as a growth-light ETF that doesn’t meaningful diverge from a standard S&P 500 Index fund. I wish there were some controls for valuation in place, and a modification to the screens to evaluate stocks beyond one-year trailing and forward growth would be welcome. Still, it’s a zero-fee ETF that should perform in the middle of SPY and SPYG, depending on whether growth is in favor.
Even though I don’t view SFY as a better fund than SPY in the long run, I think the portfolio is relatively strong at the moment. The most overweighted stocks have attractive fundamentals, and the ETF is now even priced more attractively than SPGP from a growth-at-a-reasonable-price perspective. If you own SFY already, I wouldn’t sell, and if you’re thinking of buying it soon, understand that it’s for a broad-market index investor with a slight growth bias. I hope this information helps, and I look forward to answering any questions in the comments section below.
Be the first to comment