

dszc/E+ via Getty Images
A guest post by Ovi
Below are a number of oil, crude plus condensate (C + C), production charts for Non-OPEC countries created from data provided by the EIA’s International Energy Statistics and updated to September 2021. Information from other sources such as OPEC, the STEO, and country-specific sites such as Russia, Brazil, Norway, and China is used to provide a short-term outlook for future output and direction for a few countries and the world.

September Non-OPEC production declined by 44 kb/d to 48,482 kb/d. The biggest changes in production occurred in the U.S., -381 kb/d and Russia, +290 kb/d.
Using data from the January 2022 STEO, a projection for Non-OPEC oil output was made for the time period October 2021 to December 2023 (Red graph). Output is expected to reach 52,208 kb/d in December 2023, which is 291 kb/d lower than the December 2019 pre-COVID peak of 52,499 kb/d.
Output in October is expected to rebound to 49,347 kb/d, an increase of 865 kb/d. The majority of the 865 kb/d increase will come from the recovery of U.S. production in October, 651 kb/d, and close to 250 kb/d from OPEC.
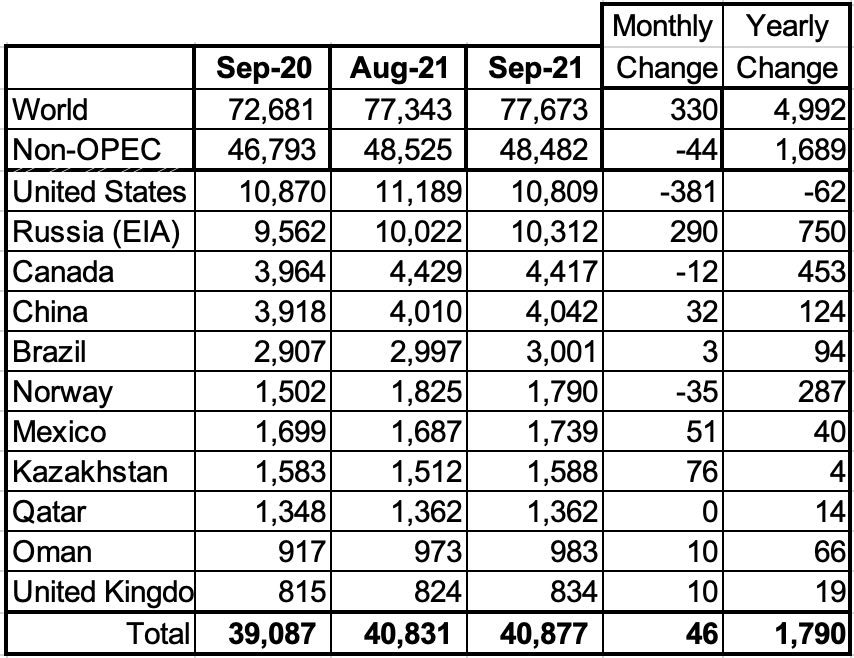
Above are listed the world’s 11th largest Non-OPEC producers. The original criteria for inclusion in the table was that all of the countries produced more than 1,000 kb/d. The last two have currently fallen below 1,000 kb/d.
In September, these 11 countries produced 84.3% of the Non-OPEC output. On a YoY basis, Non-OPEC production increased by 1,689 kb/d while on a MoM basis, production decreased by 44 kb/d to 48,482 kb/d. World YoY September output was up by 4,992 kb/d.
Production by Country
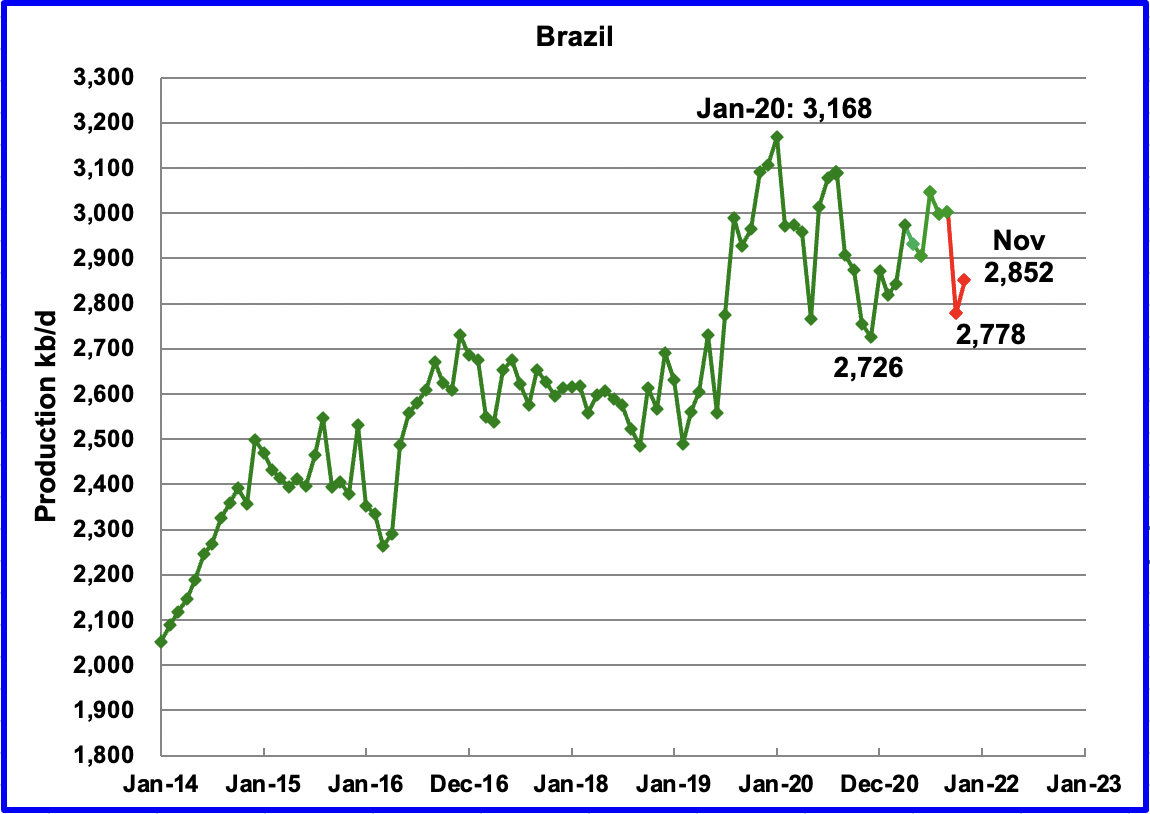
The EIA reported Brazil’s September production increased by 3 kb/d to 3,001 kb/d. According to this source, October output dropped by 223 kb/d to 2,778 kb/d in October and then rebounded to 2,852 kb/d in November. (Red Markers).
With regard to Brazil, the December OPEC report stated: “COVID-19-related health and safety measures at production platforms, delays in project start-ups and heavy natural declines at offshore mature fields, particularly in the Campos Basin, have also contributed to underperformance in production.”
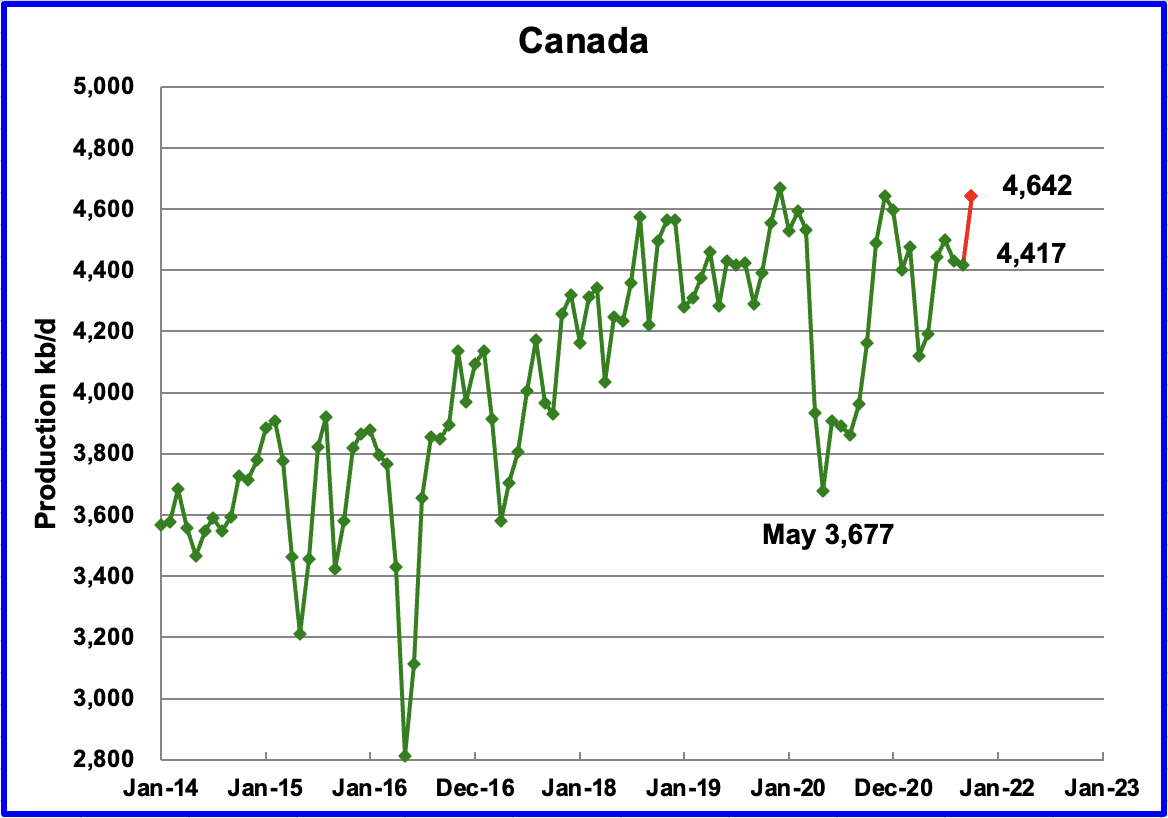
According to the EIA, September’s output decreased by 12 kb/d to 4,417 kb/d.
Canada’s Energy Regulator (CER) has partially updated Canada’s oil production estimates up to October. The main change for October was an increase of almost 225 kb/d in upgraded bitumen. The increase in bitumen production, 225 kb/d, has been added to the EIA’s September output to provide an estimate for October, 4,642 kb/d.
On October 1, the updated Enbridge Line 3 pipeline began operating to deliver crude to Superior Wisconsin. The new line delivers more crude and is safer since it replaces a 50-year-old pipeline.
With the addition of Line 3, Canada has gone from famine to feast with regard to pipeline capacity. In addition to Line 3 starting up, Marathon reversed the direction of its Capline pipeline from flowing South to North to North to South.
According to this source: “In just a few months, heavy crude from Western Canada will start flowing south on the Capline pipeline from the Patoka, IL, hub to the one at St. James, LA. While the initial volumes will be modest, Capline’s long-awaited reversal will provide Louisiana refineries and export terminals with easier, lower-cost access to oil sands and other Alberta production. Flipping the pipeline’s direction of flow also means more changes for the St. James storage and distribution hub – one of the U.S.’s largest – which has already seen more than its share of evolution during the Shale Era.”
According to this source, Capline began operating on Dec 18 with initial capacity of 200 kb/d. The additional capacity along with supplying Louisiana refineries has reduced the WCS to WTI discount according to this source. Essentially this means that as of January 1, 2022, Canadian heavy oil flowing to the U.S. is not pipeline constrained anymore.
An unanticipated benefit of Capline and Line 3 becoming operational at roughly the same time is that Canadian oil producer can now ship more oil to the Gulf Coast and then on to Asia according to this source.
“The recent reversal of Marathon Pipe Line Inc.’s Capline pipeline is sending oil sands crude produced in landlocked Alberta to export terminals on Gulf Coast where it can be shipped to other countries. Exports to Asia were at their highest ever, with India the leading destination by far, followed by China and then South Korea, according to oil analytics firm Kpler.”
“Shipments of heavy crude jumped to more than 266,000 barrels a day in December after averaging over 180,000 through the year, according to Kpler. Canadian crude exports from the U.S. Gulf Coast averaged just 25,000 barrels a day in 2018, before rising to average around 70,000 in both 2019 and 2020.”
In October, Canada shipped 132.6 kb/d by rail to the U.S., which was 32 kb/d lower than in September. Will this downward trend continue now that there is more pipeline capacity?
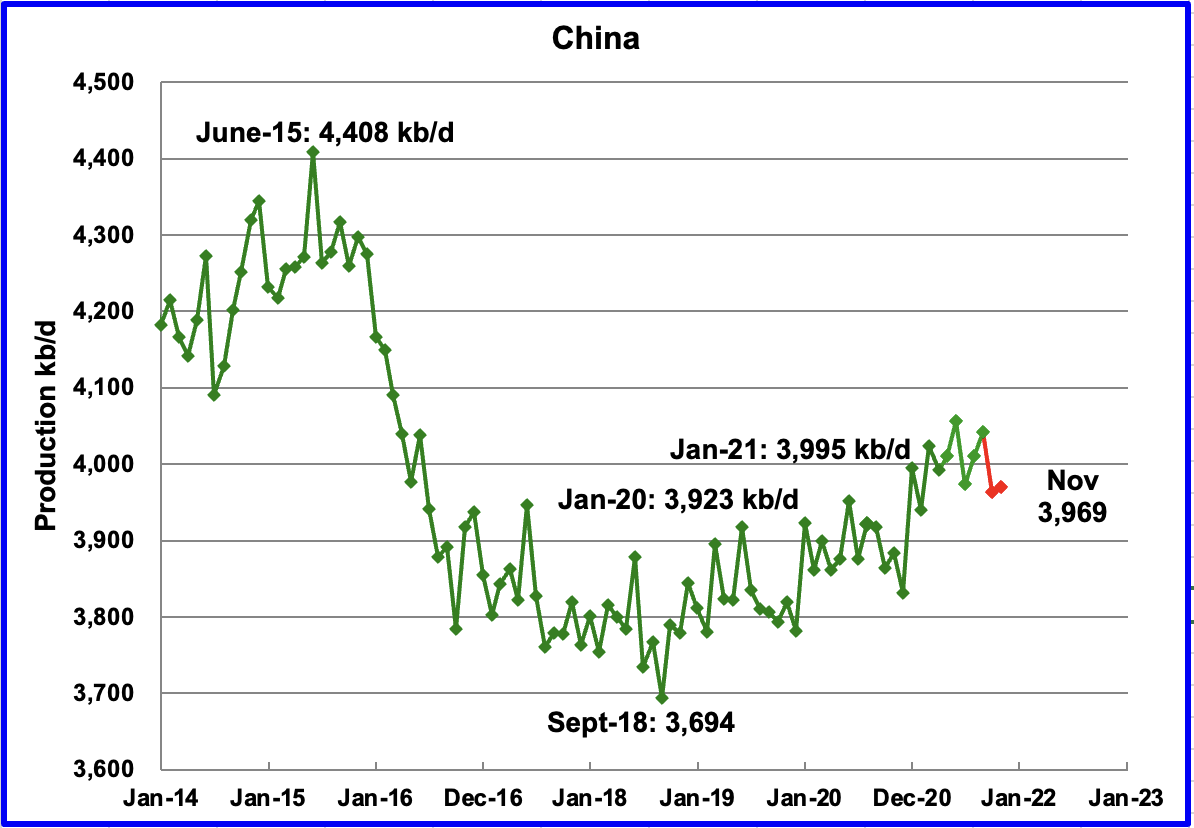
The EIA reported China’s September output increased by 32 kb/d from August to 4,042 kb/d. However, in October, output dropped by 79 kb/d to 3,963 kb/d and then increased slightly by 5 kb/d in November to 3,969 kb/d according to this source. (Red markers).
From January 2020 to January 2021, China’s daily output increased by 72 kb/d to 3,995 kb/d. For 2021, no growth is apparent up to November 2021. Note also that November 2021 production is only 46 kb/d higher than January 2020.
According to this source, China’s CNOOC raised 2022 production target, expects domestic crude output to hit peak by 2030. Its Bohai oil cluster off north China has overtaken Daqing to become the country’s biggest crude oil production base, with 2021 output hitting 30.132 million tonnes.
For 2022, the company plans to drill 227 offshore exploration wells and 132 onshore unconventional exploration wells.
It also expects to launch 13 new projects, including the Bozhong, Kenli, and Enping oil fields in China, Liza Phase II in Guyana, and 3M in Indonesia.
December 2021 was the first month since March that China imported more oil than last year according to this source. I wonder if this report caused the price of WTI to hit a new inter-day high yesterday.
“December oil arrivals reached 46.14 million tonnes, up nearly 20 percent in the first monthly year-on-year growth since April, as independent refiners rushed to utilise 2021 quotas, customs data showed. The December influx, equivalent to about 10.87 million barrels per day, was the highest daily amount since March.
In a backwardated market, prompt delivery prices are higher than those in future months, discouraging companies from storing oil.
Liu Yuntao, an analyst with Energy Aspects, estimated 70 to 90 million barrels of crude oil were drawn down from storage throughout last year, including a rare public auction of strategic petroleum reserves in September.”
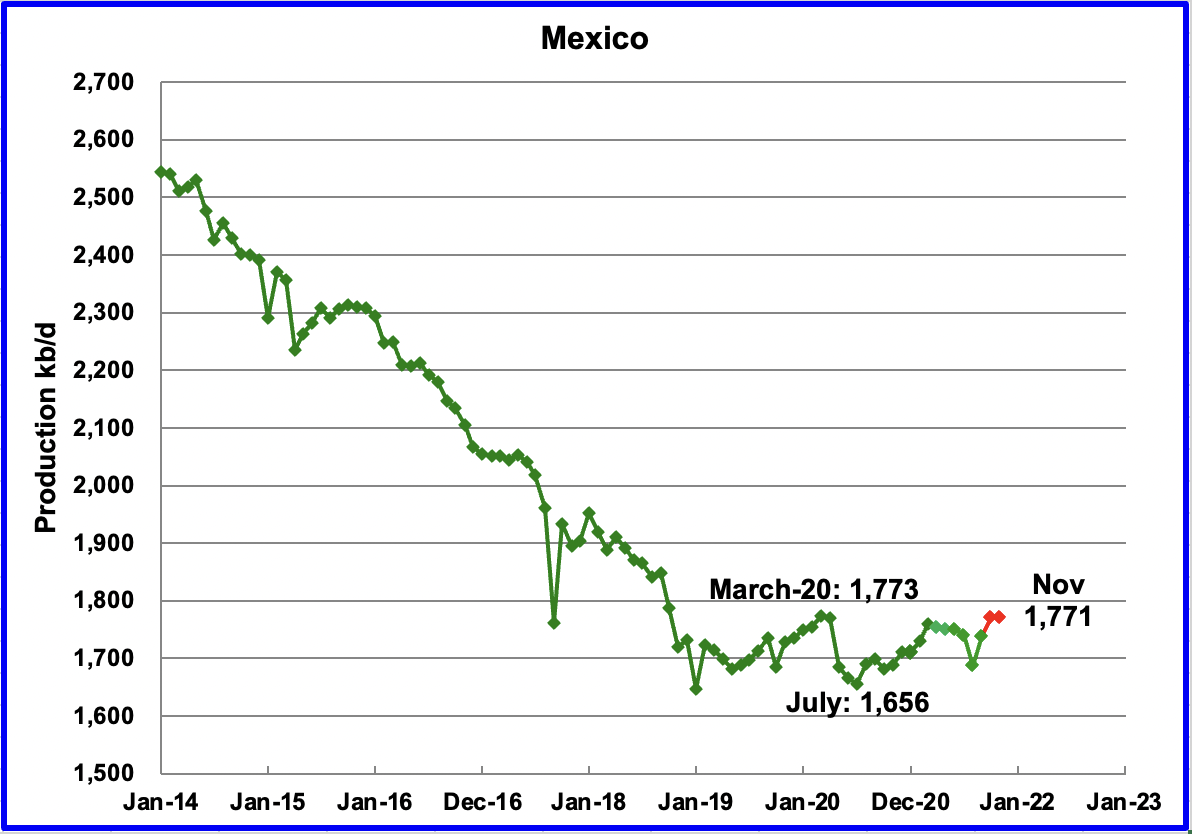
Mexico’s production, as reported by the EIA, for September increased by 51 kb/d to 1,739 kb/d. Data from Pemex shows that October’s output continued to climb to 1,771 kb/d and stayed at the same level for November. (Red markers).
Production has been range-bound between 1,650 kb/d and 1,800 kb/d since January 2019. Note that November 2021 production is essentially the same as March 2020.
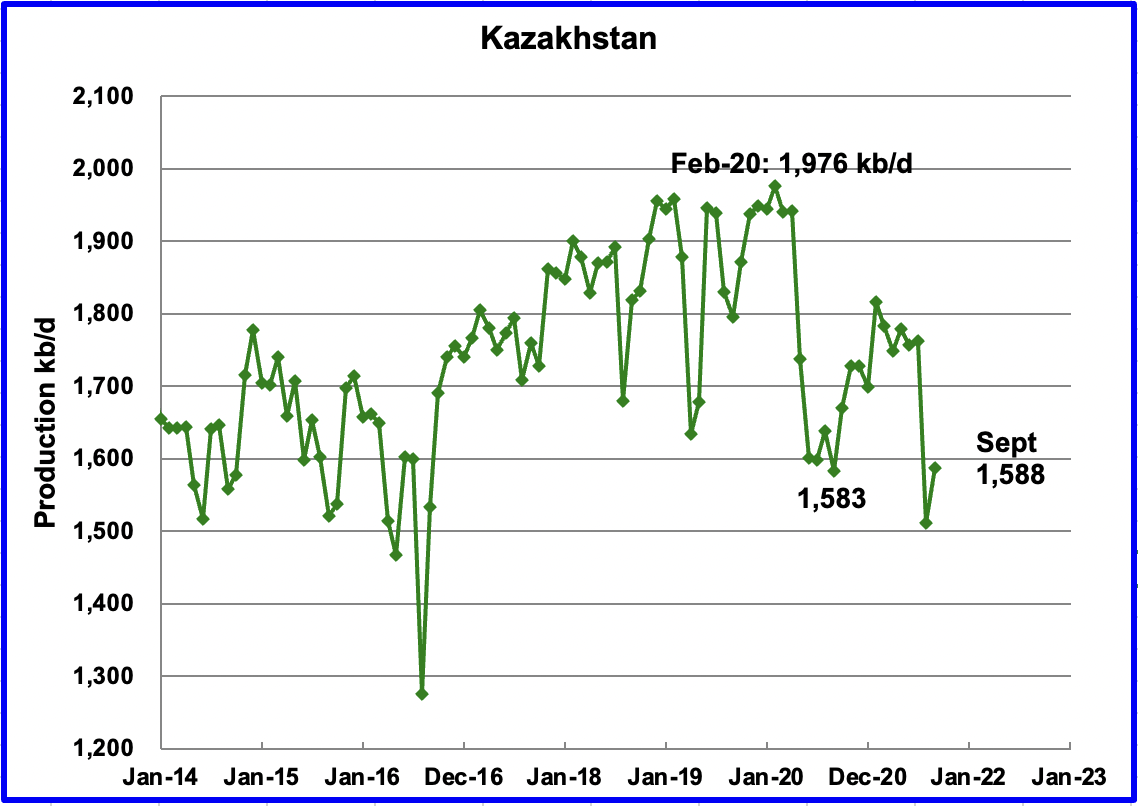
Kazakhstan’s output increased by 76 kb/d in September to 1,588 kb/d following the end of maintenance in the Tengiz field.
Under the OPEC + Declaration of Cooperation, Kazakhstan can produce 1,508 kb/d of crude in September. The September 1,588 kb/d output is C + C.
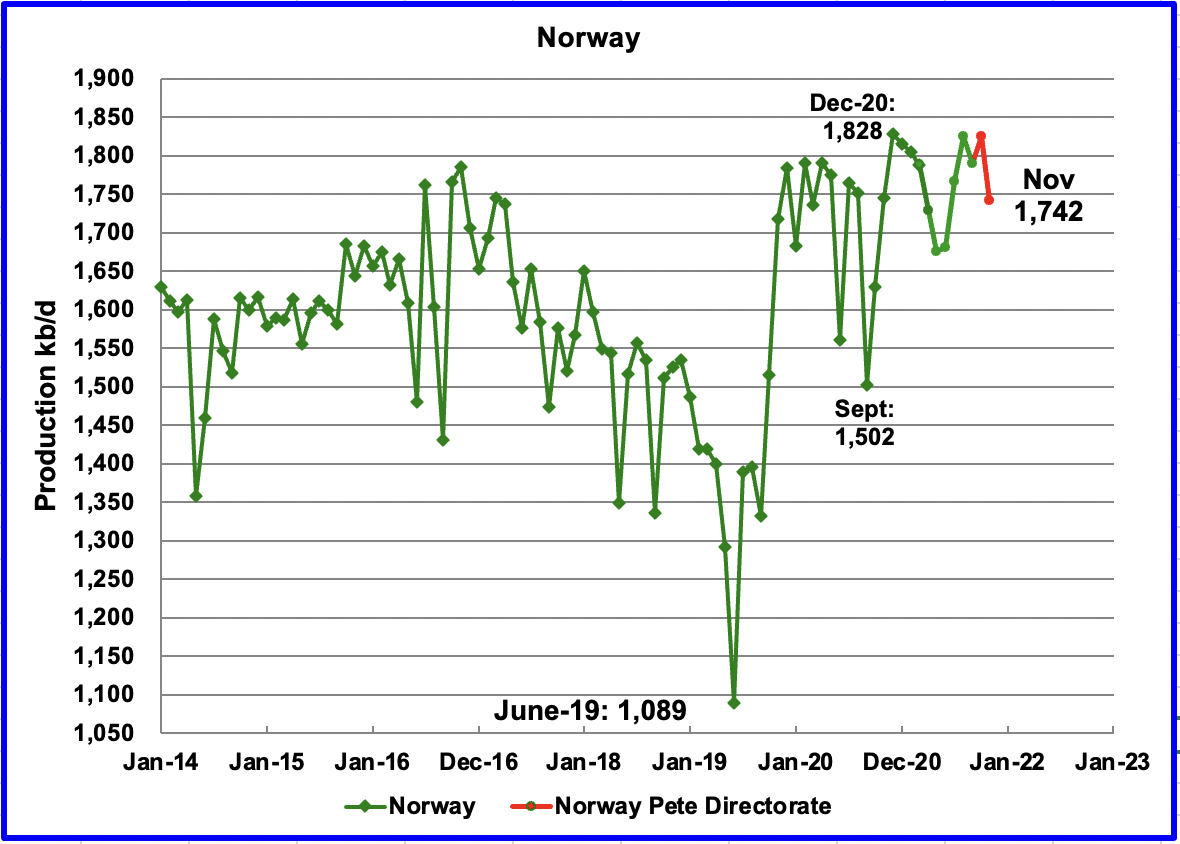
The EIA reported that Norway’s September production was 1,790 kb/d, down 35 kb/d from August. The Norway Petroleum Directorate (NPD) reported that production in October increased back to 1,825 kb/d and then declined to 1,742 kb/d in November. (Red markers.)
According to the NPD, November production dropped due to technical problems. The production level was 5% lower than the Directorate had forecast.
According to the December OPEC report, “The higher oil output in October was due to first oil from Aurfugl Phase 2 by operator Aker BP (OTCPK:DETNF) as well as rising production in Martin Linge, which started-up in July. Part of this monthly increase is also due to the return of some fields from seasonal maintenance. Moreover, after years of delays, the Yme field in the southeastern part of the Norwegian sector of the North Sea started production on 25 October. At its peak, the field should deliver around 56 tboe/d.”
Earlier this year, the NPD implied that Norway’s production would exceed the December 2020 output in the latter half of 2021. There is only one month left to go.
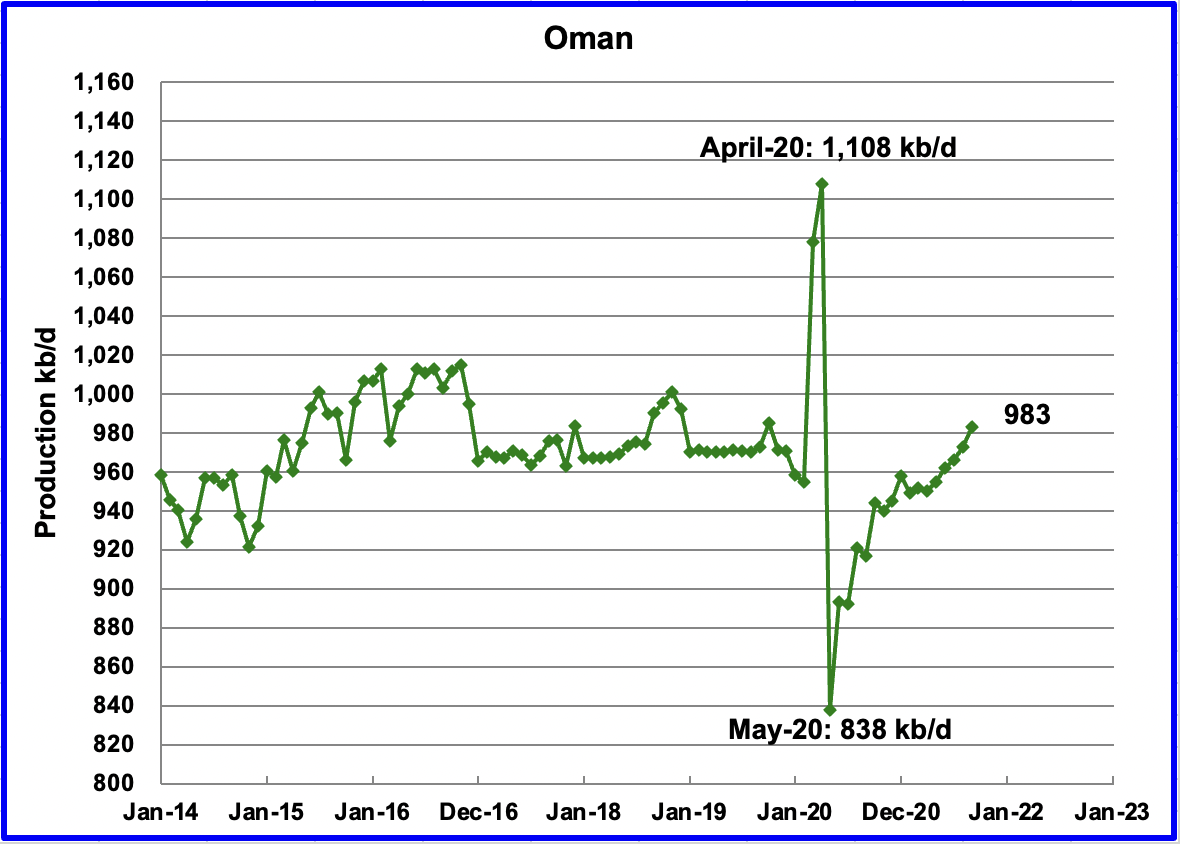
Oman’s September production increased by 10 kb/d to 983 kb/d.
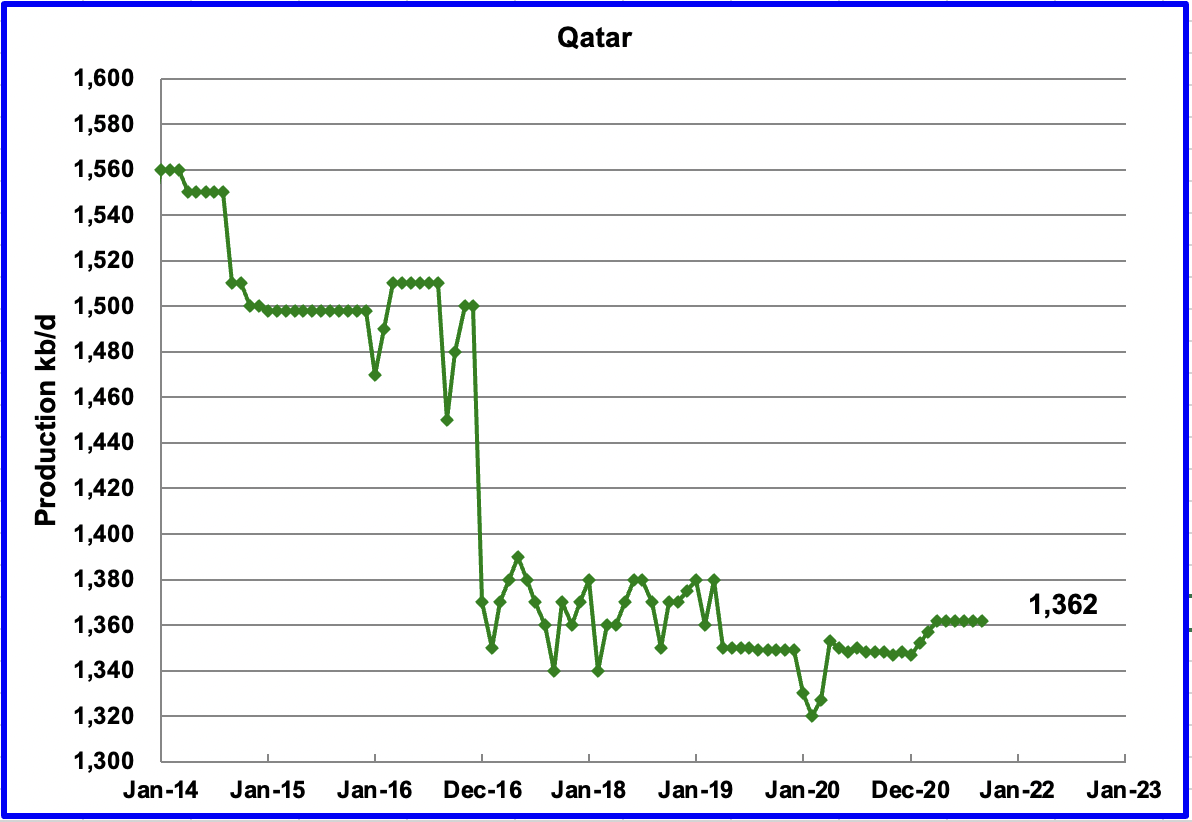
September’s output was unchanged at 1,362 kb/d.
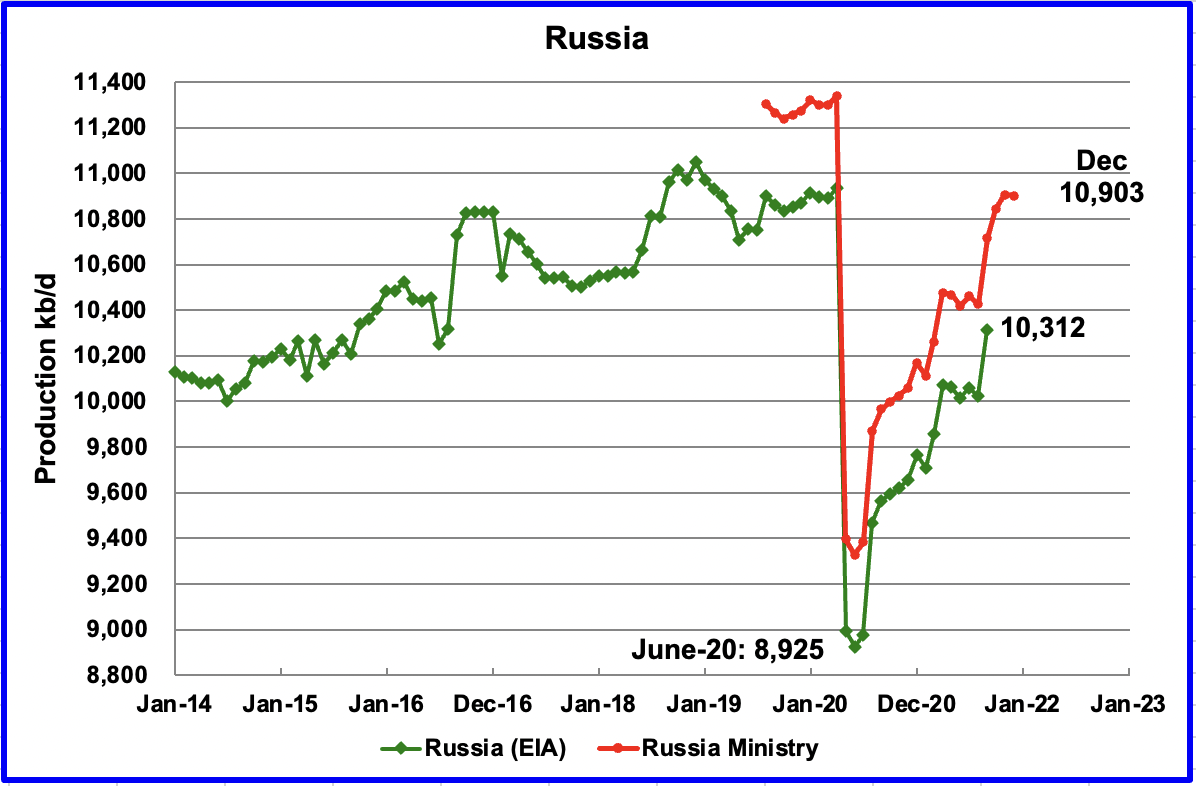
The EIA reported that Russian output increased by 290 kb/d in September to 10,312 kb/d. According to the Russian Ministry of Energy, Russian production increased by an additional 127 kb/d in October to 10,843 kb/d.
This source reported that output in November increased by an additional 63 kb/d to 10,906 kb/d and declined to 10,903 in December and thinks that “Russia’s weak December oil production signals lack of capacity”
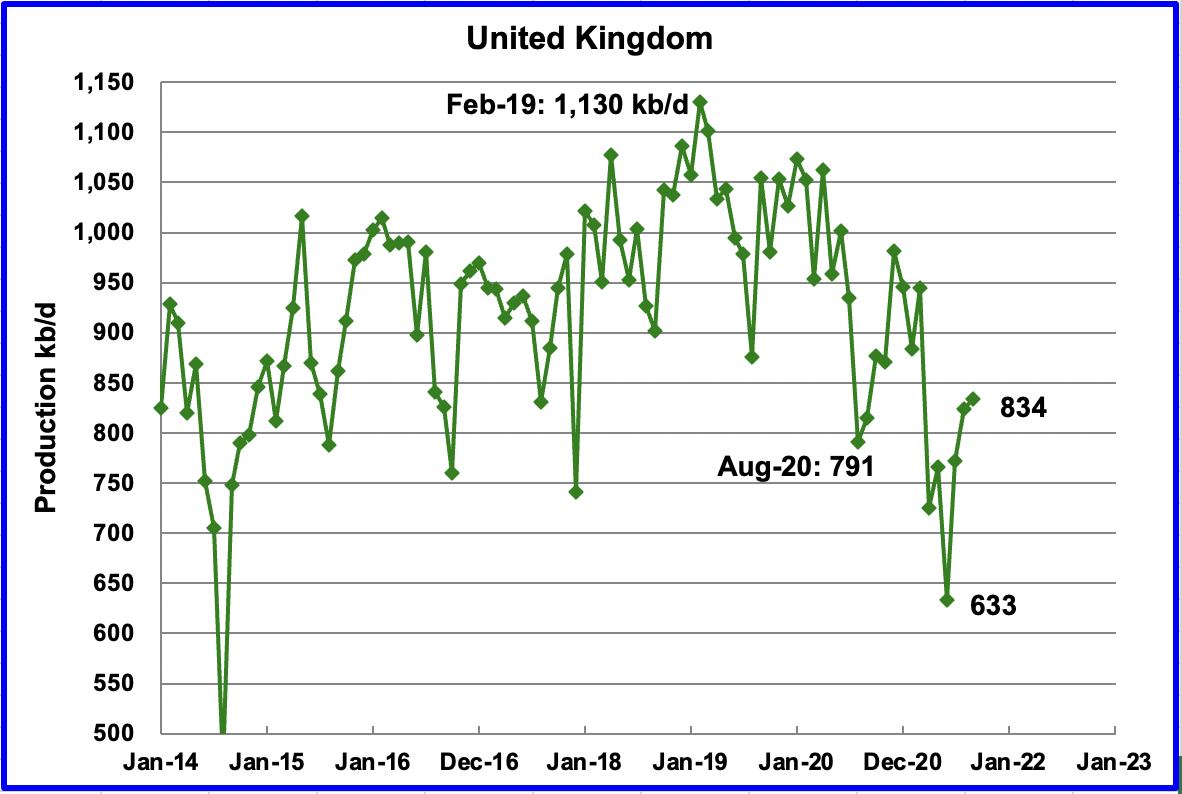
UK’s production increased by 10 kb/d in September to 834 kb/d.
Last year from August 2020 to December 2020, the rebound from summer maintenance was 191 kb/d to 982 kb/d. The rebound so far this year from June is 201 kb/d. This implies/hints that the UK has reached its highest production level for 2021 or is very close to this year’s peak.
Assuming that UK production can return to 850 kb/d by February 2022, that implies a decline rate of close to 90 kb/d/yr.
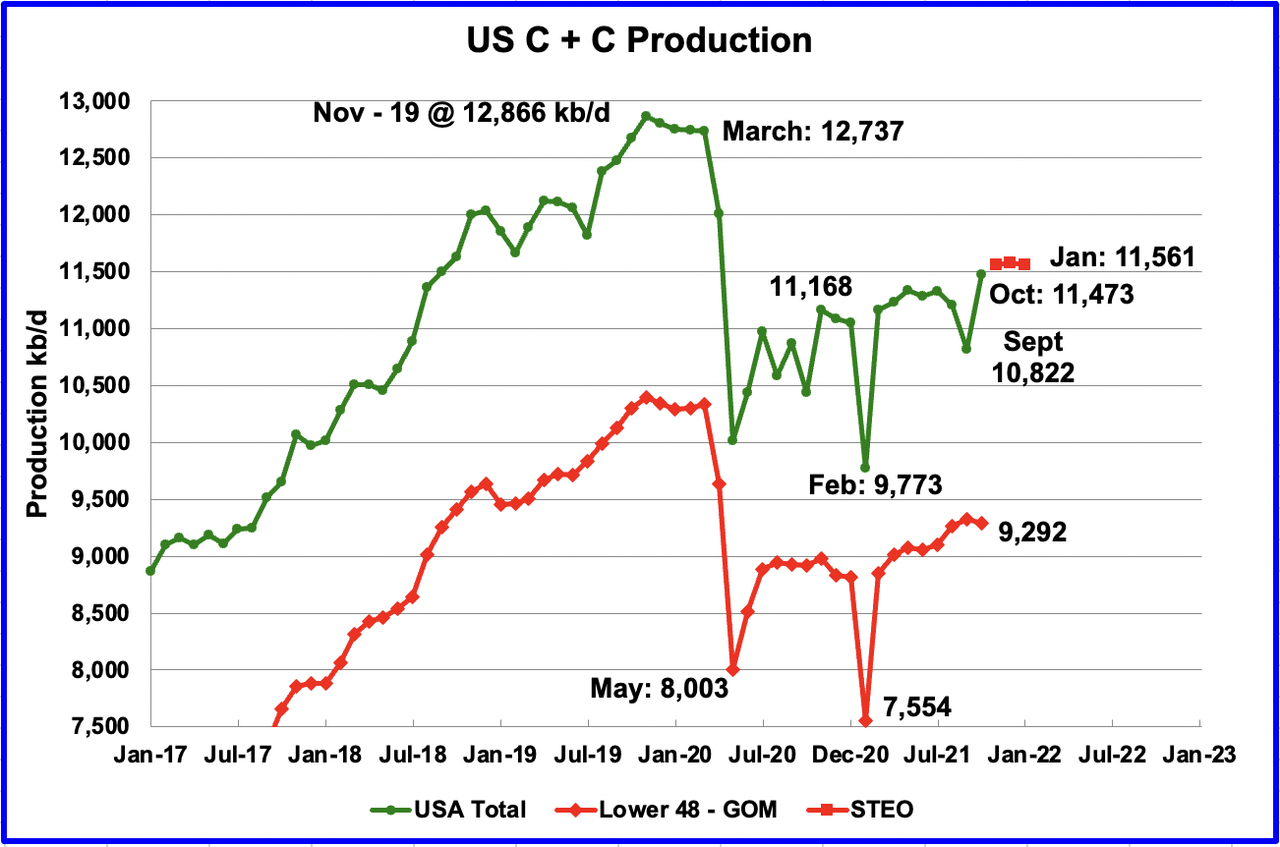
U.S. October production rebounded by 651 kb/d to 11,473 kb/d. The rebound is largely due to increased production in the GOM. GOM output increased by 680 kb/d after the damaged platforms were repaired and brought back on line. The three red markers are the STEO’s output expectation for November to January and are essentially flat at 11,561 kb/d. In the on-shore lower 48, October production decreased by 36 kb/d to 9,292 kb/d.
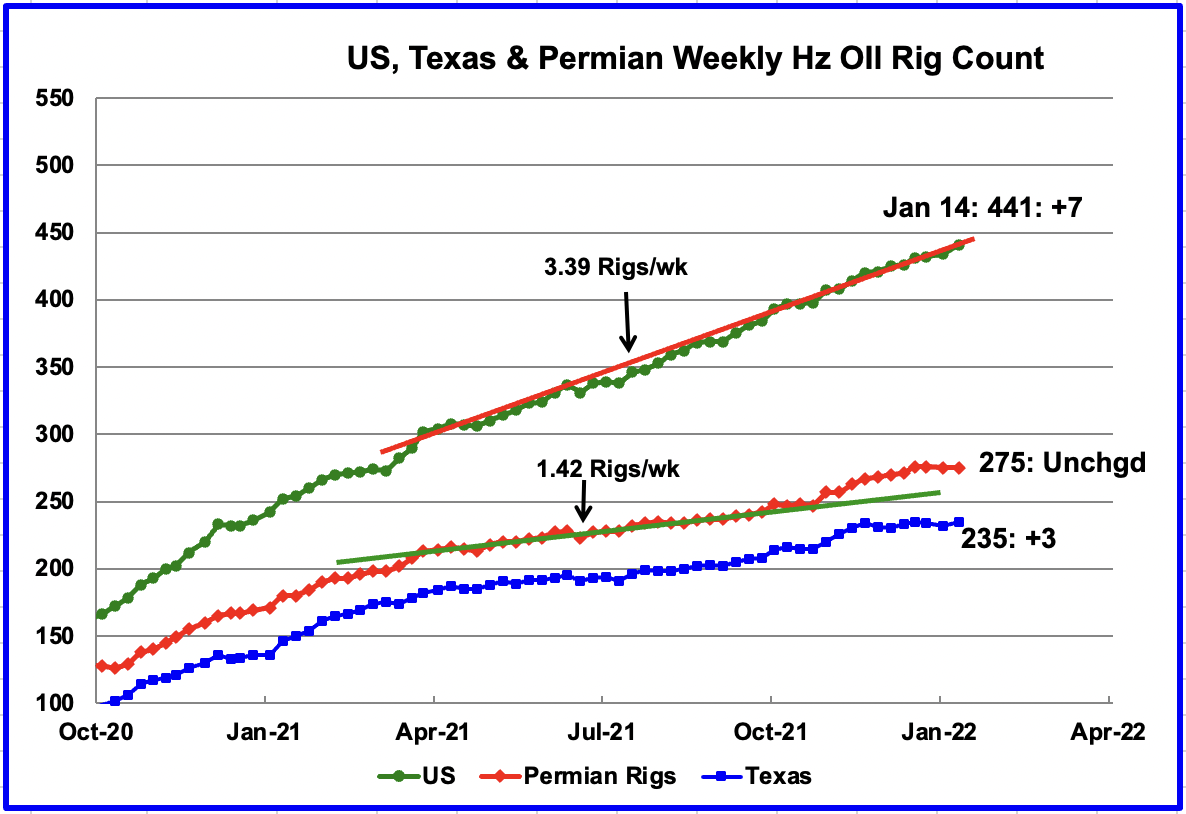
Since the beginning of April, the U.S. has been adding horizontal oil rigs at an average rate of close to 3.39 rigs/wk. For the week ending January 14, 7 horizontal oil rigs were added for a total of 441. Permian rigs were flat at 275 while the Eagle Ford increased by 5. In total, Texas rigs increased by 3. In Texas, there was only 1 more rig operating in the week of January 14 than there was in the week of November 26.
From late April to early November, the addition of horizontal oil rigs in the Permian had been rising at an average rate close to 1.42 rigs per week. However, since Xmas, the weekly addition of rigs has stopped. Xmas holiday?
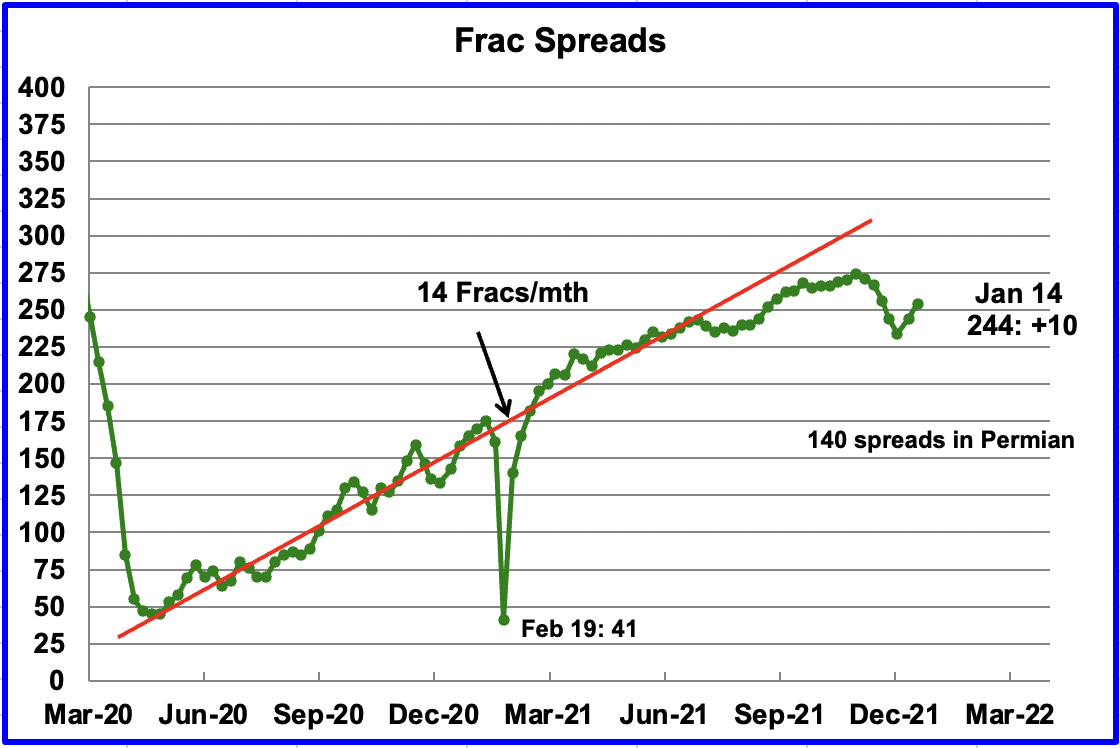
Starting from the week of July 23, 2021, frac spreads were not being added at the previous rate of approximately 14 spreads per month. During December 2021, 37 frac spreads were decommissioned primarily due to the holidays. In the first and second week of January, 10 frac spreads were added each week for a total of 244.
Note that these 244 frac spreads include both gas and oil spreads, whereas the rigs information is strictly oil rigs.
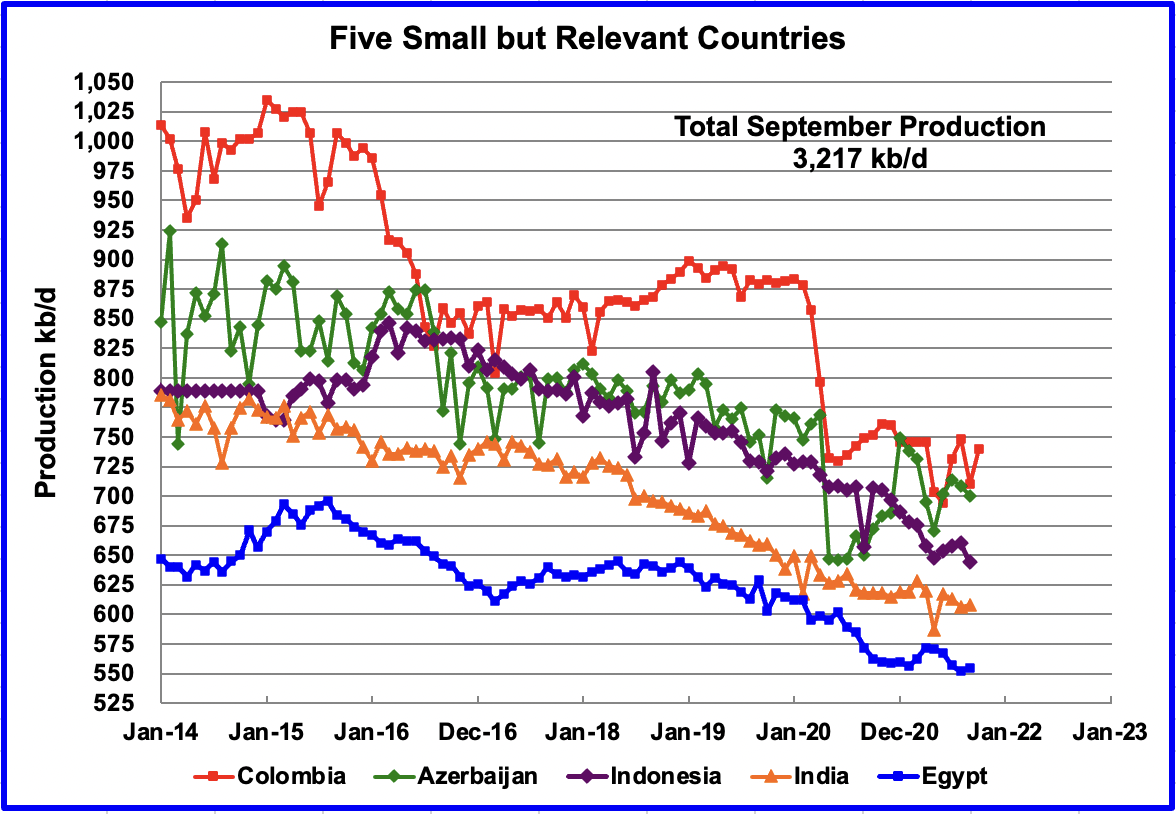
These five countries complete the list of Non-OPEC countries with annual production between 500 kb/d and 1,000 kb/d. Their combined September production was 3,217 kb/d, down by 59 kb/d from August.
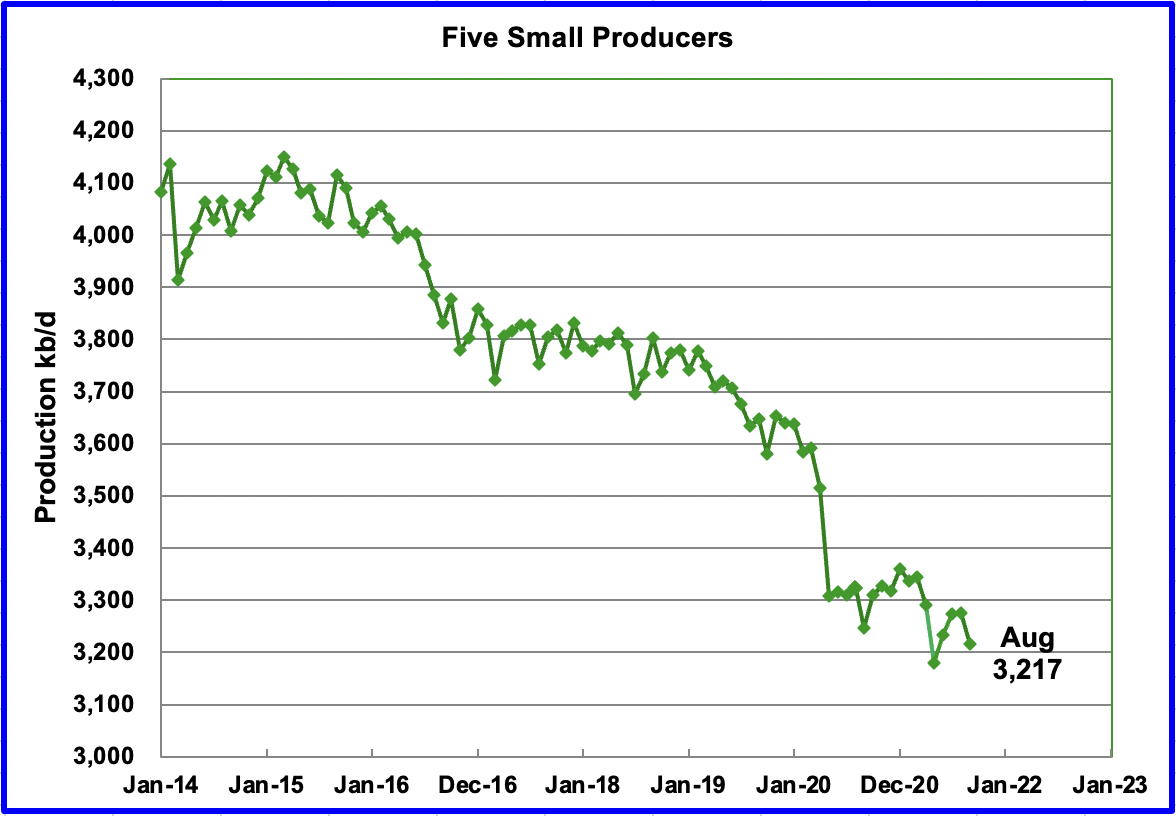
The overall output from the above five countries has been in a slow decline since 2015. The drop in May 2020 from 3,500 kb/d to 3,300 kb/d was primarily from Azerbaijan, 125 kb/d, which is a member of OPEC + and Columbia.
World Oil Production
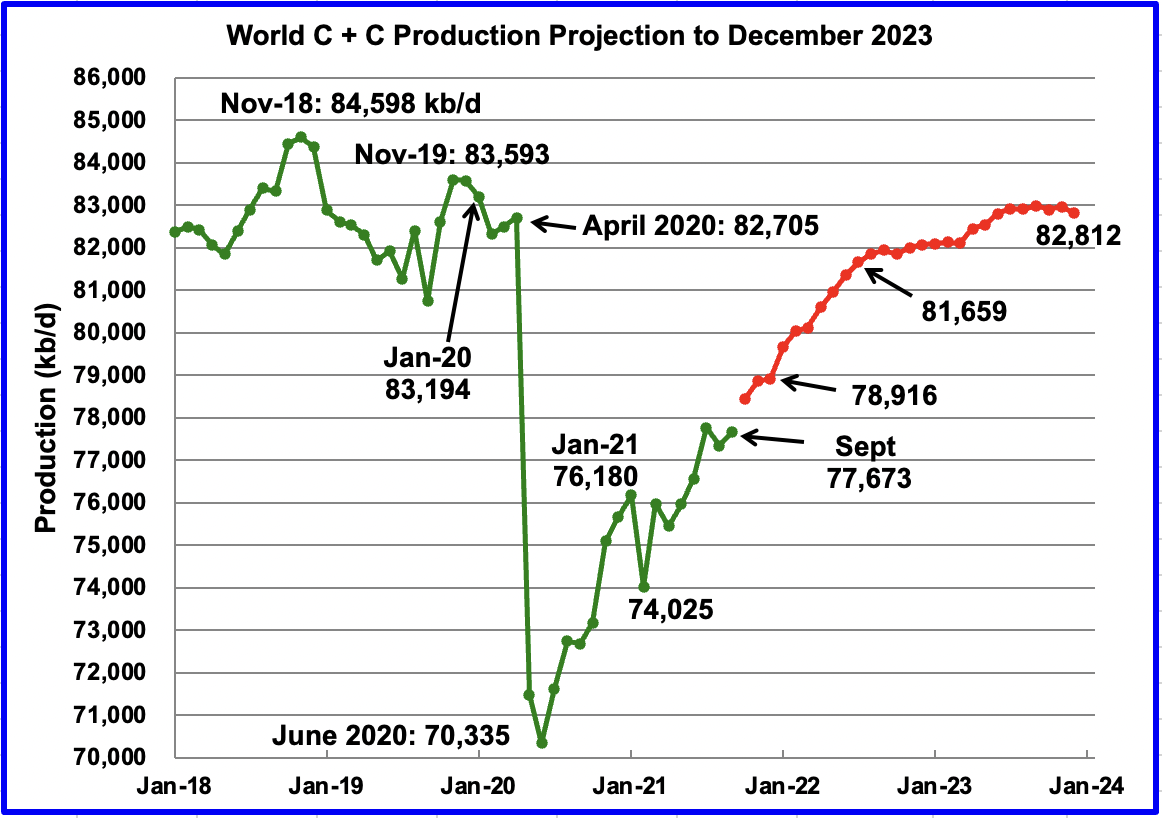
September world oil production increased by 330 kb/d to 77,673 kb/d according to the EIA. Of the 330 kb/d increase, the three biggest contributors were Russia 290 kb/d, Nigeria 170 kb/d, and Kazakhstan 76 kb/d. The U.S. dropped by 381 kb/d.
This chart also projects world production out to December 2023. It uses the January 2022 STEO report along with the International Energy Statistics to make the projection. (Red markers). It projects that world crude production in December 2023 will be 82,812 kb/d, 382 kb/d lower than the January pre-COVID rate of 83,194 kb/d and 1,786 kb/d lower than the November 2018 peak.
In the previous post, production for December 2021 was projected to be 80,044 kb/d. The latest EIA update now projects December 2021 output to come in at 78,916 kb/d, a downward revision of 1,126 kb/d. What change occurred that caused the EIA to lower its forecast by 1,126 kb/d.
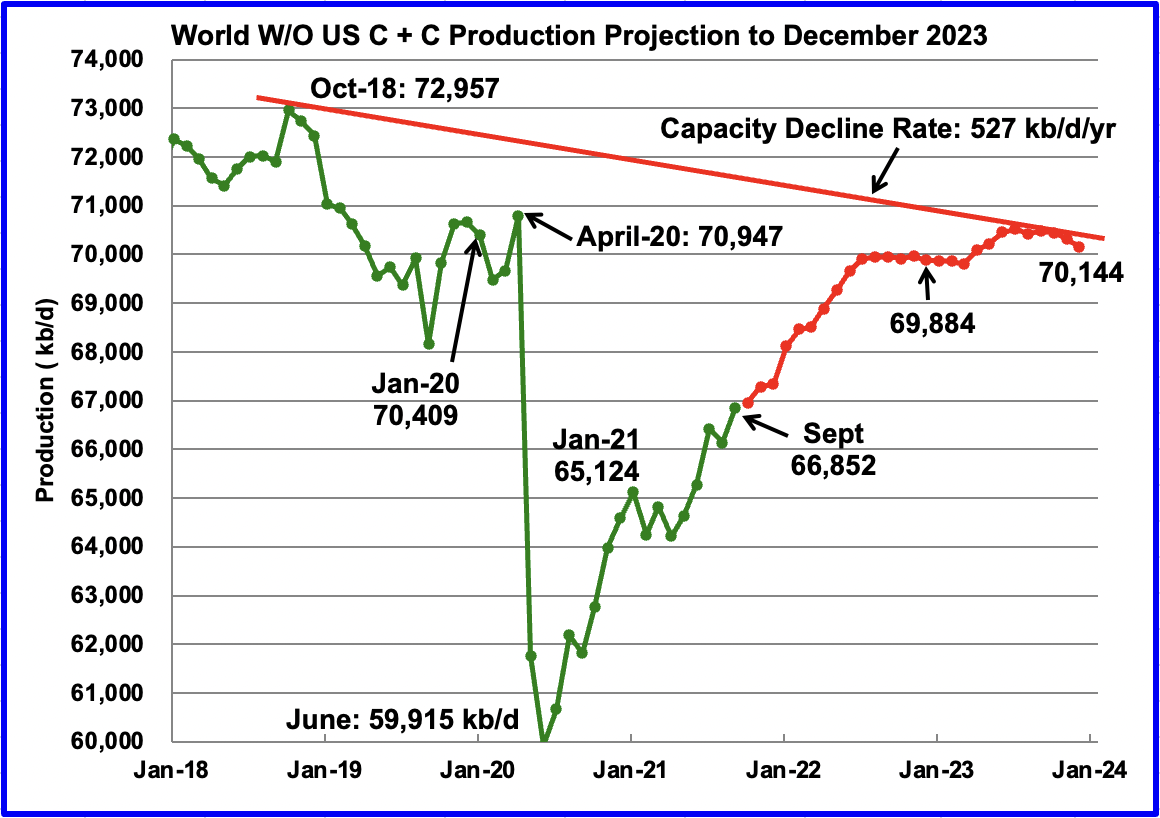
World W/O U.S. oil production increased by 715 kb/d to 66,852 kb/d in September according to the EIA. Very little increase is expected for October. (First red marker).
This chart also projects world production out to December 2023. It uses the January 2022 STEO report along with the International Energy Statistics to make the projection. (Red markers). It projects that world crude production W/O U.S. in December 2023 will be close to 70,144 kb/d. Note this output is only 260 kb/d larger than the December 2022 output of 69,884 kb/d and still less than the January 2020 pre-COVID output of 70,409 kb/d.
Note that the chart also shows a Capacity Decline Rate line of close to 527 kb/d/yr over the years 2018 to 2023. Capacity decline encompasses natural decline and decline associated with reduced investment for drilling and exploration.
Editor’s Note: The summary bullets for this article were chosen by Seeking Alpha editors.
Be the first to comment