

Artit_Wongpradu/iStock via Getty Images
The SPDR S&P 500 Trust ETF (NYSEARCA:SPY) closed below important support levels on Friday, October 14. Strong downtrends in the short and intermediate timeframes create conditions that will likely encourage investors to sell SPY until it potentially finds support in the range between $340 and $345 within the next 10 to 25 days. A minor recovery in price up to $368 would therefore present a compelling opportunity to sell SPY short.
Breaking below key support levels
Point-and-figure charts help us identify key levels of support and resistance. Using a point-and-figure chart for SPY with a configuration of 2% box size and 3 box reversals, we can see that there was support at $368.71. SPY broke below this level by closing below $361.48:
SPY Point and Figure 2pct x 3 (Created by author using data from Stockcharts.com, 16 October 2022)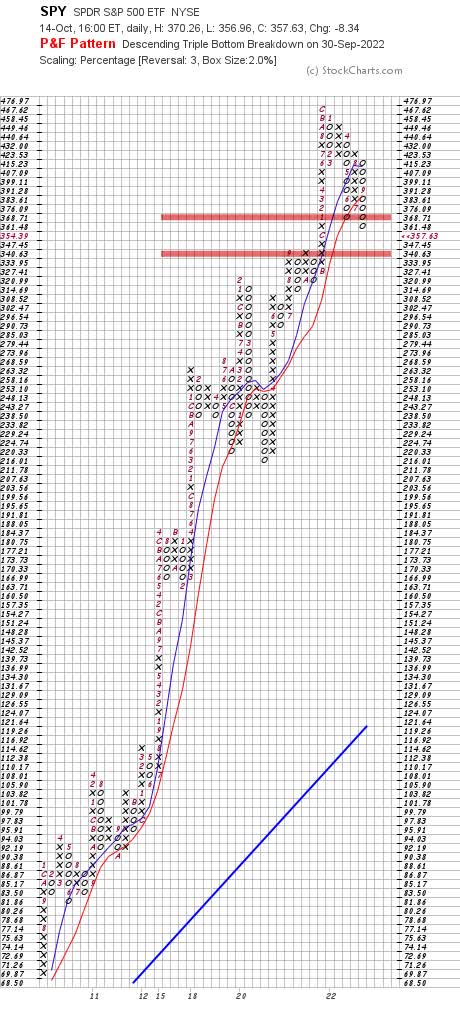
The next potential support level in this configuration is $340.63. This was previously a resistance level that SPY could only break above on its third attempt.
By increasing the box size of the point-and-figure chart from 2% to 3%, we can reduce the noise in the data set and identify potentially more significant support and resistance levels. We can observe in this configuration that SPY broke below support at $371.58 by closing below $360.75. On this configuration, there is no support until $320.52:
SPY Point and Figure 3pct x 3 (Created by author using data from Stockcharts.com, 16 October 2022))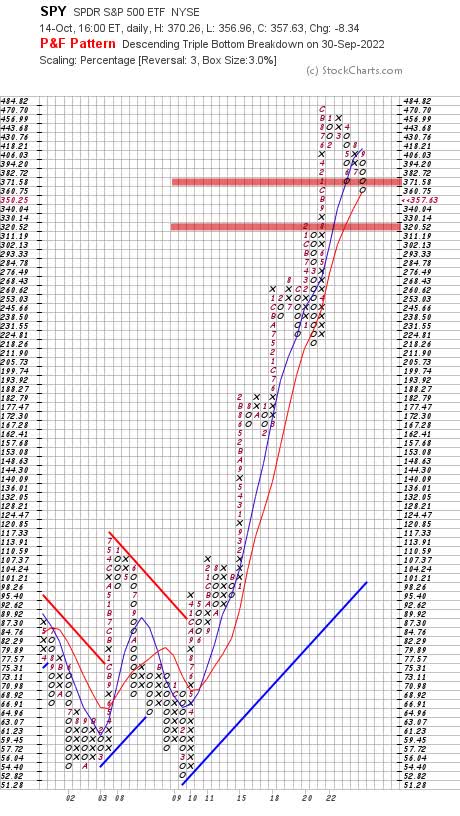
Short and intermediate downtrends are getting stronger
The Average Directional Index, also referred to as ADX, helps us calculate the strength of a trend. A rising ADX that is above 25 indicates the prevailing trend is getting stronger. The current figure for SPY in the weekly timeframe is 28.90 and rising, implying that the intermediate downtrend is getting stronger.
SPY Weekly Chart, 5 years (Created by author using data from Stockcharts.com, 16 October 2022)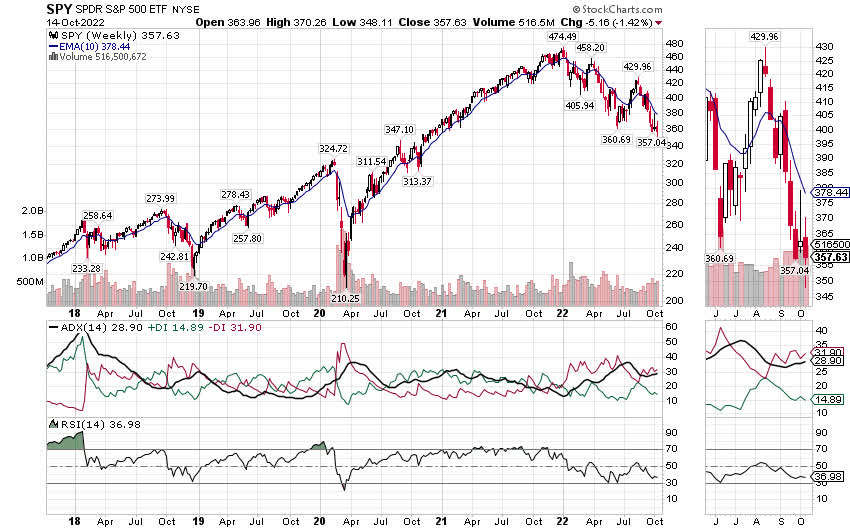
On the same chart, we can also observe that SPY is far from reaching the traditional oversold level for the Relative Strength Index, or RSI. This implies that SPY could fall further before we reach levels of potential exhaustion in selling pressure.
We can observe similar readings for SPY in the daily timeframe. The downtrend is getting stronger based on the rising ADX and price is still far from oversold on RSI:
SPY Daily Chart, 1 year (Created by author using data from Stockcharts.com, 16 October 2022)
Precarious macro and microeconomic events
Bearish technical conditions do not necessarily push prices lower themselves. They reflect a negative sentiment, which means investors are likely to react disproportionately to bad news. Catalysts for a further decline in SPY could come from negative macro and/or microeconomic developments that could arise soon.
On the macroeconomic front, any indication that Federal Reserve could tighten monetary policy more than what investors currently expect will likely encourage further portfolio de-risking or inflict major financial consequences.
Recent interventions by the Bank of Japan and Bank of England, along with the Swiss National Bank’s drawing on increasingly significant swap lines, prove that central banks have already had to address perilous domestic issues. If something important has not already broken, it seems likely we are on the verge of seeing something break even if the Fed simply tightens according to present expectations.
On the microeconomic front, U.S. earnings season started last Friday with some of the country’s largest banks reporting mixed results. With most of the largest U.S. companies announcing over the next 15 trading days their results for the third quarter of 2022, the risk here is that many or most of these companies could present negative surprises to investors during their announcements and forward guidance.
Trade setup
Any minor recovery in SPY’s price towards the $366-$368 range will create a favorable entry point to sell SPY short. Investors could consider placing their stop-loss just above the 10-week Exponential Moving Average since a break above this level could imply a significant reversal in SPY’s short-term downtrend. Depending on your entry price, you could risk up to $11 on this trade for a possible reward of $21 to $23.
-
Ideal entry price: $366-$368
-
Take-profit: $345
-
Stop-loss: $377-$379
-
Timeframe: 5 to 20 trading days
What could go wrong with this trade?
One factor that could push SPY higher than the $377 minimum stop-loss price would be better-than-feared announcements from U.S. companies over the next few weeks. Another would be a fall in Core PCE and/or CPI rates when they are announced on 28 October and 10 November respectively. A fall in either of these rates may provoke a knee-jerk reaction to buy equities. Indeed, I recently wrote an article in favor of the iShares 20+year US Treasury Bond ETF (TLT) because I expect inflation expectations and inflation rates to decline soon. However, I also believe that bearish technical conditions mean investors will likely push SPY to the $345 target before the release of these inflation figures.
Targeting $310 for the potential low of 2022
We can use Fibonacci retracement levels to derive technical targets that SPY could reach beyond the 20-trading-day timeframe that this article focuses on. Using the move from the 2020 low ($210.25) to the 2022 high ($474.49), the next traditional retracement level is the 61.8% retracement. This retracement is equal to $311.19. This means investors could consider targeting the zone between $310 and $320 for a new short-term bearish trade if SPY breaks below the next support zone of $340 to $345.
SPY Weekly Chart with Fibonacci Levels, 5 years (Created by author using data from Stockcharts.com, 16 October 2022)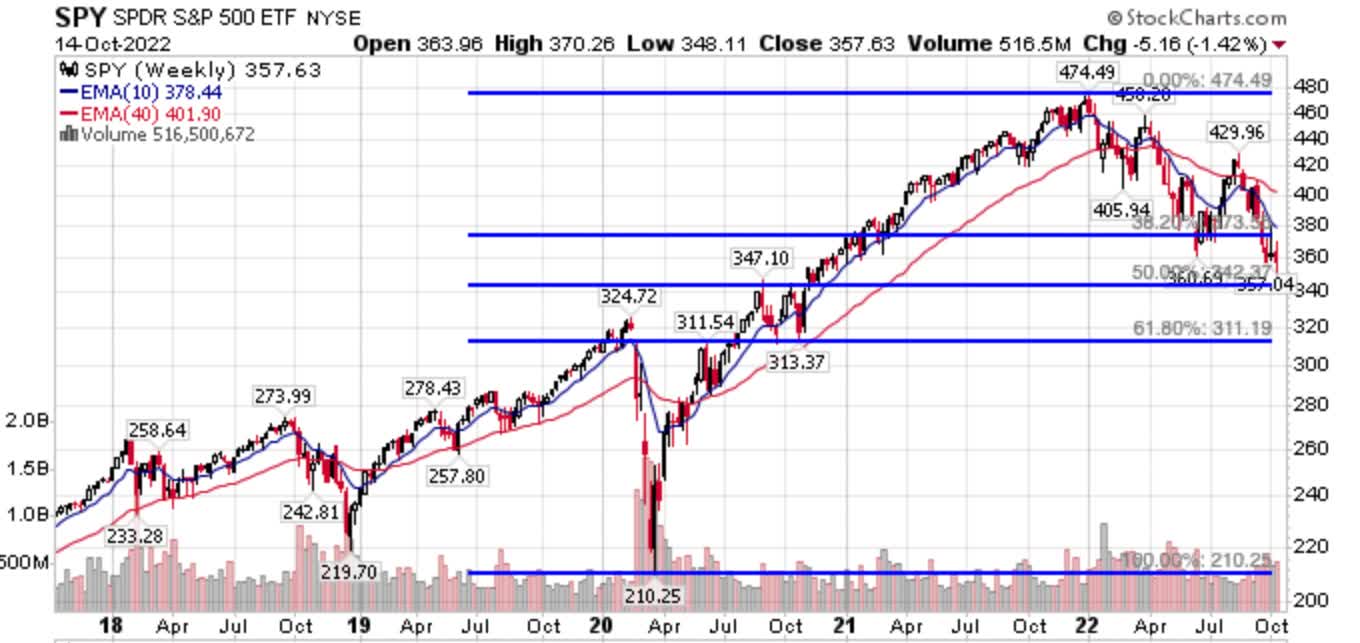
Conclusion
SPY has broken below key support levels. Meanwhile, downtrends in the short and intermediate timeframes are getting stronger. These bearish technical conditions imply that investors are likely to react in a disproportionately negative way to any forthcoming macro and micro events. This leaves SPY vulnerable to a sharp decline to at least $345 over the next 5 to 20 days.
Be the first to comment