andresr
Investment Summary
The buy thesis on Select Medical Holdings Corporation (NYSE:NYSE:SEM) remains well in tact following its Q2 FY22 numbers. I’ve covered the stock at length previously [here], and noted several tailwinds related to its earnings and investment trends over the years to date.
With the continuation of these trends from Q2 FY22 the company looks well positioned to continue delivering bottom-line growth and generating sufficient return on its invested capital looking ahead. We continue to add to the SEM position at these ranges [in small parcels to better manage sizing], seeking an initial return objective up to $31 on a buy recommendation.
Earnings trends continue in latest numbers
SEM clipped a strong set of quarterly numbers for the three months ending June 30 2022. Revenue of $1.58 million (“mm”) came in ~130bps higher on the year although was tied to a 775bps increase in cost of services to c.$1.4mm. Total costs for the year jumped ~720bps, however, this was comprised of a $51mm non-cash depreciation and amortization charge for the quarter [+10bps YoY].
Digging a little further into the operating metrics illustrates pleasing results by my estimation. Agency rates have narrowed 22% sequentially from Q1 FY22-Q2 FY22, clipping an average agency rate (“AAR”) of $111/hr for the quarter [from $143/hr]. By June and July, the AAR had dropped to $95/hr and $90/hr respectively. Whereas utilization also compressed from 37.5% last quarter to reach 24.1% by June, the overall agency expense decreased ~37% YoY to $56.4mm from the period of Q1-Q2, and had fallen to $12.8mm by June.
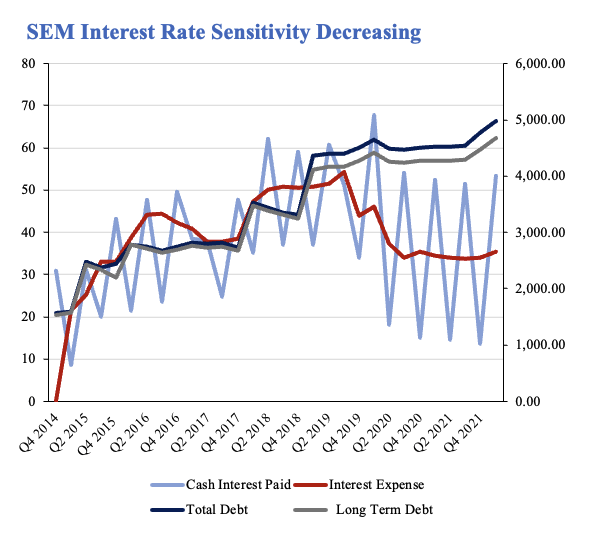
One key factor to the SEM investment debate remains around its sensitivity to policy rates and what it’s doing to hedge this duration risk. I’d talked about this at length in our previous analysis of SEM, and noted the company’s interest expense had been declining since FY19. Interest expense did creep up during the quarter, however, and totaled $41.1mm from $33.9mm from the previous three months. With respect to its hedging activities on this, I made the following comments previously, supported by Exhibit 1:
“The interest expense on its term loan debt looks to potentially creep lower in coming periods as well. This is due to SEM’s collar on a floating rate, that’s indexed to 1-month LIBOR/SOFRA. The interest rate collar caps floating rate exposure on a notional $2 billion of term liabilities at 1%. When the cap of 1% is breached on the term debt the counterparty in the contract is liable for payment.
SEM has this hedge in place until September FY24, and the position now rests at ~$70 million in the money. Effectively we see SEM’s sensitivity to rates reducing substantially from this move. Interest expenses have been reducing since 2019 whilst cash interest payments are following suit. As central banks embark on the tightening cycle, this adds weight to our ‘quality’ thesis for SEM’s balance sheet, despite its debt load.”
Providing an update on the company’s liability structure, CEO Martin Jackson was quite transparent on the Q2 earnings call:
“At the end of the quarter, we had $3.8 billion of debt outstanding and $94.7mm of cash on the balance sheet. Our debt balance at the end of the quarter included $2.1 billion in term loans, $350mm in revolving loans, $1.2 billion in 6.25% senior notes and $88.4mm of other miscellaneous debt. We ended the quarter with net leverage for our senior secured credit agreement of 5.44 times.”
This point is a key factor in the debate moving forward [$3.8 Billion is no small obligation] and may impact FY22-FY24 pre and post-tax earnings by estimation.
Exhibit 1. SEM interest rate sensitivity: Q4 FY14-Q1 FY22, semiannual. Interest expense has since curled up to $41mm in Q2 from $33mm in Q1.
- This remains central to the company’s ability to invest capital, generate return on its investments and carry this through to earnings.
- Outstanding debt is now $3.8 Billion comprised of a mix of term loans, revolvers, and is inclusive of a $1.2 Billion in senior notes paying 6.25% YTM.
- Net leverage on secured credit at ~5.4x.
Note: SEM Q2 FY22 cash interest and interest expense not shown. Data taken from previous HB Insights analysis on SEM from June FY22. (Data: HB Insights – SEM [June 2022]; SEM SEC Filings)
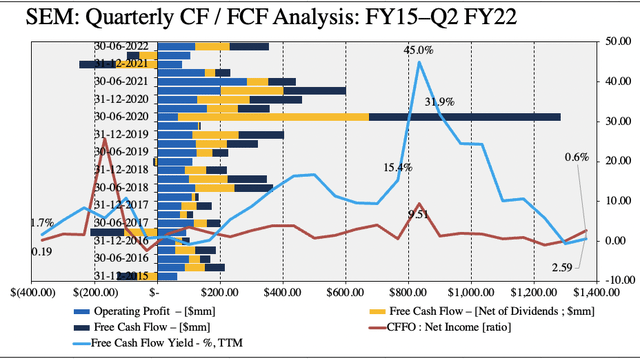
In addition, and as seen in Exhibit 2, quarterly free cash flow (“FCF”) trends have been noteworthy takeout from the company’s earnings from at least FY18-date. Exhibit 2 is a busy chart, synthesizing a wide array of data into a single image. Key features to note, however, are the company’s narrowing FCF yield [blue line], that now sits in-line with FY16 levels.
However, whilst the realized TTM FCF yield has tightened, the absolute conversion of FCF has been a key feature of the SEM investment debate. FCF is the lifeblood of any corporation, and therefore I’m satisfied with the company’s level of free cash conversion from operating income, as seen below. It realized $125mm in FCF in Q2. Meanwhile, the ratio of CFFO to net income remains at a healthy ~2.6x, indicating there’s a high degree of cash backing the company’s valuation [from an earnings perspective].
Exhibit 2. Quarterly FCF trends have been a standout for SEM
Note: All figures in $mm or [%], calculated from GAAP earnings with no reconcilations. Free cash flow calculated as [NOPAT – investments] with free cash flow net of dividends as [(NOPAT – Investments) – dividends]. Free cash flow yield calculated as a function of enterprise value. Cash flow from operations to net income calculated as [CFFO/NI] on quarterly basis. (Data: HB Insights; SEM SEC Filings)
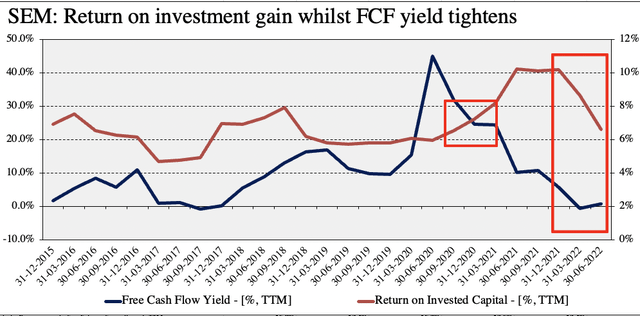
On face value it seems alarming, observing SEM’s FCF yield slide at such a steep gradient. However, I’d also point out that a declining FCF [and/or FCF total] is a desirable characteristic, if the company’s return on investments (“ROIC”) is high or increasing, comfortably outpacing the cost of capital, and it has access to sufficient capital.
As seen in Exhibit 3, SEM’s FCF yield and ROIC met at a crossover in Q4 FY21, whereby the latter continued to surge and reach highs of c.10% vs. a FCF yield of around 2.5% [both on TTM figures]. Whilst the ROIC has compressed into Q2 FY22, it still outweighs the WACC hurdle by ~1 turn. As such, the company is generating sufficient return on its invested capital following heavy reinvestment of FCF back into the business. Note, that trends have begun to converge in Q2, and I estimate this could be a tailwind to earnings going forward as SEM begins to book the income earned on its ROIC.
Exhibit 3. ROIC continues to rest above realized FCF yield and the WACC hurdle and easily compensates for tightening FCF
- Declining FCF / FCF yield along with increasing ROIC that outpaces cost of capital is an appealing feature.
- The crossover point came in FY20 for SEM whereby ROIC curled up following heavy reinvestment from FCF.
- Trends are converging again as the company begins to realize FCF pull-through from ROIC income.
Note: All figures in [%]. Return on invested capital calculated as [NOPAT / Invested capital] on TTM basis. For more on relationships described above with ROIC, FCF and earnings, see: Mauboussin & Callahan (2022): Good Losses, Bad Losses; All losses are not created equal; Consilient Observer: Counterpoint Global Insights, Morgan Stanley Investment Management (Data: HB Insights, SEM SEC filings)
Valuation and conclusion
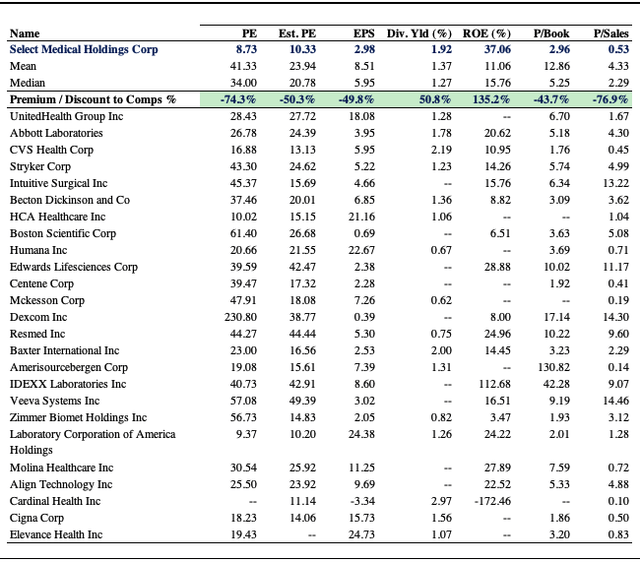
In tandem with my previous analysis, shares are trading at a respective c.60% average discount to peers across multiples used in this analysis, as seen in Exhibit 4. I’ve made no change to my previous price objective of $26-$31 based on the company’s latest earnings.
SEM comes in at 8.7x trailing P/E and is priced at 2.95x book value, each representing compelling value by my estimate. Coupled with the ROIC and FCF trends above, the discount looks to be unwarranted and this is backed by a 37% TTM ROE that sits more than 135% above the peer group. At 8.73x trailing EPS of $2.98 SEM is valued at $26, suggesting shares are fair and reasonably priced.
Exhibit 4. Multiples and comps analysis
Image: HB Insights; Data: HB Insights, Refinitiv Datastream
SEM remains a buy following its latest set of numbers. Earnings trends indicate the company still presents with a sizeable amount of forward upside capture and is reasonably priced by my evaluation. I continue to recommend SEM as a buy on an initial $26-$31 price target outlined in my previous analysis.


Be the first to comment