

Maartje van Caspel
Co-produced with Treading Softly
Feeling confident or fearful in the market lately?
According to The Fear/Greed Index, we’ve topped off on a recent spike of Greed and may be heading back towards the familiar stomping grounds for 2022 of mostly Fear.
CNN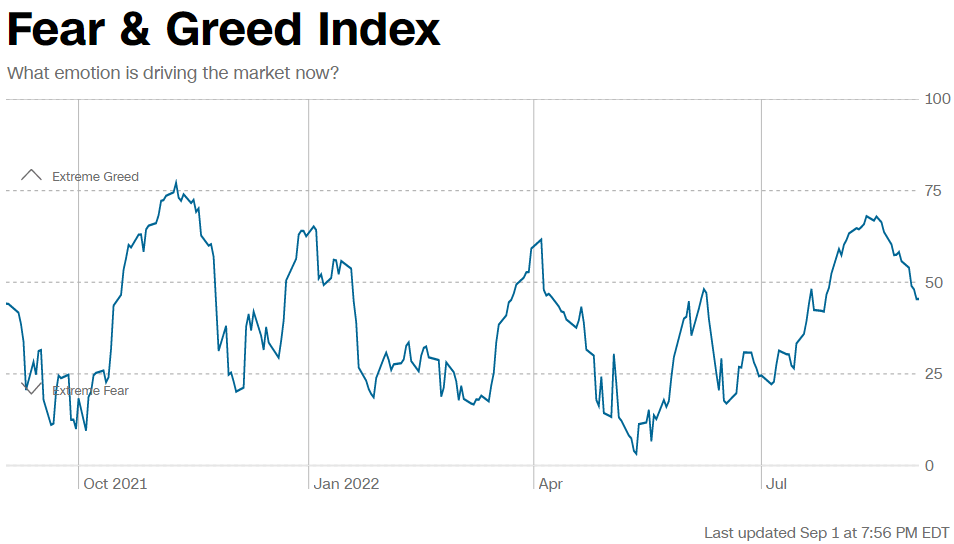
Technically as of this screenshot, we’re sitting in the neutral zone, the grey no-man’s-land where we are all emotionally stable.
Yet, when we stop thinking about the market itself, we’ve seen another sector in the market get pummeled as of late. Things have been rough for fixed-income.
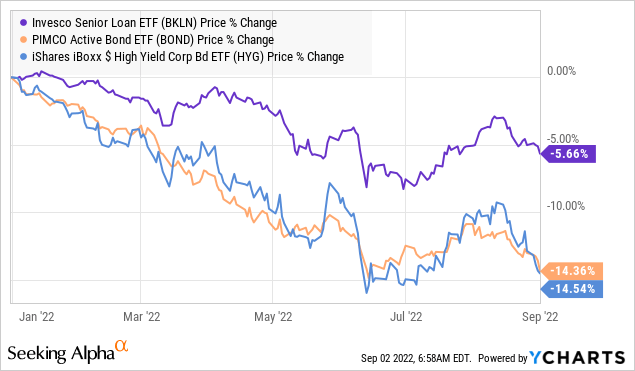
As rates have risen, bond and loan prices have fallen. This is due to “duration risk.” Duration measures how sensitive an investment’s price is to interest rate changes. A loan that repays next month? It will likely trade very close to par even if its coupon is much lower than what is otherwise available. The value of that bond won’t change much due to interest rate changes.
A loan that won’t repay for another 10 years? Think that people were buying 10-year bonds at 2% yields just last year. Today, you can get Treasuries with much higher yields. The price of bonds has to come down so that the yield is still competitive. Because the rates of old bonds always compete with rates available on new bonds, the prices are sensitive to the prevailing interest rates.
The longer away from when a bond or loan matures, often the more interest rate sensitive it is. A small increase of even 50 basis points, 0.05%, can drop a bond’s intermediate trading value by 5%.
So as the Federal Reserve continues to hike rates, as they have done so far, fixed income investors are getting the deal of a lifetime. They are getting higher yields from newly issued bonds and buying older bonds at a discount to face value.
When are investments centered around bonds and loans not as risky as they may appear?
1. Most firms that could refinance debt did so in 2020-2021 when rates were near rock bottom and liquidity was being pumped into the system.
2. Loans historically reach default in the last 1/3rd of their lifespan.
3. Debt coverage levels are at record highs.
These types of investments offer sky-high yields due to the dropping intermediate trading value, but savvy investors or fund managers who hold their bonds and loans till maturity know they’ll still get PAR for them! The borrowers don’t suddenly owe less money, it is simply the market repricing the value of future cash flows. So while the income rains in, it doesn’t matter what someone else will pay you for it. You know its terminal value when it matures.
As such, we can demand higher yields knowing that they’re covered and the future cash flow outlook is bright.
Let’s look at two such opportunities.
Pick #1: ECC – Yield 17%
Eagle Point Credit Company Inc. (ECC) reported earnings that were a similar story to other CEFs that Eagle Point Credit Company Inc.in CLOs. They experienced super high cash flow and declining NAV. In other words, they were making more money while the market’s valuation of CLOs declined.
Over the past year, ECC has received $4.70/share in recurring cash flows, which leaves $3.39/share in cash flow after total company expenses. (Source: ECC Quarterly Update 2Q 2022)
ECC Quarterly Update 2Q 2022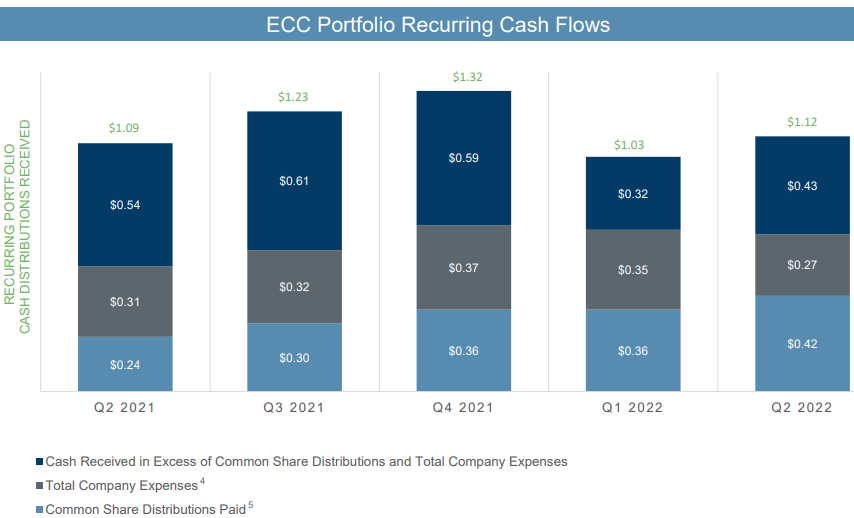
ECC has covered its dividend with cash flow after expenses by over 230% over the past year. Despite recently raising its dividend, ECC is still covering it by over 200%. To top it all off, ECC continues to have the “problem” of earning more cash than it can distribute, forcing it to pay yet another special dividend. Shareholders will receive an additional $0.25 in October.
With ECC producing so much cash flow, why did NAV fall to $10.08?
The price of loans fell dramatically in June, along with most investments. Remember, ECC’s measurement of NAV only occurs once a month and is just a snapshot of one day. In this case, June 30th, which in hindsight, was the bottom for loan prices.
S&P/ LTSA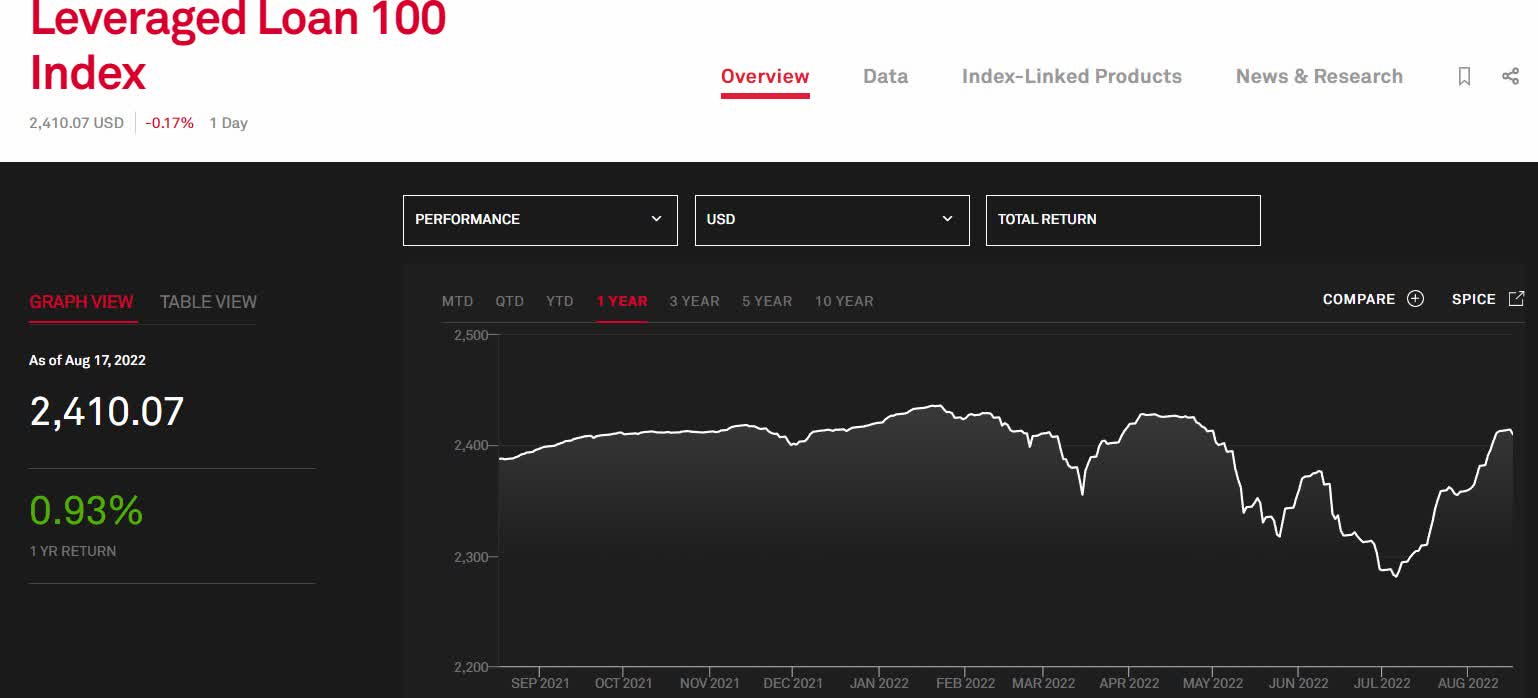
In fact, management reported that NAV was up 8% in July to approximately $10.79-$10.89 as of the end of July. It is even higher now since loans continued to rally and are now at late April levels.
We often discuss how we don’t stress much over NAV in the CLO space. After all, this is debt that is bought and held to maturity. When borrowers repay, they repay at par, not the market price of the debt. What ECC ultimately receives is dependent upon whether borrowers default or not. Management spent some time in the earnings call explaining how bad defaults would need to be for ECC to recover only $10.08 from its current portfolio:
…when loans were at $0.92 on the dollar, if you just use $0.50 recovery, which is very low for loans, that’s a very conservative number, that suggests 8 points — that would suggest the market was kind of pricing in 16% defaults over the next 2 years. You can talk to the — I am unaware of a person so bearish in the credit markets as to be predicting a 16% default rate over the next 2 years. And frankly, a lot of that sell-off was technical, not fundamental. Our default is going to go up, yes. It can’t really go any lower – we’re at 2 now, it’s hard to go much lower than that. So we will see a pickup for sure.
But the market we were in, certainly at the end of June and even where we are right now, even at 95%, assuming we got a very conservative 50% recovery, still kind of predicting a 10% default rate over the next 2 years, which with only 3% of loans trading below 80% is certainly very, very different than what the market is predicting.
In other words, ECC’s June NAV priced in the worst default rate and the worst recovery rate in the history of leveraged loans by a long shot. Far worse than the Great Financial Crisis their cash yield on NAV is 44%!
The market clearly mispriced loans, evidenced by logic and looking at how quickly loans recovered. ECC’s NAV today is likely close to $12. Remember, NAV changes every single day, just like your portfolio balance changes every day.
So while the market is obsessing over NAV and how it moves, we follow the enormous cash flows. ECC is dramatically out-earning its dividend and is paying a special dividend.
For ECC, it is all about the future default rate – which will rise since it is virtually non-existent today. Yet companies spent time during COVID dramatically improving their balance sheets. EBITDA interest coverage coming into 2022 is at all-time highs:
ECC Quarterly Update 2Q 2022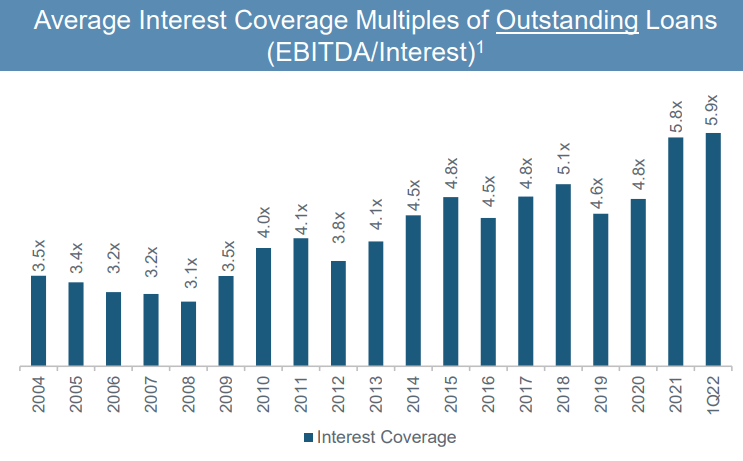
This isn’t what we would expect to see before a large spike in defaults. This is why Fitch is projecting leverage loan defaults “rise” to 1.5-2% in 2023 and could be 2% in 2024. That’s a far cry from the 10-16% that is being priced into ECC’s NAV! In fact, it is below historical averages.
ECC is pricing in a hurricane when there isn’t a cloud over the ocean. We’re happy to take advantage of this inefficiency and grab more shares at these prices.
Pick #2: PDI – Yield 12.5%
When talking about closed-end funds (“CEFs”), a common question investors have is about whether to buy at a premium or discount to NAV. Some will say “never buy a CEF at a premium.” Others will point out that CEFs that routinely trade at premiums usually have a better return than CEFs that routinely trade at discounts.
We’ve sold CEFs when they were trading at too large of a premium and swapped them into similar CEFs that were at a lower premium. One example is we sold Tekla World Healthcare (THW) in March 2021 and swapped it into Tekla Healthcare Opportunities (THQ) when the gap was over 25%.
From March 2021 until we bought THW back in April 2022, this swap resulted in higher returns.
Ycharts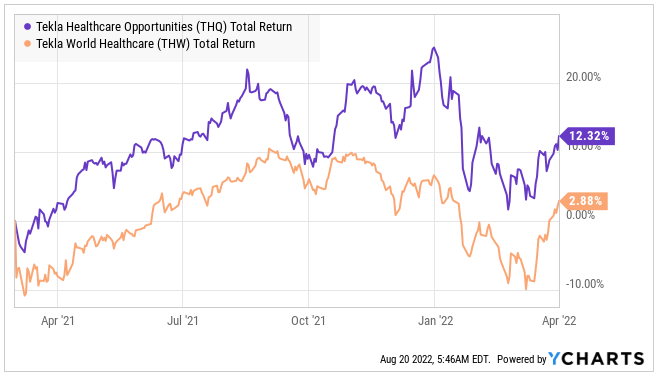
Yet, in another example, like PIMCO Dynamic Income Fund (PDI), we are very happy to buy and hold at a significant premium to NAV. As often happens in investing, inflexible “rules” are not helpful. Here are the questions you should ask before buying a CEF at a premium:
- Can I reproduce the holdings? If a fund is nothing but common stocks that you can easily buy through your brokerage, you should be less willing to pay a premium for the fund. Why pay a premium to someone else to do what you could do easily? At the end of the day, a CEF is a bundle of investments. It provides you the convenience of getting them all packaged together, and that convenience might be worth a small premium. But if the investments are easy to buy, does it justify a large premium? I don’t think so.
- What is the historical premium/discount? The historical premium/discount that the market gives a fund is far more important than the absolute premium/discount. For some CEFs, trading at a 5% discount might be “expensive.” For others, trading at a 20% premium is cheap. The current premium/discount is most meaningfully viewed through the lens of the historical premium/discount. Some funds trade at chronic premiums, others at chronic discounts, and there is usually some stability. There are usually very good reasons why they are trading at a premium or discount. I won’t say the market is always right, but you should at least make the effort to understand why the market is rewarding or penalizing a CEF.
- Is management adding something extra, or do they detract value? This usually goes hand in hand with #2, as the quality and history of management is often the greatest contributor to whether a CEF chronically trades at a premium or discount. I’m willing to pay a premium if management has a history of adding value.
- Is NAV even accurate? All CEFs are required to report NAV, regardless of what kind of assets they have. For a CEF that owns nothing but common stocks, it is straightforward. Common stocks have prices that are easily accessible and reasonably accurate. You can sell common stocks more or less at the price quoted at any given second. When CEFs own bonds, loans, CLOs, real estate, and other less liquid investments, things become less clear. Especially when they hold assets that are not publicly traded. These are referred to as “Level 2” or “Level 3” assets. With Level 2, values are estimations that are based on observable inputs. With Level 3, values are estimations that rely on unobservable inputs and subjective assumptions. In these cases, NAV could be a very different number than what the assets could be sold for. A CEF that has a lot of Level 2 or Level 3 assets will often trade at a larger premium or discount to NAV.
When we ask these questions about PDI:
- It would take substantial resources to attempt to mirror its portfolio.
- PDI has consistently traded at a premium, often over 10% and as high as 25%.
- PIMCO is one of the best bond fund managers of all time, consistently producing outperformance over the long term.
- Over 90% of PDI’s assets are “Level 2.”
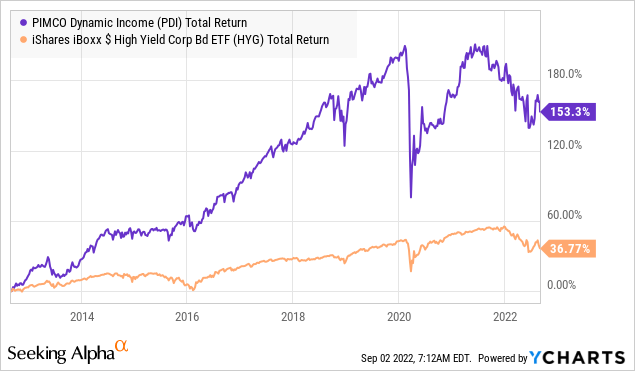
Every indicator we look at suggests that PDI should trade at a premium. When it comes to high-yield debt, PDI (along with several other PIMCO funds) runs circles around ETFs.
PDI has a double-digit yield and is significantly out-earning its dividend with $0.76 in UNII (undistributed net investment income).
UNII Report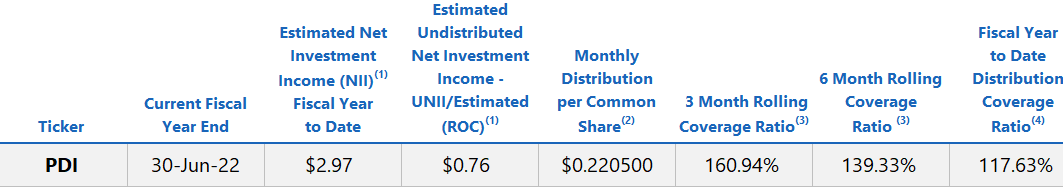
With such a high amount of UNII at the end of PIMCO’s fiscal year, PDI will likely payout a special dividend in December. The best part is that dividend coverage has steadily improved as interest rates increase. It is 160% over the past three months.
Bonds had a very rough start to 2022 – it was the worst first half for bonds in over a century. Yet one thing we know about investment prices is that they change. The best time to buy is when they are down and are starting their recovery. Bonds are on the road to recovery, and PDI is one of the best ways to be invested in that recovery.
Shutterstock
Conclusion
ECC and PDI both invest in a realm where rising rates have temporarily dropped the trading value of their investments while simultaneously enabling them to pick up investments at firesale prices.
Both have strongly covered distributions, and one has already declared a special dividend this year – they are making too much money to keep it all inside the fund!
So while others scoff, hemming and hawing at your growing income stream, you can enjoy the money they are turning down time and again. Investing in the market is a long-term proposition to fund a long and healthy retirement which we all dream about.
Today, we demanded at least 12% yields from our investments in the fixed income space and landed on two entirely covered income generators to put into one’s portfolio.
I don’t know about you, but when I can lock in high yield knowing the underlying holdings are undervalued, I fill up to my allocation limits and let it be.
Be the first to comment