

Oat_Phawat/iStock via Getty Images
Near Term Future May Not Be Pleasant for Several Securities in The Financial Markets
When the US Federal Reserve raises interest rates to lower inflation and the dollar remains strong against other currencies, not only publicly traded stocks but also safe-haven assets like gold pay the price.
Additionally, non-safe-haven commodities such as copper are still falling sharply as a recession would hurt demand for these commodities due to the hawkish stance of the US Federal Reserve
seekingalpha/symbol/SPY
Until inflation shows signs of slowing down, the Federal Reserve will keep raising interest rates, creating headwinds for gold, most US-listed stocks and other commodities like copper.
As such, investors may be more interested in trimming their positions in the above securities than trying to take advantage of lower valuations if they think bearish sentiment could make future falls even more severe.
Among the securities that investors may want to reduce, Seabridge Gold Inc. (NYSE:SA) (TSX:SEA:CA) could likely be one for the reasons outlined below.
About Seabridge Gold Inc.
Toronto-based metals mining company Seabridge Gold Inc. is engaged in the acquisition and exploration of North American gold and silver properties.
The precious metal isn’t the only reason the company is interested in the North American metals mining industry, however. Its operations also target copper, as well as molybdenum and rhenium deposits.
The company’s main mineral projects are Kerr-Sulphurets-Mitchell [KSM] property in British Columbia, Canada and Courageous Lake property in Northwest Territories, Canada.
Kerr-Sulphurets-Mitchell [KSM] property in British Columbia, Canada
KSM is a big project in terms of metal resources to develop.
An updated Pre-Feasibility Study [PFS] document released last August indicates that the site has approximately 47.3 million proven and probable ounces of gold reserves [grading approximately 0.64 grams of metal per ton of mineral] associated with 7.3 billion proven and probable pounds of copper [grading approximately 0.14%].
The PFS 2022 is the second of its kind for this multi-metallic development project, following the PFS 2016.
In the meantime, the project has progressed by targeting an open pit resource called East Mitchell and expanding the throughput processing capacity of the mill facility. The project for the future gold/copper mine also includes the Mitchell and Sulfurets ore deposits. In addition, projects and technologies have increased the efficiency of the future mine while reducing the environmental impact profile. Technicians have improved the waste-to-strip ratio, electrified some of the mining transport fleets and eliminated the need for some very expensive mining techniques.
In other words, the project has been re-imagined and now appears to be less vulnerable to the volatility in the fossil fuel and energy markets and higher borrowing costs that the current situation of runaway inflation requires to restore price stability and ensure the highest possible level of employment.
This Is What KSM Mining Activities Will Look Like
According to the 2022 PFS, which is an evolution of the prior 2022 Preliminary Economic Assessment [PEA], KSM will mine ore for the production of precious and base metals using more than 30 years of open-pit mining techniques.
During this period, the mine is expected to produce 1.03 million ounces of gold and 178 million pounds of copper in addition to 3 million ounces of silver and 4.2 million pounds of molybdenum.
Estimated mining costs [per ounce of gold produced] are as follows: net operating costs of $275 and total net costs of $601 per ounce.
Each day, more than 190,000 tons of mining material will be unloaded at the plant to recover gold, copper, and silver in concentrate for shipment by sea to smelters in the Pacific Rim via the port of Stewart, British Columbia.
According to metallurgical projections, the multi-metal asset KSM will provide salable gold-silver grade copper concentrate and produce molybdenum concentrate too, other than gold-silver in doré bars.
The Assessment of The KSM Project: This Is Where the Doubts Lie
As for the economic analysis of the project, the base case of the 2022 PFS, which is based on a gold price of $1,742 per ounce and a copper price of $3.53 per pound, provides a payback of 3.7 years, an internal rate of return [IRR] of 16.1% and net present value [NPV] of $7.9 billion.
These metrics give an idea of how much the KSM complex could be worth.
The IRR is low because investors usually consider a project profitable for which the IRR is at least 25-30%.
In addition, base prices of $1,742 per ounce of gold and $3.53 per pound of copper are high compared to their respective 10-year value averages [see the two charts below], which could lead to an overestimation of future mining activity at KSM.
The chart below of tradingeconomics.com indicates a mean gold price of around $1,450 per ounce.
tradingeconomics/commodity/gold
The chart below of tradingeconomics.com indicates a mean copper price of around $3.10 per pound.
tradingeconomics/commodity/copper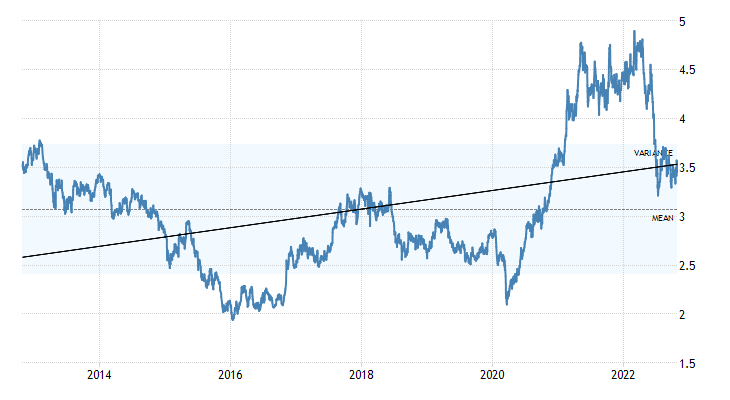
For gold, the price used by the 2022 PFS is 20% above the average gold futures contracts price over the past 10 years. This margin does not carry significant investment risk just from a purely mathematical point of view. If recent years suggest that the global economic environment may remain highly unpredictable, the probability of error in determining future price targets for gold and other securities may be greater than assumed.
Therefore, the NPV of the KSM project may significantly underestimate the risk of the investment when its determination is based on gold prices that are much higher than historical averages. This is a problem for retail investors as they seek recognition for a reward that adequately compensates for risk.
The 10-year average gold and copper prices in the charts above would make the NPV estimate more reliable as they appear to be unbiased by pricing in many falls and rises in the commodity market over the past 10 years. That is, as a basis for evaluating KSM, the historical prices could contribute to a more accurate assessment of the project value. Because they include both bear markets and bull markets, they better summarize the characteristics of the volatile gold market.
The alternative case of the 2022 PFS, which instead references gold at $1,500 and copper at $3 per pound, offers perhaps a more likely estimate of the KSM project’s NPV, which at a 5% discount rate is $5.2 billion with an IRR of 13.1% and a payback period of 4.3 years.
But the even lower IRR coupled with the risk of delaying the start of mining operations due to falling metal prices makes KSM’s future metal production project much less attractive than the PFS suggests.
Courageous Lake property in Northwest Territories, Canada
Seabridge Gold Inc.’s mineral properties include the Courageous Lake property in the Northwest Territories of Canada.
Courageous Lake is listed as one of the largest gold development projects in inland Canada.
The project’s PFS was published in July 2012, so it is an outdated document.
The document indicates the presence of approximately 6.5 million ounces of proven and probable gold reserves in a single open field deposit at an average grade of 2.20 grams per tonne of ore.
This Is What Courageous Lake Mining Activities Will Look Like
According to PFS, the mine will be capable of producing 385,000 ounces of gold per year over 15 years of operation at a cash operating cost of $780 per ounce. In addition, the project demonstrates excellent exploration potential that Seabridge intends to exploit over 54 km in the gold belt.
Seabridge Gold Inc. may elect to operate Courageous Lake in a joint venture with other leading gold miners or to sell the mineral asset to an experienced gold property developer.
The Valuation of Courageous Lake’s Mining Activities Dates Back Many Years Ago and Implies a Very Small IRR
The economic analysis describes three different cases, but the base case with the assumed gold price of $1,380 per ounce seems to be a more realistic estimate as it is closer to the historical average gold price, but the study is outdated.
From a conservative perspective, Courageous Lake has a net present value of $303 million calculated at a 5% discount, a very low IRR of 7.3%, and a long payback period of 11.2 years.
It may be years before this asset can start producing gold. In the meantime, Seabridge is working to increase the project’s economic return while reducing its environmental impact.
The Stock Price Is Low Compared to Recent History, But Not Cheap
The stock was trading at $10.85 per share as of this writing for a market cap of $922.56 million and a 52-week range of $10.35 to $22.22.
seekingalpha/symbol/SA?s=sa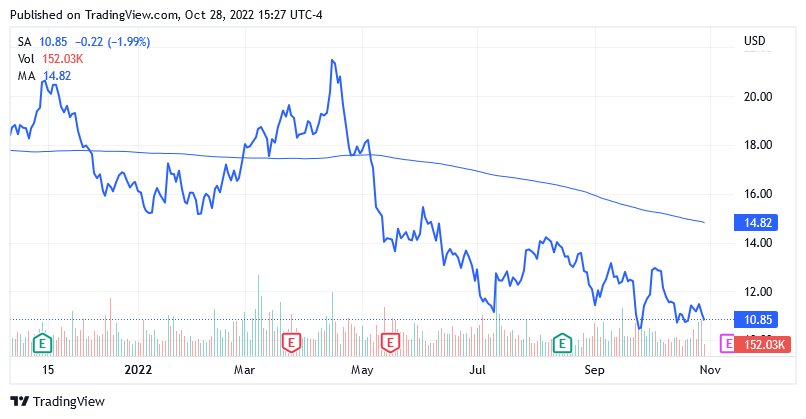
The share price is trading below the middle point of $16.285 of the 52-week range and below the long-term trend of the 200-day simple moving average of $14.82. However, that doesn’t mean the stock is cheap and therefore a buy.
News that the company has started gold production would bode well for the stock price in the midst of a gold bull market, but both of those things are slow to pick up at the moment.
The economic uncertainty could affect the company’s planning and delay the start of production, in addition to doubts about the feasibility of the projects at the current and likely next price levels.
The other factor that would underpin a buying approach isn’t there right now and likely won’t be for the next few months as economists forecast steady declines in gold and copper.
In 52 weeks, copper is expected to fall another 7% to a price of $3.23 a pound, while gold is expected to fluctuate at $1,582.28 an ounce, further down by almost 4% from current levels.
Given the foregoing, investors who decide to ditch some of Seabridge Gold Inc.’s shares from their portfolio and reallocate reclaimed monies to other industries are not wrong.
On the Toronto Stock Exchange, Seabridge Gold Inc. (SEA:CA) was trading at Canadian Dollars [CA$] of 14.83 per share giving a market capitalization of CA$1.25 billion and a 52-week range of CA$14.25 to CA$28. The stock price is trading below the long-term trend of the 200-day simple moving average of CA$19.13.
What Could Cause the Stock Price to Go Up
Certainly, the price of gold is the main factor that could drive Seabridge Gold’s share price higher in the market. A higher gold price would make mining project estimates more reliable.
In addition, in a supportive gold price environment and prices consistent with the PFS, it would be easier to fund the projects with debt or corporate loans, avoiding the issuance of common stock that would dilute the NPV per share.
However, for the price of gold to rise, the US Federal Reserve must return to an accommodative interest rate policy. That will require the economy to slow down and respond to the recessionary signals the US Federal Reserve continues to send with the highest interest rates, hoping to halt rising prices for goods and services.
But the expected feedback from the economy is not coming. The US gross domestic product [GDP] grew in the third quarter instead of scaling back. After contracting for two consecutive quarters, US GDP rose 2.6% in the third quarter, 20 basis points above analyst expectations.
Therefore, an accommodative monetary policy, which is good for gold prices, is further away.
Wall Street’s Target Price and Recommendation Rating
The stock has an average price target of $45.25 while recommendation ratings are 3 Strong Buys and one Buy rating.
Analysts’ Recommendation Ratings:
seekingalpha/symbol/SA/ratings/sell-side-ratings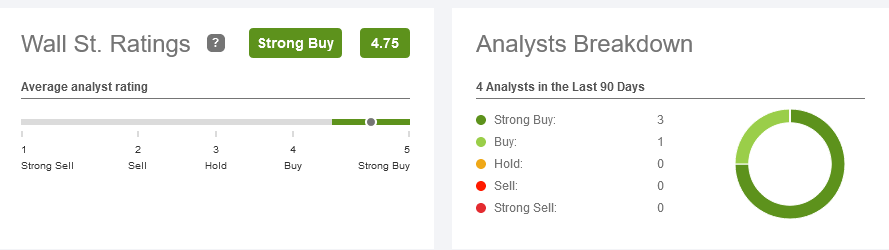
Analysts’ Average Price Target:
seekingalpha/symbol/SA/ratings/sell-side-ratings
Conclusion – This Stock Is Not Attractive Due to A Falling Gold Price
Initial metal production would bode well for the stock price in free fall since April but has not materialized yet.
The main project is based on metal prices that are very far from historical averages, making the valuation quite questionable.
At least a gold bull market would help restore confidence in this gold explorer but again that is not the case at the moment.
Due to the expected development of the macroeconomic framework, the metals could fall further and continue to affect the share price.
Investors who may decide to ease their holdings are not to blame.
Be the first to comment