

trendobjects/iStock via Getty Images
The ProShares UltraShort S&P 500 ETF (NYSEARCA:SDS) is one of the most popular instruments to short the broad market for trading or hedging purposes. However, its daily -2X leverage factor is a source of drift. It must be closely monitored to detect changes in the drift regime. This article explains what “drift” means, quantifies it in more than 20 leveraged ETFs, shows historical data, and finally concludes about the current market conditions.
Why do leveraged ETFs drift?
Leveraged ETFs often underperform their underlying index leveraged by the same factor. The decay has essentially four reasons: beta-slippage, roll yield, tracking errors, management costs. Beta-slippage is the main reason in equity leveraged ETFs. However, when an asset is in a steady trend, leveraged ETFs can bring an excess return instead of a decay. You can follow this link to learn more about this.
Monthly and yearly drift watchlist
There is no standard or universally recognized definition for the drift of a leveraged ETF. Some are quite complicated. Mine is simple and based on the difference between the leveraged ETF performance and Ñ times the performance of the underlying index on a given time interval, if Ñ is the leveraging factor. Most of the time, this factor defines a daily objective relative to an underlying index. However, some dividend-oriented leveraged products have been defined with a monthly objective (mostly defunct ETNs sponsored by Credit Suisse and UBS: CEFL, BDCL, SDYL, MLPQ, MORL…).
First, let’s start by defining “Return”: it is the return of a leveraged ETF in a given time interval, including dividends. “IndexReturn” is the return of a non-leveraged ETF on the same underlying asset in the same time interval, including dividends. “Abs” is the absolute value operator. My “Drift” is the drift of a leveraged ETF normalized to the underlying index exposure in a time interval. It is calculated as follows:
Drift = (Return – (IndexReturn x Ñ))/ Abs(Ñ)
“Decay” means negative drift. “Month” stands for 21 trading days, “year” for 252 trading days. A drift is a difference between 2 returns, so it may go below -100%.
|
Index |
Ñ |
Ticker |
1-month Return |
1-month Drift |
1-year Return |
1-year Drift |
|
S&P 500 |
1 |
-5.76% |
0.00% |
-18.38% |
0.00% |
|
|
2 |
-11.84% |
-0.16% |
-39.34% |
-1.29% |
||
|
-2 |
12.79% |
0.64% |
31.43% |
-2.67% |
||
|
3 |
-17.73% |
-0.15% |
-57.19% |
-0.68% |
||
|
-3 |
19.28% |
0.67% |
37.38% |
-5.92% |
||
|
ICE US20+ Tbond |
1 |
-2.62% |
0.00% |
-31.10% |
0.00% |
|
|
3 |
-9.35% |
-0.50% |
-72.54% |
6.92% |
||
|
-3 |
6.48% |
-0.46% |
149.01% |
18.57% |
||
|
NASDAQ 100 |
1 |
-9.01% |
0.00% |
-33.00% |
0.00% |
|
|
3 |
-26.19% |
0.28% |
-79.48% |
6.51% |
||
|
-3 |
30.92% |
1.30% |
86.48% |
-4.17% |
||
|
DJ 30 |
1 |
-4.07% |
0.00% |
-7.28% |
0.00% |
|
|
3 |
-13.04% |
-0.28% |
-32.76% |
-3.64% |
||
|
-3 |
13.37% |
0.39% |
4.44% |
-5.80% |
||
|
Russell 2000 |
1 |
-6.51% |
0.00% |
-20.66% |
0.00% |
|
|
3 |
-19.97% |
-0.15% |
-62.65% |
-0.22% |
||
|
-3 |
21.25% |
0.57% |
30.84% |
-10.38% |
||
|
MSCI Emerging |
1 |
-2.64% |
0.00% |
-20.95% |
0.00% |
|
|
3 |
-9.54% |
-0.54% |
-60.77% |
0.69% |
||
|
-3 |
8.11% |
0.06% |
51.81% |
-3.68% |
||
|
Gold spot |
1 |
2.93% |
0.00% |
-0.09% |
0.00% |
|
|
2 |
5.02% |
-0.42% |
-6.31% |
-3.07% |
||
|
-2 |
-5.52% |
0.17% |
-3.49% |
-1.84% |
||
|
Silver spot |
1 |
7.78% |
0.00% |
3.19% |
0.00% |
|
|
2 |
15.19% |
-0.18% |
-6.19% |
-6.29% |
||
|
-2 |
-16.45% |
-0.45% |
-29.48% |
-11.55% |
||
|
S&P Biotech Select |
1 |
-0.74% |
0.00% |
-26.70% |
0.00% |
|
|
3 |
-5.86% |
-1.21% |
-81.06% |
-0.32% |
||
|
-3 |
-2.92% |
-1.71% |
-30.41% |
-36.84% |
||
|
PHLX Semicond. |
1 |
-10.07% |
0.00% |
-35.28% |
0.00% |
|
|
3 |
-29.78% |
0.14% |
-85.74% |
6.70% |
||
|
-3 |
31.92% |
0.57% |
15.76% |
-30.03% |
The best and worst drifts
- The leveraged biotechnology ETFs, bear (LABD) and bull (LABU), have the worst monthly decays on this list with drifts of -1.71% and -1.21%.
- LABD also has the worst 1-year decay at -36.84%, followed by the leveraged bear semiconductors ETF (SOXS) at -30.03%.
- The leveraged bear Nasdaq 100 ETF (SQQQ) shows the highest positive drift in one month: +1.30%.
- In 12 months, the largest positive drift is for the leveraged bear T-bond ETF (TMV) with +18.57%.
Positive drift follows a steady trend in the underlying asset, whatever the trend direction and the ETF direction. It means positive drift may come with a gain or a loss for the ETF. Negative drift comes with daily return volatility (“whipsaw”).
SDS drift history
Since its inception on 7/11/2006, SDS has lost 99% of its value, through a number of reverse splits. However, hedging with SDS has worked quite well in many cases. For example, in the first week of the 2020 market meltdown (2/21 to 2/28/2020), it gained over 25%, significantly more than SPY’s return (-11%) multiplied by the leveraging ratio (-2). Then, I issued a warning on 3/10/2020 against leveraged equity ETFs. In the following weeks, SDS suffered a steep decay. Later, the monthly drift oscillated between positive and negative values, and the 12-month drift was negative until February 2021. It jumped back in positive territory, spiked in April 2021 and fell below zero again in March 2022. The next chart plots the 12-month drift since January 2000, using real prices from July 2006, and synthetic prices based on the underlying index before that. The historical average is close to zero, which is better than -3.1% for the -3x ETFs SPXS and SPXU.
12-month drift of SDS (synthetic before July 2006). (chart: author; data: Portfolio123) 12-month drift of SPXS (synthetic before November 2008). (chart: author; data: Portfolio123)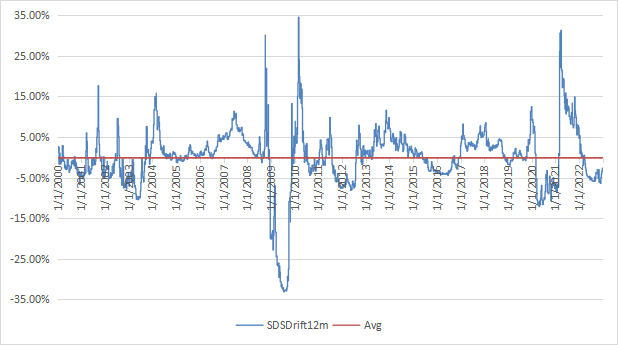
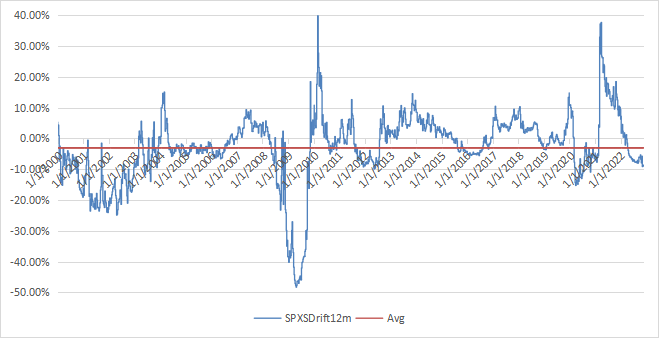
SDS is an efficient hedging instrument against sharp corrections in a bull market. The cost of hedging is quite cheap compared with other derivatives, and the drift history is less scary than for -3x ETFs. However, it suffers a significant decay when the S&P 500 has alternatively positive and negative daily returns. The VIX index (implied volatility) is not directly related to decay, but it may be a warning. Moreover, keep in mind that shorting an asset or buying an inverse ETF implies an additional decay due to inflation and magnified by the leveraging factor. It was not a concern until 2020, but now it is a serious one.
Even if SDS is less tricky than SPXU or SPXS, it has been designed for seasoned investors with a good understanding of their behavior behind the advertised leveraging factor.
Be the first to comment