

JHVEPhoto
Introduction
Canadian banks have long been perceived as stable businesses, where little volatility was to be expected. This was well demonstrated during the financial crisis of 2008, when Canadian banks experienced only a small decline in earnings, quickly followed by a recovery. They are banks that have had largely constant earnings growth and tend to be valued close to intrinsic valuation. They are however also banks that again appear to have fallen below fair valuation, and some that investors should consider.
Bank of Nova Scotia (NYSE:BNS) is a multinational Canadian bank. It is one of the Big Five Banks in Canada, currently number 4 based on market capitalization. The bank serves more than 25 million customers by offering a wide range of services and products including corporate investment, wealth management and commercial banking. It is traded on the Toronto and New York Stock Exchanges.
Capital Allocation
Although the earnings per share has been stable over the previous 2 decades, earnings growth has still been below of what one would have expected in 2012. The rate at which the company has been able to reinvest earnings has declined after its 2013 peak of ~17% ROE, following the decline of the Canadian dollar.
The shift to a lower return on equity is the reason why annual single-digit growth has been the norm in recent years. However, return on equity now appears to have stabilized at ~12%, which is in line with what similar banks in Canada are doing. As the currencies appear to have stabilized, forward estimates are more likely to be more accurate.
Macrotrends.com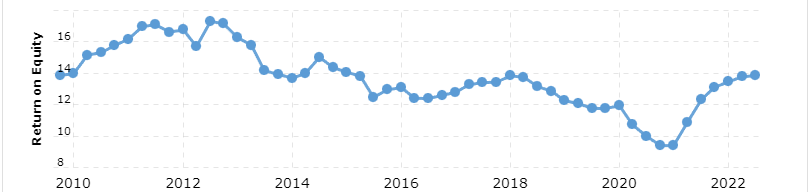
Unlike many of the big US banks, BNS still reinvests earnings to build equity. The company has never carried out any meaningful share buybacks, but has in recent years begun to buy back a smaller proportion of shares, with hopefully more to come.
Since the company maintains a dividend payout ratio of ~50%, and that the return on equity from 2015-2022 has averaged ~12%, earnings should have grown by ~6% per year, which has been true.
Including the years that saw a decline in ROE would only show half the annual growth. A good example of why forward estimates should be conservative. A falling return on equity is detrimental to future growth prospects. In this case, it was not the fault of the company, but simply a result of the volatility of the currencies.
Macrotrends.com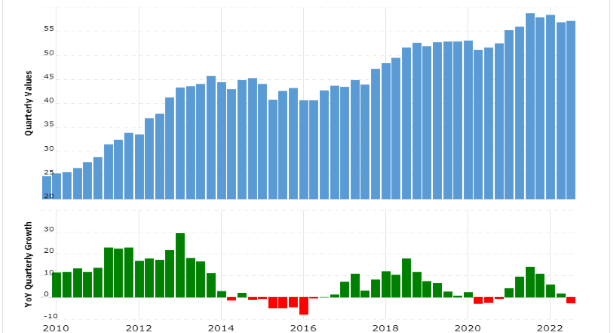
The stock currently yields ~6.2% with a manageable payout ratio of 50%. This payout ratio has been held for the past +20 years, so it seems reasonable to expect it to continue. Although return on equity has been declining since its peak in 2013, I think it’s fair to assume, the company can manage ~12% ROE going forward. This is based on their past 7 years of reinvestment capability, combined with 12% being within the normal range for large Canadian banks.
Given that the company is currently valued close to book value and that 50% of earnings are paid out in dividends, I estimate that going forward, annual growth will average ~6%. This assumes that the 12% ROE and 50% dividend payout ratio is maintained, and that all earnings after dividend payments are used to build new equity.
I wouldn’t mind if the company started buying back shares in larger quantities instead of building equity, as the two would provide roughly the same value to investors, plus it’s arguably easier to just buy back shares instead of reinvesting earnings.
Valuation
As seen in the image below, which uses financial data in USD, BNS has shown a stable record of constant growth. The company has averaged ~6.5% annual growth, which is in line with my expectations.
The fall in ROE due to currency fluctuations can be seen in the growth after 2013, when earnings per share declined.
Currency fluctuations are almost impossible to account for, and only reinforce the importance of buying below intrinsic valuation.
The company is currently trading -40% below its average earnings multiple. Should it return to such a multiple, an immediate return of ~61% would be seen. While waiting for that to happen, a yield of ~6.2% + intrinsic growth of ~6% is certainly welcome.
Fastgraphs.com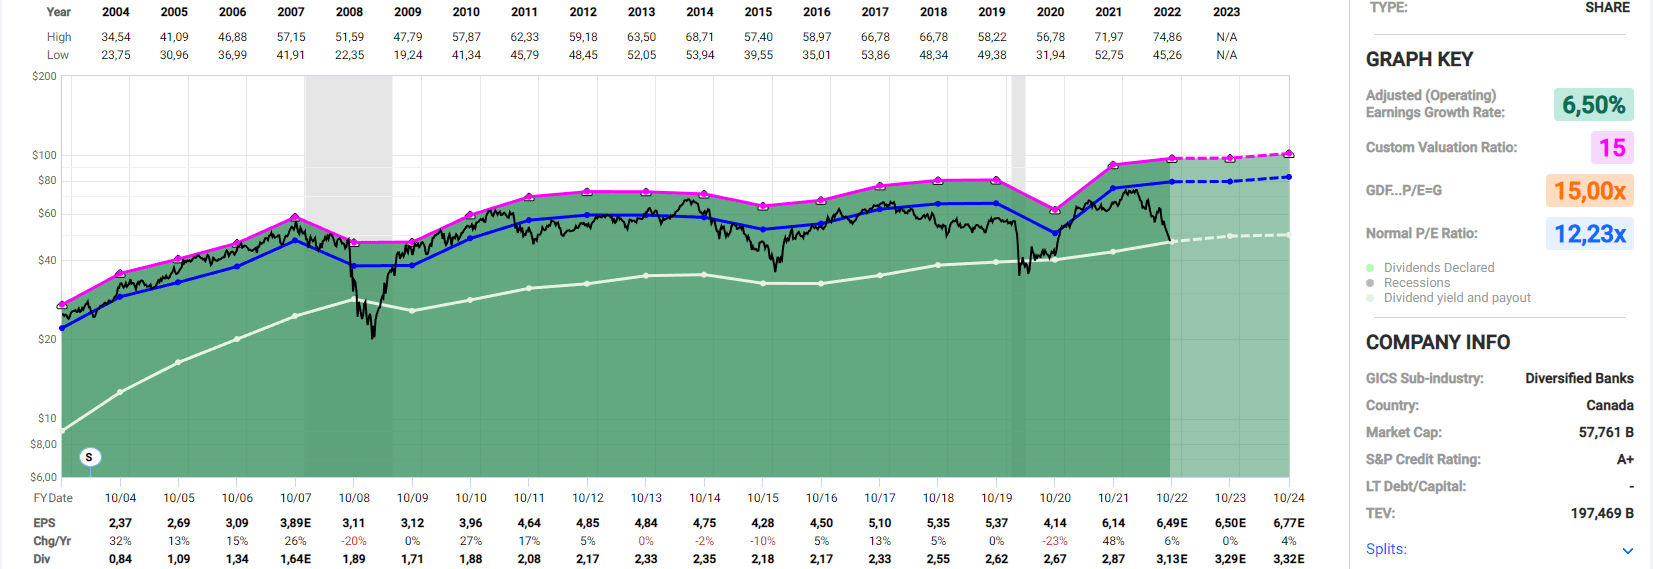
Stock Chart
Quick disclaimer. A technical analysis in itself is not a good enough reason to buy a stock but combined with the company’s fundamentals, it can greatly narrow your price target range when you buy.
As with most consistently growing companies, the 50-day moving average has been a decent guide to when to potentially buy. I would consider the stock interesting when the share price goes below this moving average, but only if it is supported by earnings. This has been true several times in the past, and will likely be this time again.
The 200-day moving average is typically only touched during market crashes, which again has been the case in the past. Given the current market situation, I wouldn’t consider it impossible to happen again. If so, I think the stock would be extremely attractive.
Regardless of whether it should continue to fall, current valuations are well below average. What is important to recognize, is that the low valuations are supported by strong earnings with good future prospects.
Based on the stock chart, the stock appears to be undervalued by at least ~13%.
Tradingview.com
Final Thoughts
Canadian banks have long been thought of as stable investments. This has certainly been true in the past and will likely be true in the future. The company, excluding the large currency fluctuations near 2013, has averaged ~12% ROE. With half of the earnings paid out in dividends, and with the rest reinvested in the business, annual growth of ~6% can conservatively be expected. This gives investors an estimated ~12% return on invested capital.
The next step is to avoid paying too much for the company. The company appears attractively valued based on earnings with a p/e well below average. The stock also appears cheap based on the stock chart, as it is very close to the 200-day moving average.
I would consider anything below the 50-day moving average a good accumulation area, and should we get an opportunity to buy below the 200-day moving average, an excellent area to buy.
Be the first to comment