

Rawf8/iStock via Getty Images
Article Purpose
In 2022, 23 Seeking Alpha authors wrote 35 articles analyzing the Schwab U.S. Dividend Equity ETF (NYSEARCA:SCHD), providing an average rating of 3.66/5. I’ve written two bullish articles this year and often refer to it as a solid benchmark in my other dividend ETF articles. However, you may be getting a bit tired of hearing the same old recycled statements like:
- SCHD has beaten SPY with less volatility over the last ten years.
- SCHD’s dividend yield and growth are unmatched.
- SCHD’s solid cash-focused screens ensure dividend consistency.
“All true,” you might respond. “But stop talking about what SCHD has already done and start convincing me why it will continue.” I agree, and I’m fully aware of how enthusiastic investors and analysts are and how that leads to skepticism. That’s why today, I want to take a critical look at how SCHD compares its 100 ETF peers on ten key factors and 32 sub-factors. I’ll let the data do the talking, and depending on what features you value most, it should help clarify if SCHD belongs in your portfolio.
Creating The ETF Universe
Before we get started, I want to state the criteria I used when deciding which ETFs were peers of SCHD. These are important because an analysis of 850+ ETFs would likely become bloated and less meaningful. Selected ETFs must:
- have a minimum of $200 million in assets under management
- be broad-based and not focused on a specific sector
- invest primarily in U.S. equities
- not use risk-management strategies like covered call writing
- be passively managed
- be classified as dividend-focused or have a current yield above 1.75%
These screens leave us with 102 ETFs. I decided to eliminate two that seem least likely to be considered an alternative to SCHD, as follows:
My analysis is lengthy, but I’ve divided it into ten sections to help you find your way around easier:
- ETF Basics (AUM, Volume, Fees, Market Capitalization)
- Diversification (Assets In Top 25 Companies & Industries, Sector Variances)
- Market Volatility (2Y Beta, 5Y Beta)
- Dividends (Historical and Estimated Yield, Growth)
- Growth (Sales, EBITDA, Earnings Per Share)
- Valuation (Price-Earnings, Price-Sales, Price-Cash Flow, Price-Book)
- Profitability (ROE, ROA, ROTC, Cash To Total Debt, EBITDA Margin)
- Price Momentum (Price vs. 50D SMA, 100D SMA, and 200D SMA)
- Market Sentiment (Sales Surprises, Earnings Surprises, EPS Revisions)
- Risk-Adjusted Returns (3Y, 5Y, 10Y)
These factors are based primarily on SCHD’s current holdings rather than historical metrics. In short, it’s a straightforward portfolio analysis. It’s the type of analysis I would do if someone gave me a listing of all the stocks in their portfolio but never bothered to tell me it was all lumped together in a basket known as SCHD.
ETF Basics
Assets Under Management
SCHD has $42.7 billion in assets under management, good enough for fifth place. The four larger ETFs are:
- Vanguard Value ETF (VTV): $103.13 billion
- Vanguard Dividend Appreciation ETF (VIG): $64.69 billion
- iShares Russell 1000 Value ETF (IWD): $54.16 billion
- Vanguard High Dividend Yield ETF (VYM): $50.49 billion
Investing in an ETF with high assets under management is beneficial. It means the fund is well-established and implies that fund managers correctly executed the strategy in the past. In addition, established ETFs have a lot of outstanding shares, which is a crucial consideration for dividend investors. With newer offerings, distributions may become diluted if there’s a spike (percentage-wise) in the shares outstanding just before the ex-dividend date. For SCHD and the ETFs listed above, you’ll unlikely see outstanding shares increase by 10-15% in just a few weeks. Therefore, investors should receive the dividends they expect, roughly the gross yield on the underlying holdings minus fund expenses like management fees.
Since SCHD scored fifth best on this metric, it gets a score of 95/100. I’ll use this format throughout, and at the end, I’ll suggest a way to compile all the scores together.
Volume
Volume is the number of shares that trade each day. Illiquid securities have little trading volume, so investors may have difficulty offloading any shares at a fair price. According to the ETF Database, SCHD has had an average of 3.23 million shares traded daily over the last three months. That’s best-in-class and earns it a perfect 100/100 score. Other high-volume ETFs include:
- Vanguard Value ETF (VTV)
- SPDR S&P 500 Value ETF (SPYV)
- Invesco S&P 500 Equal Weight ETF (RSP)
- Invesco S&P 500 Low Volatility ETF (SPLV)
While this metric helps assess liquidity, readers should remember that ETFs work differently. Through the process of creation and redemption, market makers can efficiently exchange the basket of stocks at a price close to fair value. This secondary level of liquidity is crucial, and the best way to measure it is to look at the liquidity of the underlying holdings. Generally, that liquidity is high with large-cap stocks, but you might run into some difficulty with some small-cap ETFs. When in doubt, ETF providers often publish the 30-day median bid-ask spread on their fund page. In SCHD’s case, it’s minimal at 0.01%.
Schwab
Fees
While the bid-ask spread is one cost of trading, it’s likely nothing compared to the ETF’s expense ratio, expressed as a percentage of a fund’s total operating expenses (including the management fee) divided by the average value of the fund’s assets. Investors should keep fees to a minimum because, like dividends, they compound over time. I designed this chart to show the impact an expense ratio has on the gains you get to keep depending on your time horizon. SCHD’s 0.06% expense ratio means about 1.27% of your fees will be lost to fees over 20 years, assuming a 10% average annual return. However, the First Trust SMID Cap Rising Dividend Achievers ETF (SDVY) and its 0.60% expense ratio will lose 12.17% of your gains to fees over 20 years.
The Sunday Investor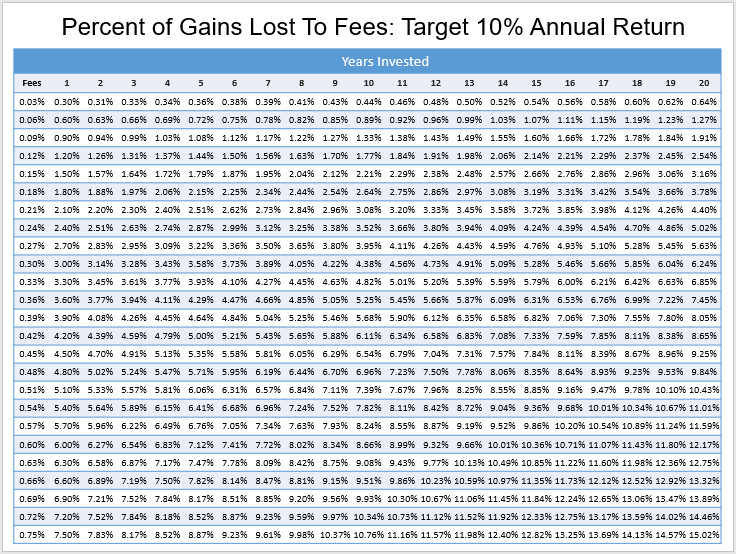
It’s not hard to imagine a scenario 20 years later when you’re sitting on a significant capital gain on a high-fee product. You know you should get out but want to avoid the tax bill. In that case, you can try to manage it by selling a portion each year alongside some capital losses in your account. However, it’s best to avoid this altogether. For those wanting to play around with the numbers, I recommend this calculator, which uses the same math.
Now, back to SCHD. Its 0.06% expense ratio is tied with four others for 7th-best, so I’ll give it a score of 93/100 to avoid additional complexity with tiebreaking rules. There are five ETFs with a 0.04% expense ratio: VTV, SPYV, IUSV, SCHV, and ILCV. The iShares Core Dividend ETF (DIVB), previously the iShares U.S. Dividend and Buyback ETF, saw its expense ratio slashed to 0.05% from 0.25% last month. You may view SCHD’s expenses as being 50% more than VTV’s, for example. However, the table above confirms the impact will likely be minimal. When fees are this low, it’s best to focus on the quality of the portfolio and strategy rather than quibble about a few basis points.
Market Capitalization
I won’t include an ETF’s weighted-average market capitalization in the rankings because large-cap ETFs aren’t always better than small-cap ETFs. However, I still want to provide it for informational purposes. SCHD’s weighted-average market capitalization is $126.10 billion, good enough for the 43rd largest. At the top of the list is the Principal U.S. Mega Cap Multi-Factor ETF (USMC) and the Fidelity Value Factor ETF (FVAL), an indication that stocks like Apple (AAPL), Microsoft (MSFT), and Alphabet (GOOGL, GOOG), are prominent. If you want to avoid those mega-caps but stick with a large-cap fund, SCHD works, as do most broad-based value ETFs like IWD and SCHV, which are around $150 billion. Overall, SCHD gets a 96/100 score in the ETF Basics category, calculated by averaging the three factors.
The Sunday Investor
Diversification
Knowing an ETF’s diversification can make the difference between calling it a “core holding” in your portfolio or just one of several tactical ETFs. Most investors rely on the percentage of assets in the top 10 or 25 holdings as a gauge, but that’s insufficient. To illustrate, if an ETF held 100 stocks in equal weight but had 50% of the portfolio dedicated to one sector, I don’t think anyone would call it a well-diversified fund just because 10% of assets were in the top 10. Instead, let’s measure diversification in three ways:
- percentage of assets in the top 25 holdings
- percentage of assets in the top 25 industries
- the sum of the absolute differences by sector
I’ll get to how that last one works soon, but let’s stick to the easier ones first.
Percentage of Assets In The Top 25 Holdings
SCHD is a concentrated ETF with 75.81% of assets in its top 25 holdings, making it the 5th least-concentrated fund in our sample. That’s a red flag and suggests you shouldn’t make SCHD your only equity holding. This problem goes away as you add more securities to your portfolio, but those wanting a single-fund solution might want to look elsewhere. Score: 5/100.
Percentage of Assets In The Top 25 Industries
This is my go-to metric for assessing diversification because it accounts for the fact that stocks in the same industry often correlate well. It’s a fair compromise between looking at company- and sector-level diversification, but unfortunately, you won’t find it on most websites.
SCHD has 91.30% of its holdings in the top 25 industries, good enough for a score of 15/100. It’s a bit better, but more is needed to change my suggestion that you own some additional securities to improve diversification.
Sum of Absolute Variances By Sector
This last one is something I made up myself and, therefore, won’t be available elsewhere. On the basis that a perfectly diversified fund will have precisely 9.09% weighting per sector (9.09% x 11 sectors = 100%), we can measure an ETF’s diversification by adding up all the absolute value variances for each sector. For example, SCHD has a 21.32% allocation to the Technology sector or 12.23% more than an equal-weight-by-sector fund. It also has a 0.33% allocation to Utilities or an 8.76% underweighting. The process continues for each sector, and the ETFs with the highest total values are deemed to be the least diversified.
SCHD’s figure was 68.15%, the 23rd highest score, meaning its ranking on this metric is only 23/100. The Energy-heavy Alpha Architect U.S. Quantitative Value ETF (QVAL) was ranked the least diversified (112.66%), while the Invesco Russell 1000 Equal Weight ETF (EQAL) was the most diversified (14.52%). Overall, SCHD scores 14.33/100 on diversification, which I consider very poor. The individual factors are summarized below.
The Sunday Investor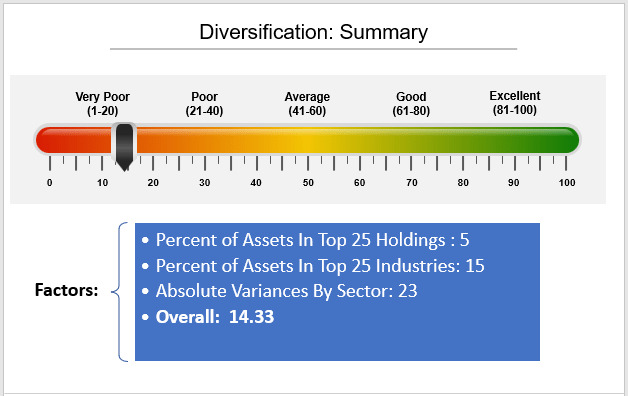
Market Volatility
A standard way to measure market volatility is to evaluate an ETF’s beta. Seeking Alpha provides two- and five-year beta figures for each fund, but they have the potential to mislead you. Due to portfolio turnover, which can be considerable with concentrated rules-based ETFs like SCHD, a fund’s historical volatility may differ from its current portfolio. For this reason, I always calculate beta based on current holdings. A portfolio’s beta is merely the weighted-average beta of its underlying holdings.
Like market capitalization, there isn’t necessarily a right or wrong answer. However, I assume that dividend investors are primarily conservative and prefer a lower beta, so my rankings reflect that.
SCHD’s two-year beta is 0.76, lower than 78 others in the sample. Its five-year beta is much higher at 0.90 but still better than 72 others. These are good scores for an ETF that doesn’t explicitly seek out low-volatile securities. For reference, the two least-volatile ETFs based on their five-year betas are the Invesco S&P 500 Low Volatility ETF (SPLV) and the Legg Mason Low Volatility High Dividend ETF (LVHD). On the other end, QVAL has a 1.51 five-year beta due to its many Energy holdings, while the Pacer U.S. Small-Cap Cash Cows ETF (CALF) is at 1.40. CALF has a market capitalization of just $2.33 billion, and as a rule of thumb, it’s safe to assume that volatility and size are inversely correlated. Overall, SCHD scores well on diversification with an average score of 75/100, as summarized below.
The Sunday Investor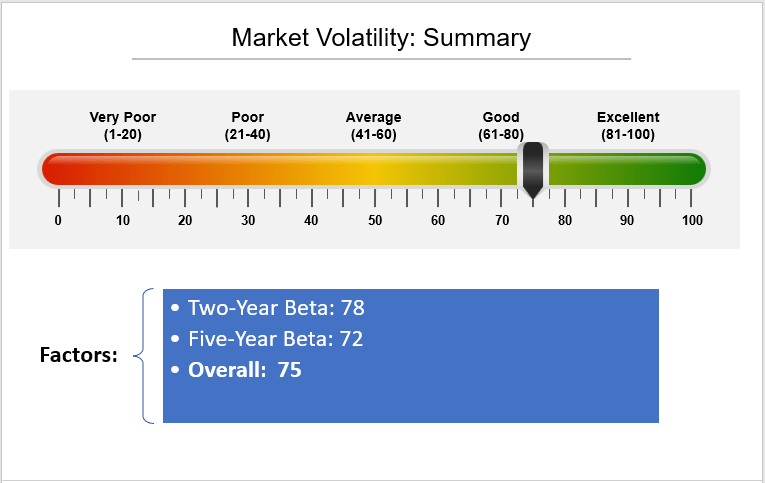
Dividends
I will measure how well SCHD scores on dividends in four ways:
- Current Trailing Dividend Yield
- Current Five-Year Dividend Growth Rate
- Estimated Dividend Yield Based On Current Holdings
- Five-Year Dividend Growth Rate Based On Current Holdings
As mentioned, a high portfolio turnover rate can result in a fund that no longer meets your expectations. While I will rely on Seeking Alpha’s data for items #1 and #2, I’ll calculate yield and growth as weighted-average metrics based on the current holdings for items #3 and #4.
SCHD’s trailing dividend yield is 3.17%, better than 86 others, thus earning it a score of 86/100. Its 12.10% five-year dividend growth rate was 15th best, earning it a score of 85/100. That’s a conservative number, too, as some of the growth rates listed for some ETFs look strange (FLQL, JPUS, PSC).
To estimate the current dividend yield, I calculated the weighted-average dividend yield for each ETF and subtracted the expense ratio. Other factors can impact net distributions, but it’s a good approximation. Under this method, SCHD’s forward dividend yield is 3.32%, the 15th best, earning it a score of 85/100. Finally, I’ve estimated its five-year dividend growth rate based on current holdings to be 11.89%, earning it a score of 94/100. Overall, SCHD looks like an excellent dividend ETF with an overall score of 87.50/100, summarized below.
The Sunday Investor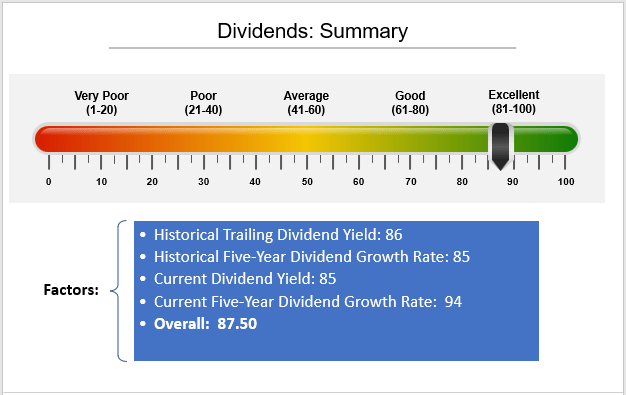
Growth
I’ve measured an ETF’s growth based on three forward-looking metrics: sales growth, EBITDA growth, and earnings per share growth. SCHD has an estimated 7.94% sales growth rate, good enough for 82nd place and an 18/100 score. Low growth is SCHD’s Achilles’ heel, and you shouldn’t expect it to keep pace with an ETF like SPY in a strong bull market. For reference, the ETFs with the highest estimated sales growth hold many Energy stocks. Examples include COWZ, HDV, DHS, and FDL.
SCHD has an 8.68% estimated EBITDA growth rate, earning it another low score of 17/100. Finally, SCHD scores 23/100 on its 10.70% earnings per share growth rate. Based on the average of these three scores, SCHD is rated very poorly on growth, as follows:
The Sunday Investor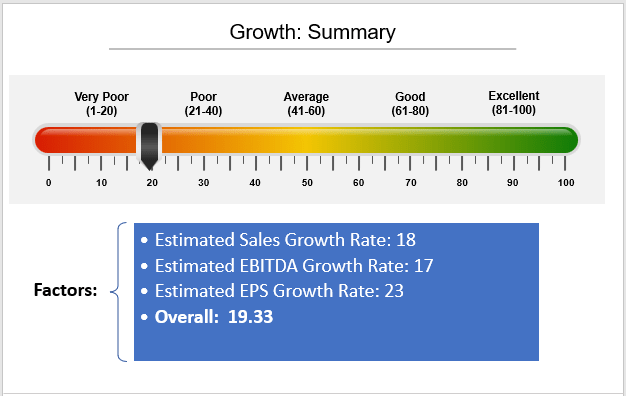
As an additional check, I calculated ETF growth grades based on Seeking Alpha’s Growth Factor Grades, adjusted on a ten-point scale. These Factor Grades rank individual stocks against their sector peers rather than the entire U.S. equity universe. On that metric, SCHD is a disastrous 2.48/10, or fifth worse only behind the following ETFs:
- FlexShares Quality Dividend Defensive Fund (QDEF)
- O’Shares FTSE U.S. Quality Dividend ETF (OUSA)
- ALPS Sector Dividend Dogs ETF (SDOG)
- Invesco DJIA Dividend ETF (DJD)
Valuation
I’ve measured valuation based on the four traditional valuation metrics: price-earnings, price-sales, price-cash flow, and price-book. For the price-earnings ratio, I’ll use forward earnings as the denominator, which have changed substantially over the last year.
SCHD’s forward price-earnings ratio is 16.78x, or 37th lowest, with a score of 63/100. Its 3.55 price-sales ratio is the 70th lowest (30/100), its 15.13 price-cash flow ratio is the 40th lowest (60/100), and its 12.23 price-book ratio is the 95th lowest (5/100). These scores average 39.50/100; however, I don’t place much value in book value and consider it outdated. Excluding it would give SCHD an average score of 51/100, which is more appropriate.
The Sunday Investor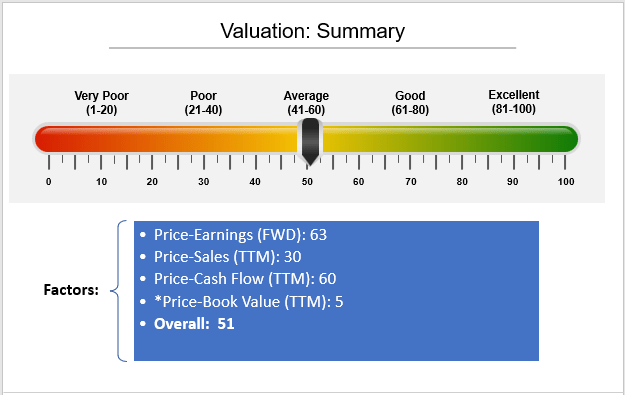
Profitability
Profitability is crucial to my model ETF portfolio on the Hoya Capital Income Builder Marketplace Service, as the easiest way to invest is to insist on highly profitable companies. Research based on data at the Ken French Data Library supports this being a successful long-term strategy. There are several profitability metrics I used to rank these ETFs, including:
- Return on Equity
- Return on Assets
- Return on Total Capital
- Cash To Total Debt
- EBITDA Margins
SCHD has an impressive 32.68% return on equity, the seventh best in the sample. It shouldn’t surprise readers since it’s one of the four key screens its Index uses (along with cash to total debt, indicated dividend yield, and five-year dividend growth). SCHD has a 10.74% return on assets, good enough for 15th place in the sample, and a 16.77% return on total capital, 14th best on the list. Therefore, the final scores for these three metrics are 93/100, 85/100, and 86/100, respectively.
As mentioned, the cash to total debt ratio is an input into SCHD’s model, so readers should expect a good score. When performing the calculations, I excluded Financials and Real Estate securities since the metric is often irrelevant for securities in these sectors. SCHD’s weighted-average cash to total debt ratio was 61.07%, or 25th best (75/100). Finally, SCHD’s EBITDA margins are 29.32%, or 19th best (81/100). Overall, SCHD’s profitability ranking is 84/100, as summarized below.
The Sunday Investor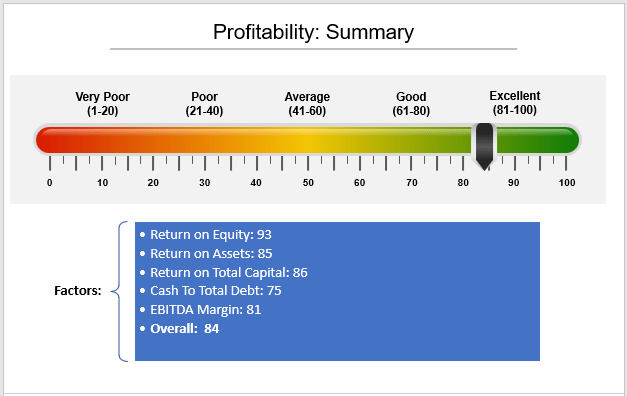
In addition, Seeking Alpha computes Profitability Grades for most U.S. equities. SCHD’s weighted-average profitability score based on current holdings is 9.32/10, the 20th best in the sample. It’s confirmation that, indeed, SCHD holds highly profitable stocks; if that continues, it should be an excellent long-term holding.
Price Momentum
Three easy ways to measure price momentum is to compare a portfolio’s price against its short-term 50-day, 100-day, and 200-day moving average prices. However, it’s necessary to weigh this at the individual holdings level because of portfolio turnover. Fortunately, it’s easy to do so, and SCHD’s holdings currently trade 9.53%, 8.04%, and 5.71% above their 50-day, 100-day, and 200-day moving average prices. Relative rankings are 89/100, 87/100, and 79/100, respectively, as summarized below.
The Sunday Investor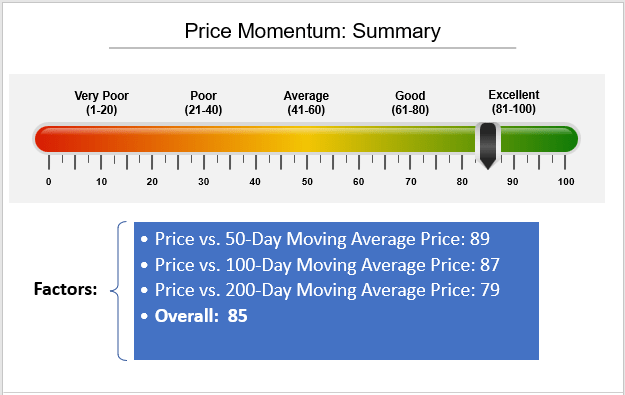
Market Sentiment
As a fundamental analyst, my approach to assessing market sentiment is to look at how well its constituents have performed recently against analyst expectations. In addition, I look to see if analysts are upgrading or downgrading future earnings expectations. The three metrics I value are:
- last quarterly sales surprise
- last quarterly earnings surprise
- EPS Revision ratings provided by Seeking Alpha
On a weighted-average basis, SCHD’s constituents had a 3.16% sales surprise last quarter, better than the 2.20% aggregate surprise for the S&P 500 Index reported by Yardeni Research. It’s 47th best in our sample, earning SCHD a score of 53/100 on this metric. SCHD’s constituents had a 5.22% earnings surprise, better than the 3.40% aggregate S&P 500 Index surprise but only 70th best among peers. Therefore, SCHD earns a poor 30/100 score.
Finally, SCHD’s Seeking Alpha’s EPS Revision Score, which measures changes in consensus Wall Street earnings estimates over multiple periods, was 5.80/10. It sounds terrible and illustrates just how negative sentiment is on Wall Street. However, it’s better than SPY’s 5.45/10 score and is the 35th best among its peers. Therefore, SCHD scores 65/100 on this metric.
SCHD’s overall score on market sentiment was 47.33/100, which is only average. If you value this metric, high dividends, low fees, and decent diversification, I suggest the Vanguard High Dividend Yield ETF (VYM) as an alternative. VYM is one of four alternatives to SCHD that I will highlight at the end of this article.
The Sunday Investor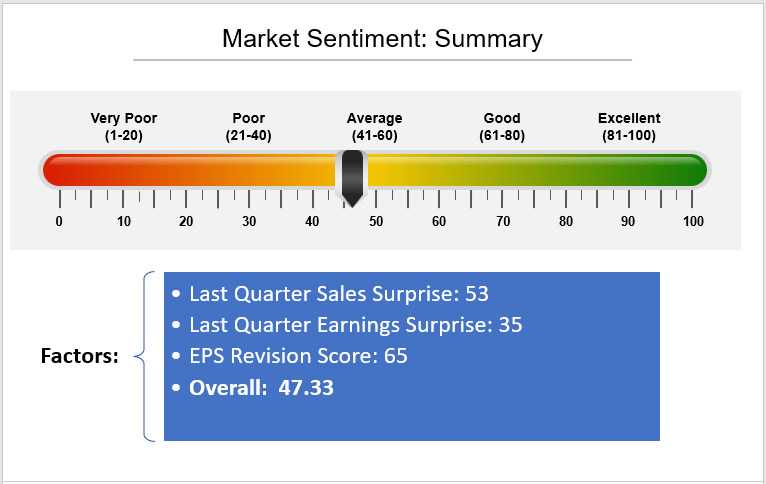
Risk-Adjusted Returns
I calculate three, five, and ten-year risk-adjusted returns for all ETFs in my database. The formula is an ETF’s realized annual returns divided by its realized annualized standard deviation based on monthly returns.
Through October, SCHD’s three-year return-to-risk ratio was 0.69, or third-best in the sample (97/100). Its five and ten-year return-to-risk ratios were 0.69 and 0.95, respectively, the best overall. Therefore, as summarized below, SCHD scores an impressive 99/100 on risk-adjusted returns.
The Sunday Investor
The last metric is what most investors and analysts look at when assessing an ETF. However, I disagree with this approach. While it helps determine how well a strategy has performed, it ignores the impact of portfolio turnover, what the portfolio holds today, and the current market environment.
Overall Ranking
Just like there are multiple investor types, there are numerous ways to rank an ETF. My purpose on Seeking Alpha isn’t to tell anyone how they should invest but to provide them with the tools they need to make an informed decision. To be as fair as possible, I’ve assigned a 10% weight to each of SCHD’s factors and computed an average score of 65.85/100, as summarized below.
The Sunday Investor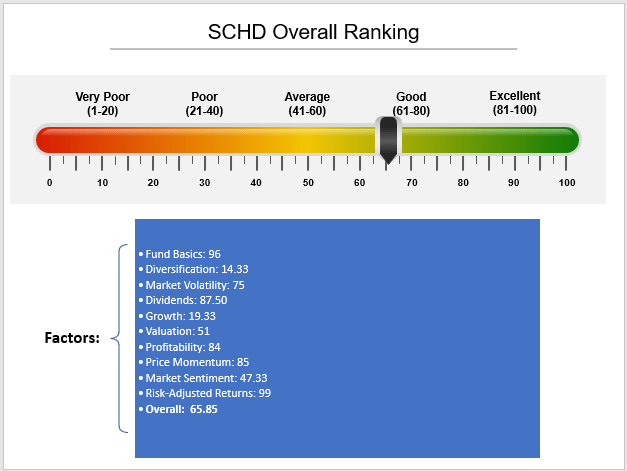
This score doesn’t sound great, but unless you’re planning on exiting equities altogether, you’ll need to find some equity security to invest in. Therefore, knowing where SCHD’s score ranks among its peers is critical. I did the same calculations for every ETF in SCHD’s peer group and found that SCHD ranks 3rd best, slightly behind the Vanguard High Dividend Yield ETF (VYM) and the iShares Core High Dividend ETF (HDV). The WisdomTree High Dividend ETF (DHS) and the Vanguard Value ETF (VTV) round out the top five.
Of course, if you assign different weightings to the above factors, you’ll get different results. Investors favoring highly-profitable blue-chip stocks that pay and grow their dividends might find SCHD is the best fund for them. However, value and growth investors can rightly point out that SCHD doesn’t have an impressive valuation or growth score. It’s also not very well diversified.
Fundamental Analysis
On that note, I want to present a fundamentals snapshot of SCHD’s top 25 holdings alongside these four other top-rated ETFs.
The Sunday Investor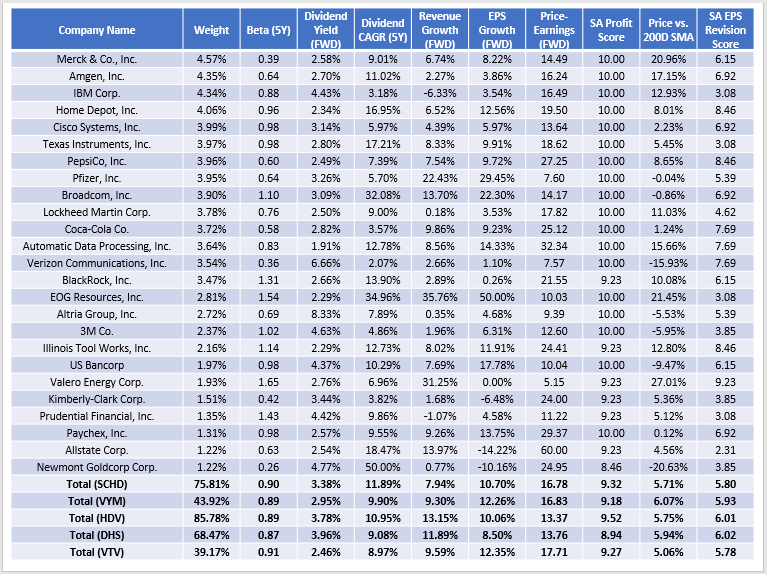
As discussed throughout this article, SCHD sacrifices sales and earnings growth to deliver a high dividend yield and growth rate. It’s also concentrated, with 75.81% of assets in its top 25 holdings, and has a reasonably low 0.90 five-year beta. Its 16.78x forward price-earnings ratio is average, but its 9.32/10 profitability score is excellent, so at least you know you’re paying for quality. Finally, SCHD’s earnings momentum, while better than the broad market, is only average compared to its peers. The reality is that Energy stocks have a lot of price and earnings momentum, and SCHD’s 5.71% allocation to that sector could hold it back.
There are pros and cons to owning each of these comparators. VYM is better diversified and should do better in a high-growth environment, but investors will have to sacrifice some dividend yield and dividend growth. HDV is nice on paper, but it’s 27% Energy right now, which is too aggressive with a potential recession looming. DHS is a well-diversified alternative, but its expense ratio is 0.38%, and those fees will add up over time. Finally, VTV is likely a better growth ETF than SCHD, but it trades at 17.71x forward earnings, the highest of the five.
Investment Recommendation
SCHD is a buy not just because of its excellent historical track record but because it ranks well on many of the metrics I value most. SCHD ranks 3/100 based on an equal-weight system using ten factors and 32 sub-factors. Investors may decide on a different weighting system, but it’s highly likely SCHD will still end up close to the top. In short, SCHD is solid in many areas besides past performance.
To be clear, SCHD has faults. It scores very poorly on diversification and growth. However, it scores average on valuation and market sentiment, good on market volatility and valuation, and excellent on its fund basics, dividends, profitability, price momentum, and risk-adjusted returns. If you can figure out how to patch its holes, like adding a well-diversified and cheap growth ETF, you should be on your way to building an all-weather portfolio that will let you sleep well at night. Thank you for reading, and as always, I look forward to the discussion below.
Be the first to comment