

Jean-Luc Ichard
After being clawed by the 2022 bear-market, the Schwab U.S. Large-Cap Growth ETF (NYSEARCA:SCHG) is down nearly 20% over the past year. The negative investors sentiment toward the sector makes sense: the high inflation & higher interest rate macro-environment will put pressure on growth rates while the resulting strength in the US dollar has put a strong foreign currency headwind on margins. This has resulted in a (lower) revaluation of the sector. However, a look under the hood shows that these mega-cap technology companies are performing just fine – both operationally and financially. That being the case, I’m taking a contrarian view and advising investors to BUY the SCHG ETF by scaling in over time in order to take advantage of market volatility.
Investment Thesis
My followers know I am bullish on the future of big-tech in the early stages of the 21st Century. COVID-19 simply accelerated the digital transformation of lifestyles and businesses already enabled by the natural technology evolution brought about by high-speed networking, mobility, 5G smartphones & infrastructure, IoT, data centers, high-speed low-power semiconductors, and AI/ML algorithms working on mega-data sets using high-performance computing. While the current macro-environment certainly poses challenges to these sectors going forward, most of the challenges were in place during the 1H of 2022 yet most of these companies performed very well operationally and financially. Specifically, these companies are still generating strong free-cash-flow and have rock-solid balance sheet. In my opinion, these are two of the most important attributes companies can have given the current macro-environment.
Today, I’ll take a closer look at the Schwab U.S. Large-Cap Growth ETF to see how it has positioned investors for success going forward and then you can decide if it is worth an allocation within your well-diversified portfolio.
Top-10 Holdings
The top-10 holdings of the SCHG ETF are shown below and equate to what I consider to be a moderately concentrated 53% of the entire portfolio of 228 companies:
Schwab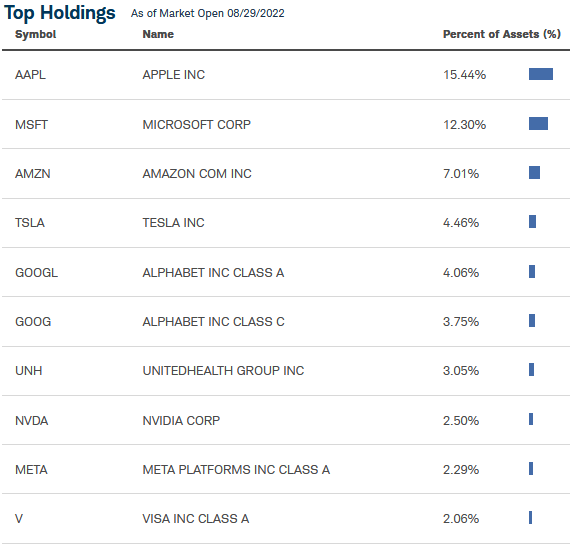
The #1 holding with a 15.4% weight is Apple (AAPL). Apple has a strong global brand, a diverse product-line (iPhone, Mac, iPad, wearables, and the Apple ecosystem services) and as a result has the biggest market cap of any U.S. company ($2.6 trillion). In July, Apple released a strong Q3 FY22 EPS report. Highlights included:
- Revenue of $82.96 billion (23.6% high-margin services)
- Net income of $19.44 billion (23.4% of revenue)
- Ended the quarter with $27.5 billion in cash and cash equivalents.
On the Q3 conference call, Apple reported it had repurchased 143 million shares for $21.7 billion during the quarter. That equates to an average price of $151.75/share. The stock closed Monday at $161.38.
Microsoft (MSFT) is the #2 stock in the SCHG portfolio with a 12.3% weight. Similar to Apple, Microsoft’s recent Q4 FY22 EPS report was strong:
- Revenue of $51.9 billion was +12% yoy (+16% in constant currency)
- Operating income of $20.5 billion was +8% yoy (+14% in constant currency)
- EPS of $2.23 was +3% yoy (+8% in constant currency)
- Revenue from Azure and other cloud services revenue was +40% yoy
Despite this excellent performance, MSFT stock is down 12.6% over the past year pays a $2.48/share annual dividend.
Counting both classes of Google (GOOG) (GOOGL) stock, it is effectively the #3 holding with a 7.8% weight. Google also announced a very strong Q2 FY22 EPS report:
- Revenue of $69.7 billion was +13% yoy (+16% in constant currency)
- EPS of $1.21/share was down $0.15 yoy
- Free-cash-flow generation of $12.6 billion
- Quarter ended with $125 billion in cash (an estimated $9.40/share)
Note Google’s quarter-ending cash-hoard was even after spending a massive $15.2 billion on stock repurchases during the quarter. Google shares split 20:1 during the quarter and the company remains my favorite large-cap technology company for its strong FCF generation and still dominant position in search.
Amazon (AMZN) is effectively the #4 holding with a 7.0% weight. Like Google, Amazon is also trading post a 20:1 stock split and given its lower stock price is now considered to be a contender for inclusion into the DJIA. AMZN stock is down 24% over the past year as the company arguably over-spent on capacity expansion just as the economy began slowing.
Diversified health-care company UnitedHealth (UNH) is the #7 holding with a 3% weight. The stock is up 26.7% over the past year, pays a $1.65/share quarterly dividend (yielding 1.25%), and trades with a forward P/E = 24.3x. Due to its high stock price, UNH is the highest weighted component of the DJIA at 10.8%.
With a 2.1% weight, the top-10 holdings are rounded out by payment processor Visa (V). Visa recently came under fire for accepting payments by customers of PornHub. Visa has since suspended payments from that platform. Seeking Alpha gives Visa an A+ Profitability Score:
Seeking Alpha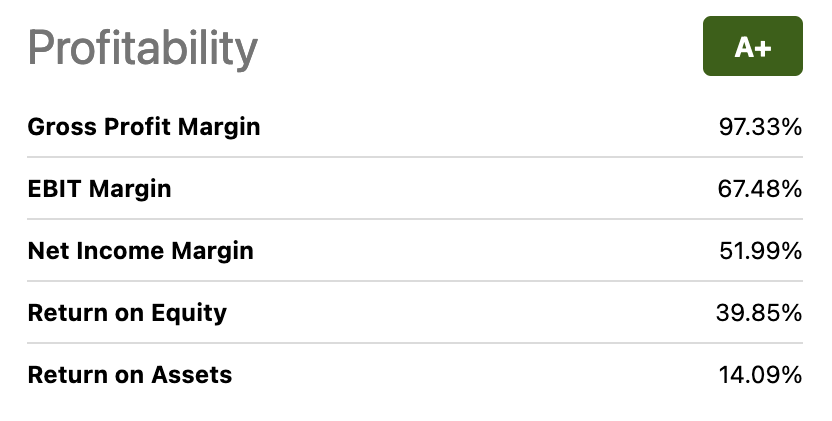
The overall SCHG ETF portfolio is weighted heavily toward the IT sector (48%) with around 13.5% in each of three other sectors: HealthCare, Consumer Discretionary, and Communication Services.
SCHG has a TTM yield of 0.85%. That being the case, the primary investment thesis here is capital appreciation, not income.
Performance
SCHG’s long-term performance track-record is shown below:
Schwab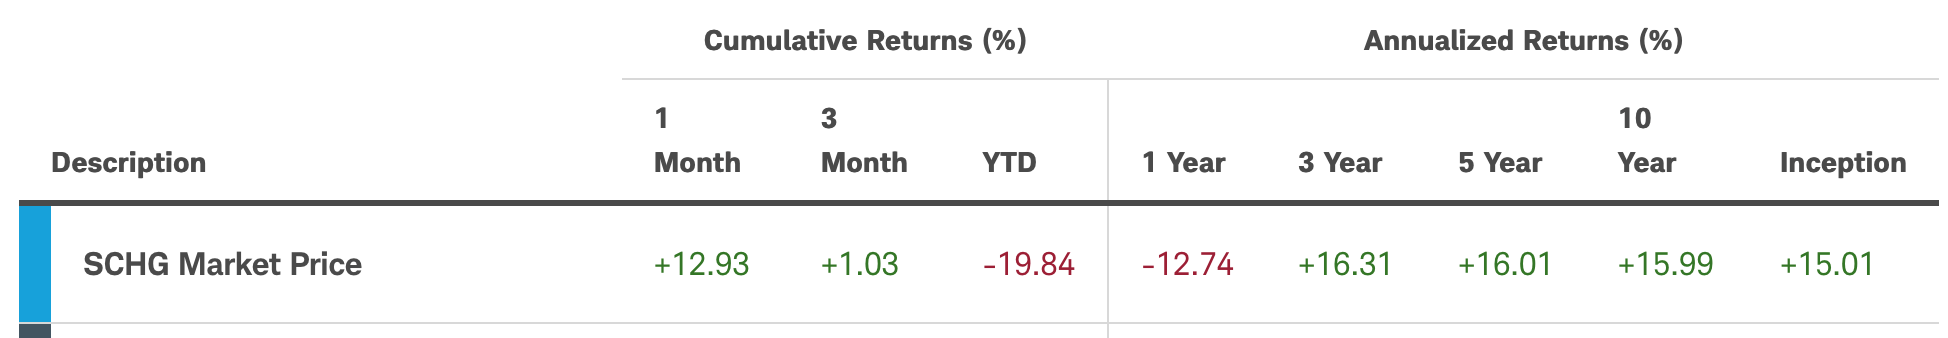
As can be seen in the graphic, despite a lousy 12-months, the average annualized total-return over the past decade is a very attractive 16%.
The following chart compares the price-return of the SCHG ETF with peers the Vanguard Mega Cap Growth ETF (MGK) and the Fidelity Mega Cap Fund (FGRTX):
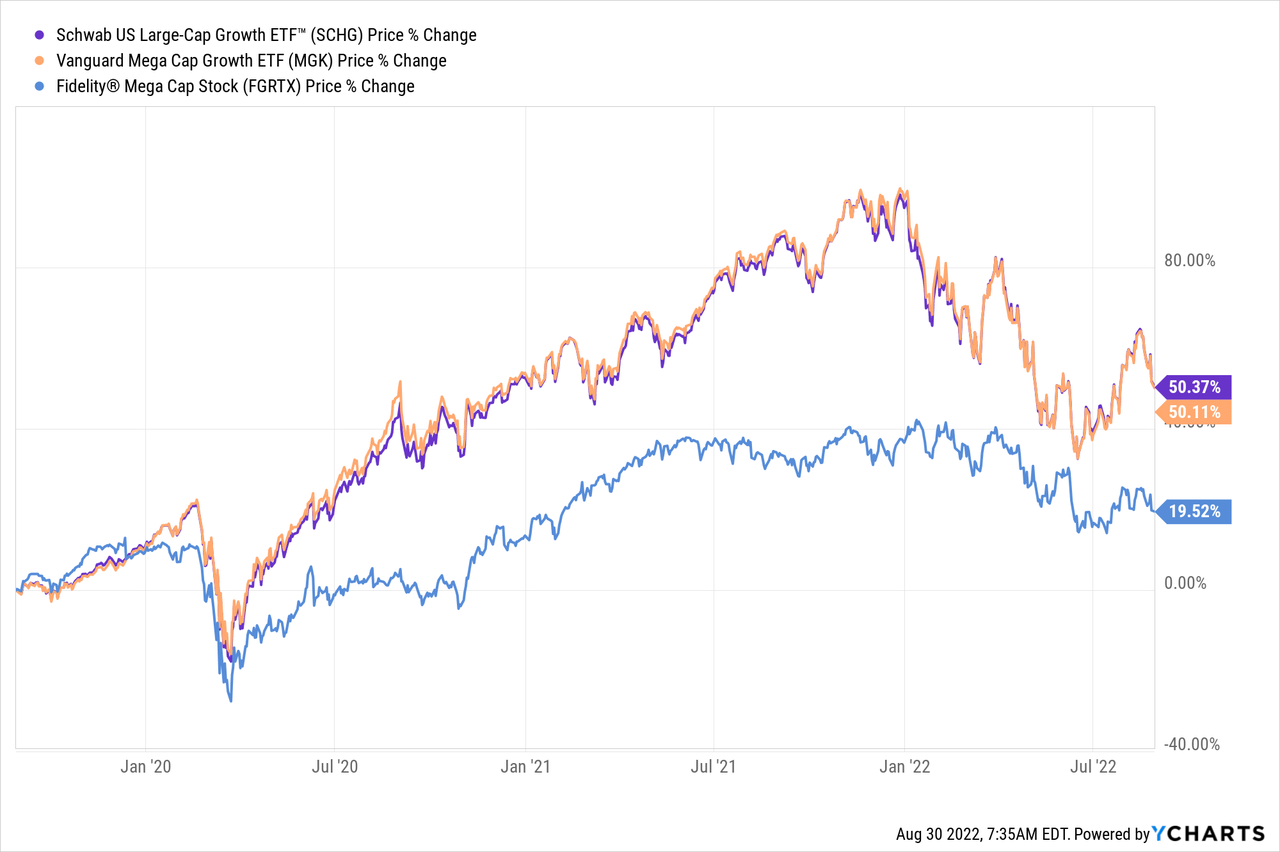
SCHG and MGK are basically neck-n-neck. Surprisingly for a Vanguard fund, the MGK ETF actually has a 30 basis points higher expense ratio (0.07%) as compared to SCHG (see MGK: The Cream-of-the-Crop).
Risks
The strong US dollar is a significant headwind to global big-tech. Note in the above discussion on Microsoft, FX was a 4% hit to top-line revenue. Likewise, FX was a 3% hit to Google’s top-line.
Many of the mega-cap tech companies are still arguably very highly-valued. Indeed, the average P/E of the entire SCHG ETF portfolio is 27.2x as compared to the S&P500’s 20.4x. Similarly, the SCHG ETF currently has a price-to-book ratio of 6.9x – significantly higher than the S&P500’s price-to-book of 4.0x. That being the case, the current macro-environment (high inflation, higher interest rates, Putin’s war-of-choice on Ukraine that has effectively broken the global energy & food supply chains, etc.) could slow the global economy – or even cause a global recession – and therefore pressure the valuation multiples on mega-cap tech stocks going forward.
Summary & Conclusions
Despite the macro-headwinds, and as shown by the earlier discussion of some of the top-10 mega-cap tech stocks in the SCHG portfolio, these leading global brands are performing very well operationally and financially. These companies are generating strong free-cash-flow, have rock-solid balance sheets, and most are buying back tons of stock. After the pullback of the 2022 bear-market, now is a great time for investors to take advantage of market volatility to make strategic purchases of the SCHG ETF, which I rate as a BUY.
I’ll end with a 5-year price chart of the SCHG ETF versus the broad market averages: the S&P500, the Dow Jones Industrial Average (DIA), and the Nasdaq-100 as represented by the (QQQ) ETF:
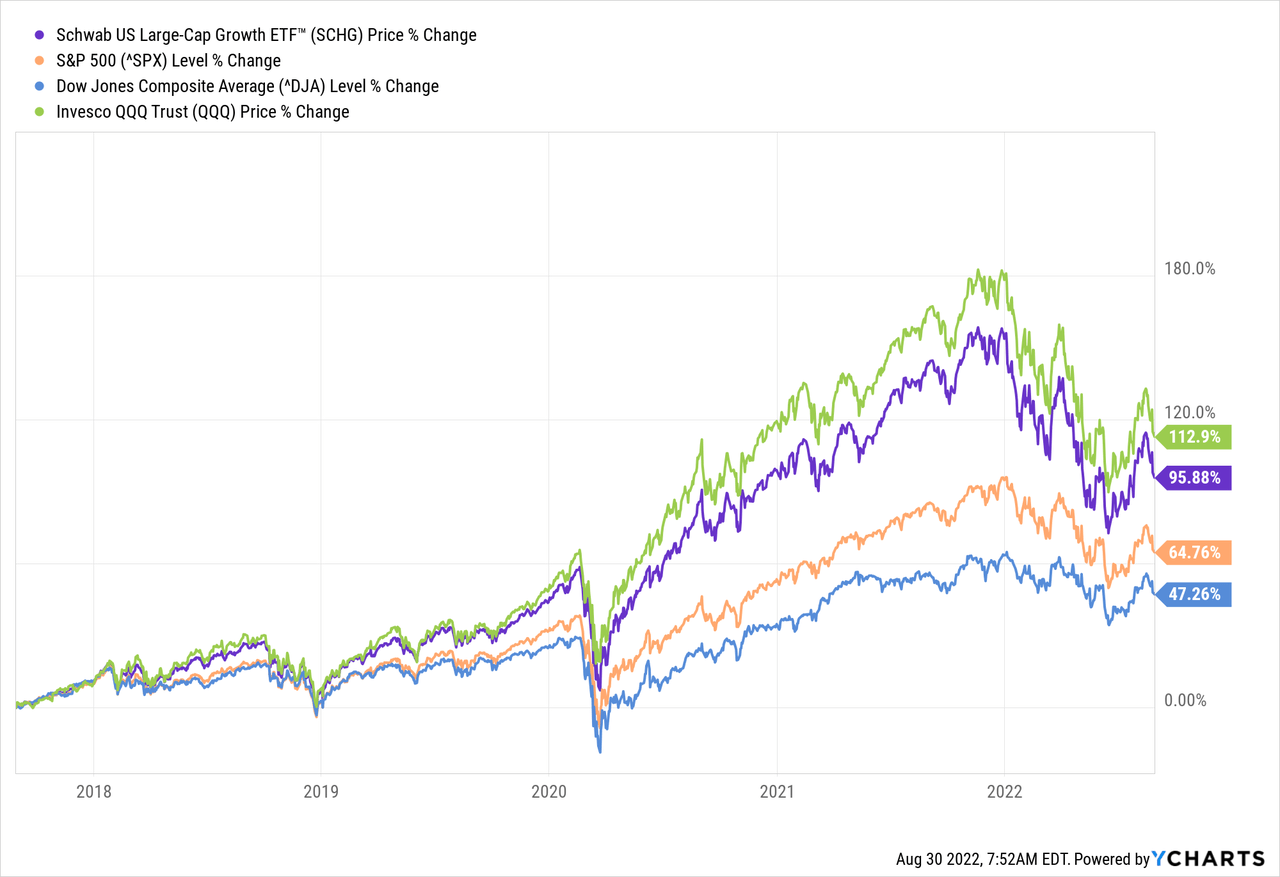
Note the SCHG ETF has significantly outperformed the S&P500 and is therefore an ideal ETF for investors that want to add a “Growth” component to their well-diversified portfolio in an attempt to outperform the S&P500 over time.
Be the first to comment