

Kwarkot
Thesis and Background
We follow a top-down investment approach. We first check the market at a sector level to see the forest and then check a few leading stocks to see the trees. The mechanics of the market dashboard are detailed in our earlier article here and you are welcome to download it here. The following is what we see.
Source: author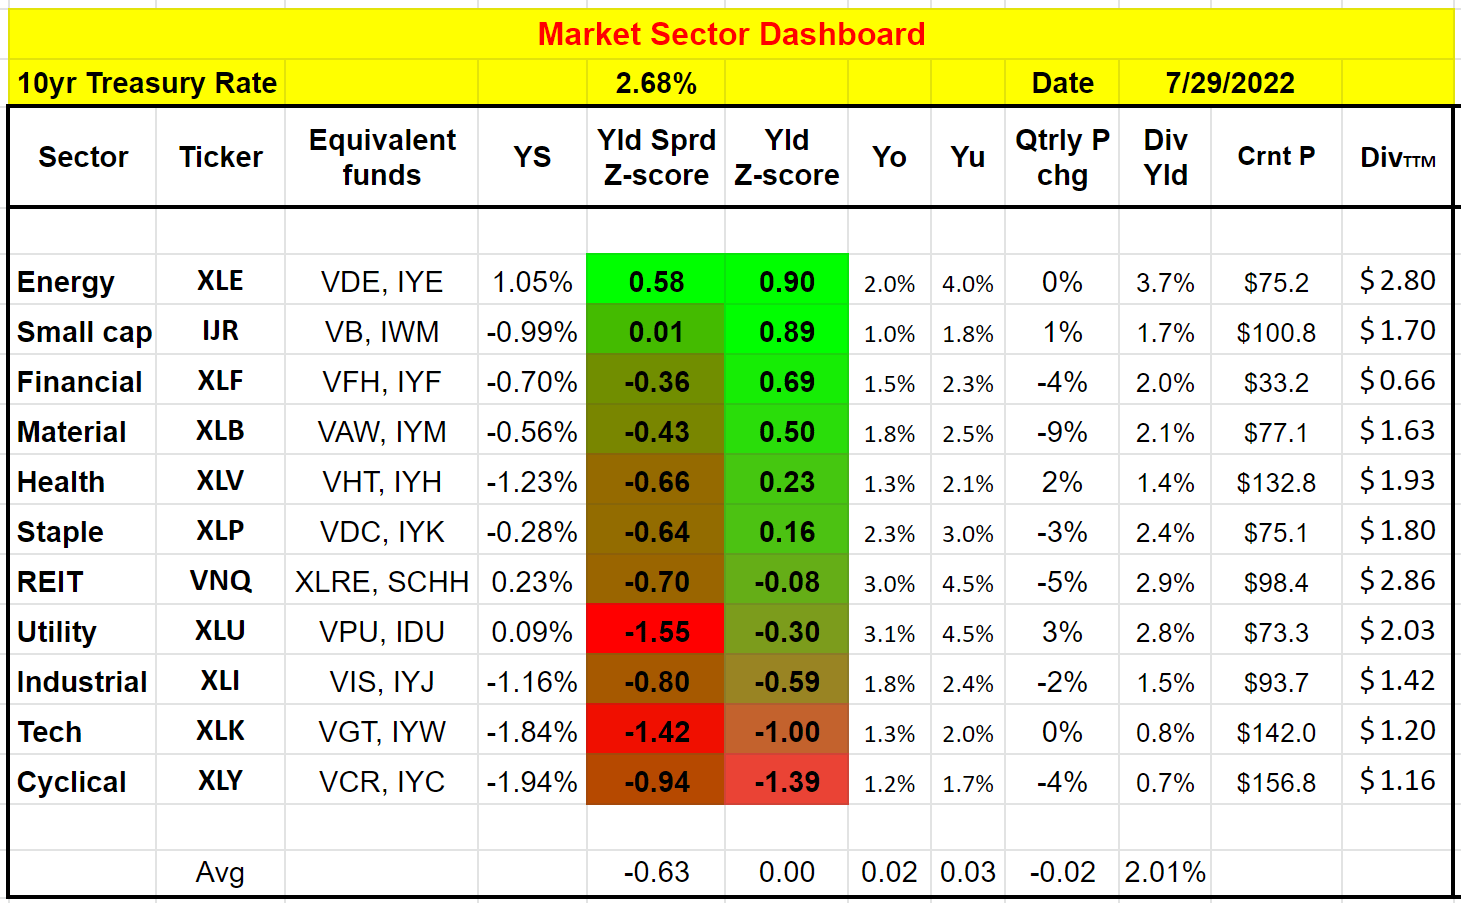
The key observation is that many safe-haven sectors such as utilities, REITs, and staples are no longer “safe”. The causes are recent market turbulence and rate hikes. Recent market corrections and rate hikes impacted different sectors differently. And many of the “unsafe” or cyclical sectors such as energy, small-caps, and basic materials are now actually relatively safe because their valuation risks have been largely cleared already. They feature a relatively thick yield spread above their historical averages and also risk-free interest rates.
In contrast, traditional safe haven sectors are relatively riskier. Take the REIT sector, the main topic for today, as an example. Note that in this article I will use two popular funds, the Schwab U.S. REIT ETF (NYSEARCA:SCHH) and the Vanguard Real Estate ETF (NYSEARCA:VNQ), to approximate the REIT sector. Their current dividend yields are below their historical averages (as you can see from the negative 0.08 dividend yield Z-score). And their yield spread relative to 10-year Treasury rates are also below, substantially below, their historical averages (as reflected in the negative 0.70 yield spread Z-score).
Looking forward, I see the REIT sector remaining under pressure for several reasons. The current borrowing rates are likely to persist and even further climb, which will negatively impact many stocks in the REIT sector due to their reliance on leverage. There are signs of a recession in the near future. And finally, the REIT sector is still priced at a premium and susceptible to valuation contraction, as we will see immediately below.
As such, my overall thesis is to stay out of REIT for now. But if your account must hold REITs, you will also see a few reasons why I prefer VNQ over SCHH.
SCHH and VNQ: basic information
Just in case some readers are not familiar with these funds yet, the following chart shows an overview of their basic information. VNQ is a much larger fund with $39 billion AUM, compared to $6 billion from SCHH. They follow different index strategies, but many of their holdings overlap as we’re going to see in a later section.
Source: ETF.com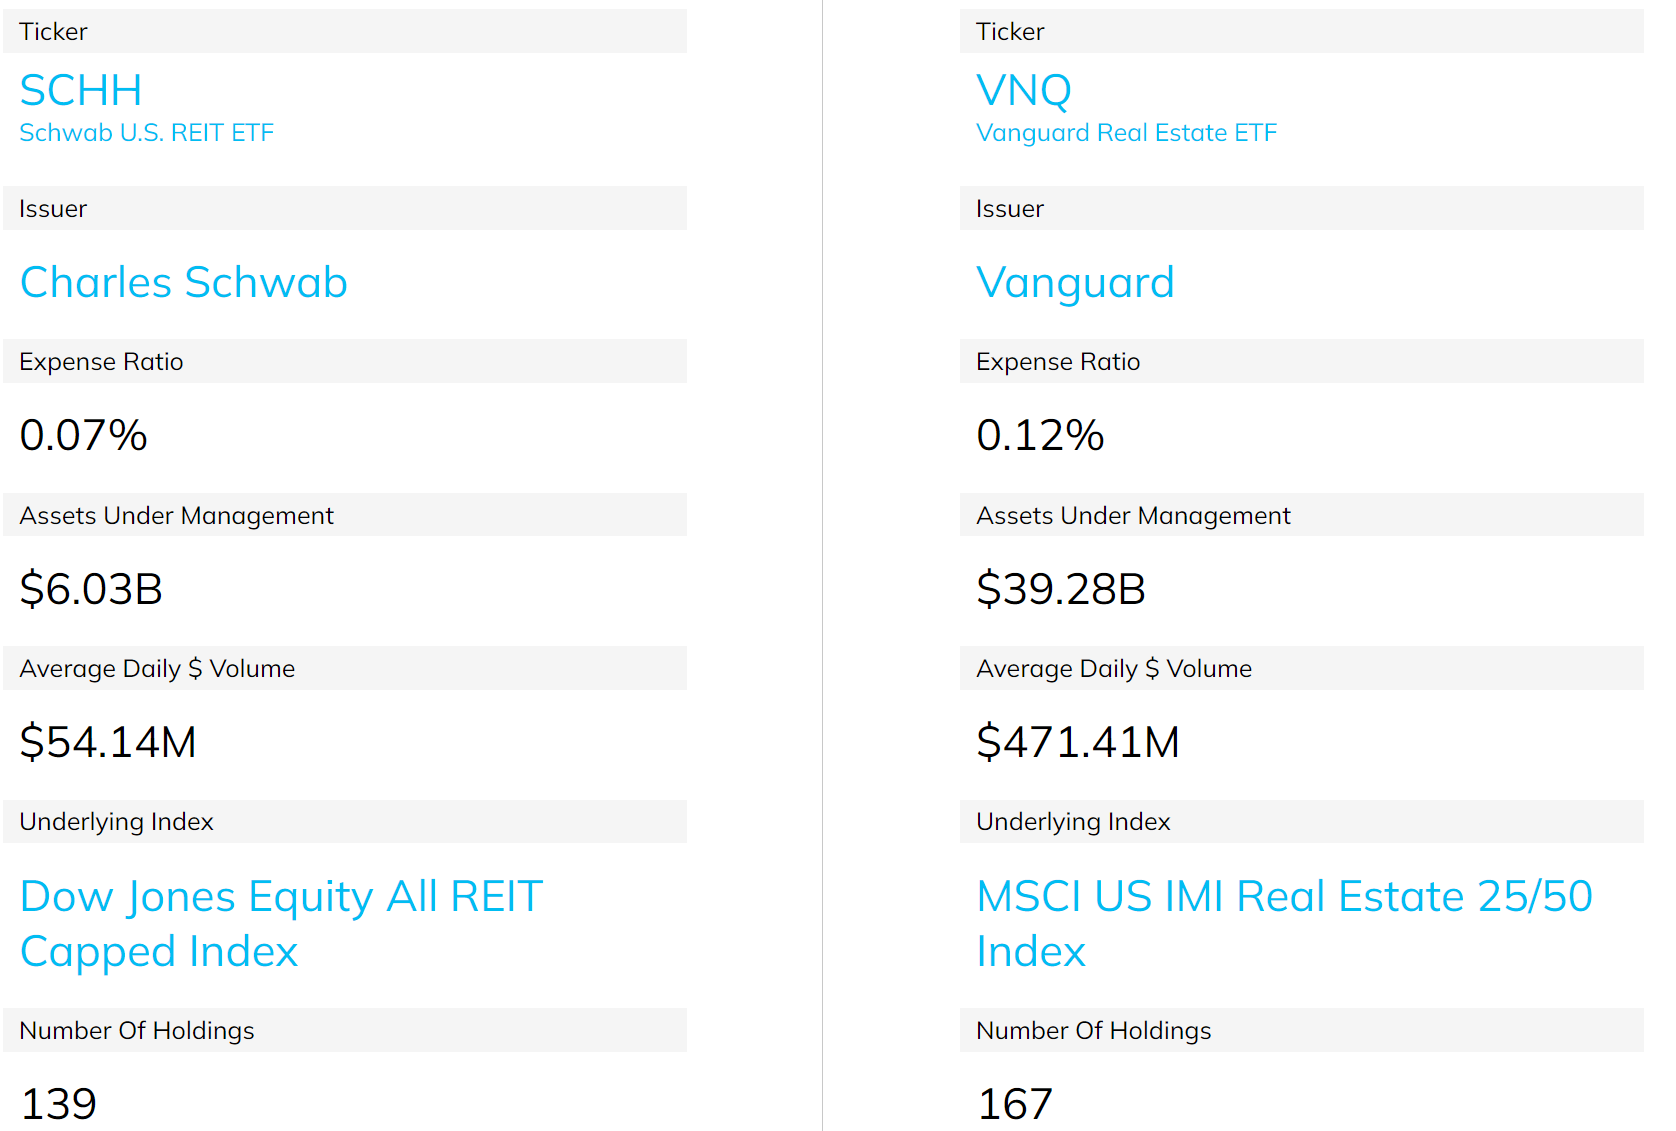
SCHH and VNQ: Dividend comparison
Many investors are drawn to REITs due to their generous dividends. So, let’s check out the dividends first. As you can see from the following chart, both VNQ and SCHH are indeed providing attractive dividend yields, at least in relative terms compared to other sectors or the overall market. SCHH is yielding 2.01% currently, and VNQ’s yield is even higher at 2.9%.
However, once we broaden the horizon a little bit, you will see that their current yields are actually near the lowest level in a decade. In the past 4 years, the average yield from SCHH is 2.71% and 3.53% from VNQ. Thus, for SCHH, its current yield is about 25% below its historical average, signaling a 25% valuation premium. VNQ’s current yield is about 18% below its historic average in the past four years, signaling an 18% valuation premium.
The above consideration is also my first reason for preferring VNQ. Its valuation premium is lower and it also provides a higher current dividend for better return support.
Source: Seeking Alpha
SCHH vs VNQ: indexing method
The root cause for their differences in dividends and valuation is their indexing methods. More specifically, the indexing methods and goals are:
SCHH’s goal is to track as closely as possible, before fees and expenses, the total return of the Dow Jones Equity All REIT Capped Index, an index composed of U.S. real estate investment trusts classified as equities.
VNQ’s goal is to closely track the return of the MSCI US Investable Market Real Estate 25/50 Index, and to offer high potential for investment income and some growth.
Many holdings overlap between these two funds as you can see from the list of their top 10 holdings. Although there are some notable differences. VNQ holds more stocks than SCHH (167 vs. 139). And the exact allocation to each holding is also different. These differences led to the difference in dividends and valuation premiums observed above. And further implications are discussed next.
Source: ETF.com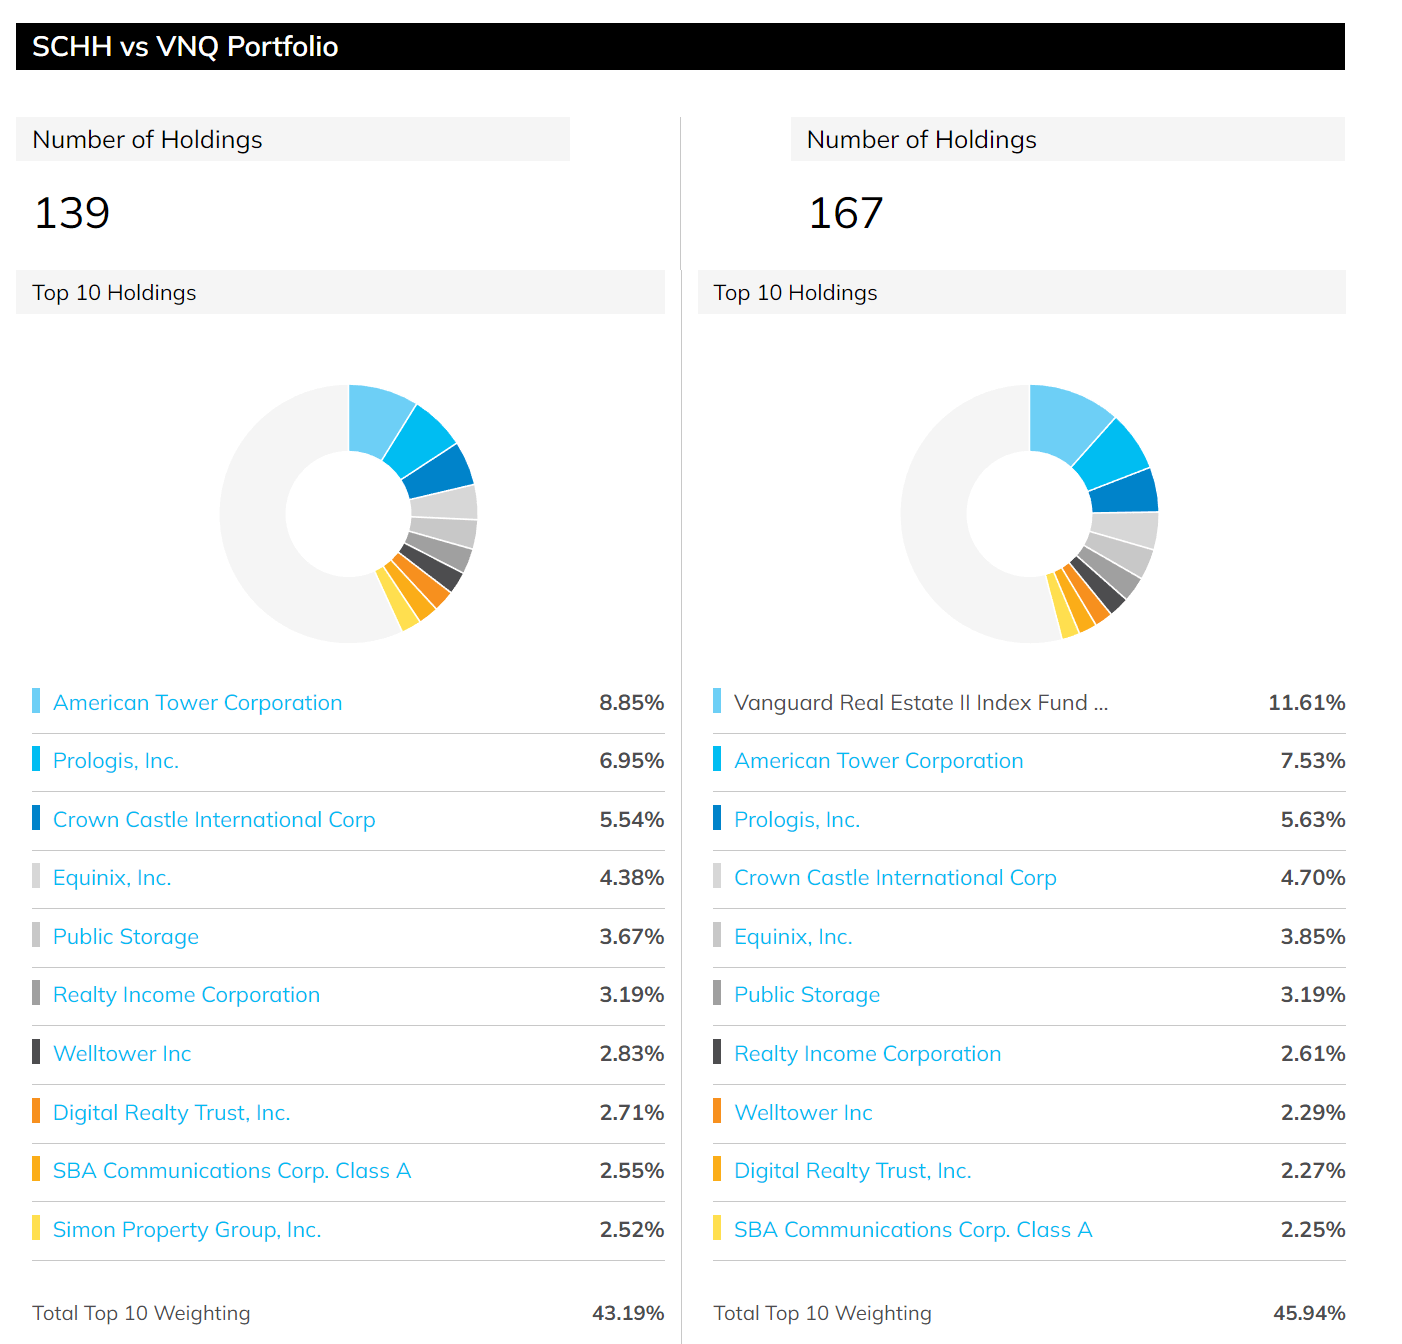
SCHH vs. VNQ: valuation comparison
The above differences in the indexing method also led to other differences in their characteristics. And here I will point out a few of the noteworthy ones in my consideration. Firstly, the median market cap of VNQ is slightly larger than SCHH ($23.4 billion versus $22.2 billion). A larger market cap usually correlates with a safer investment (and we will touch on this again in a later section).
Then you can see the valuation differences again. The price-to-earnings ratio of VNQ is 27.5x, again below SCHH’s 28.4x, consistent with the assessment we just performed from their dividend yields. Their price-to-book ratios are identical at 2.5x.
Source: vanguard.com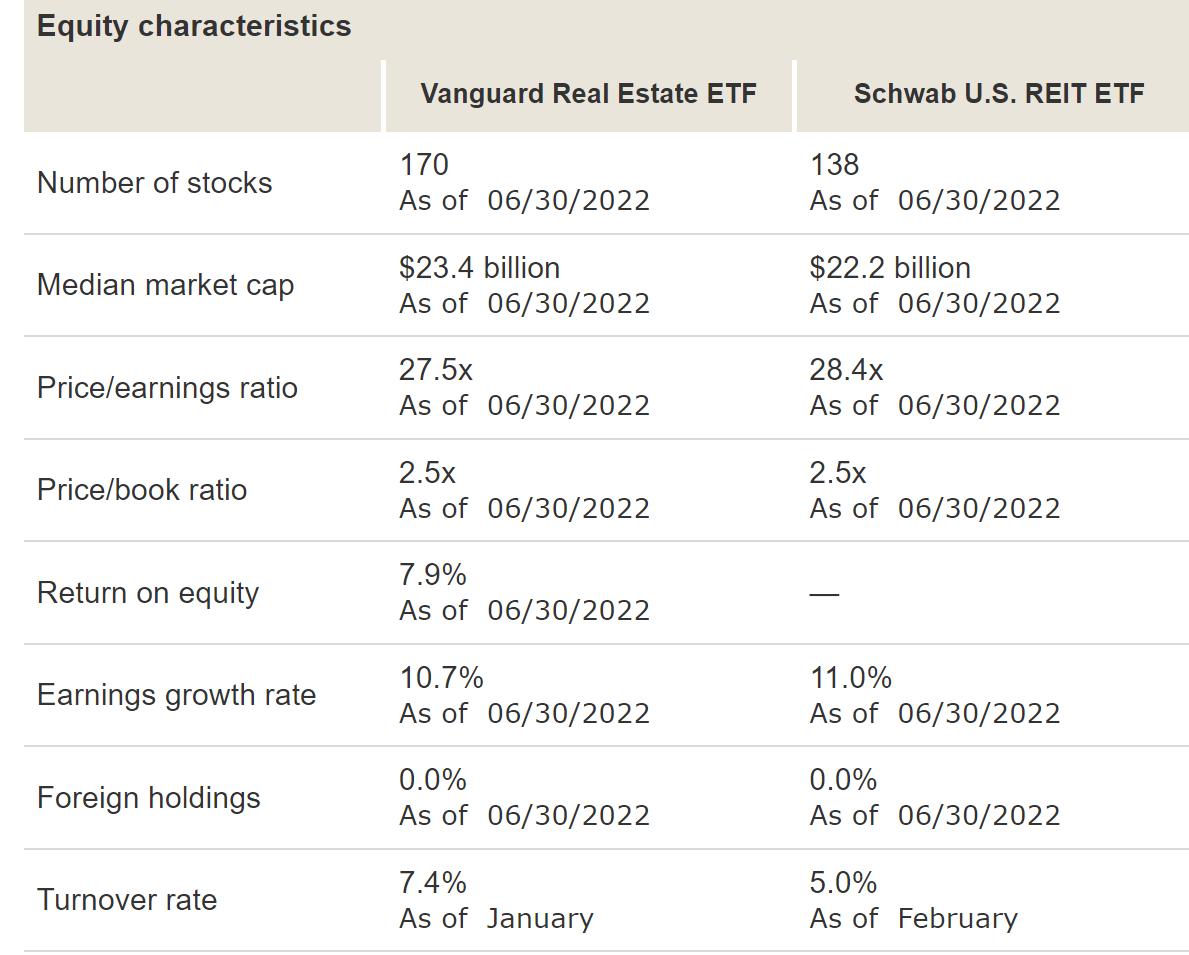
SCHH vs. VNQ: Performance and risks
Both the SCHH and VNQ funds have delivered healthy returns in the past (since SCHH’s inception in 2012) as you can see from the chart below. However, with an 8.5% CAGR, VNQ has delivered superior performance. Compared to SCHH’s 7.08% CAGR, the alpha is almost 1.5% CAGR. When compounded over the past decade, such an alpha has accumulated into a sizable difference of more than 30% in total return (236% vs. 205%).
Also, note that VNQ has actually suffered lower volatilities overall due to the difference in their indexing methods mentioned above. In terms of standard deviation, VNQ’s volatility has been on average 15.9%, compared to 16.2% from SCHH. In terms of worst year performance, the comparison was quite close (20.5% vs. 19.3%). And in terms of maximum drawdowns, VNQ’s 25% drawdown is lower than SCHH’s drawdown by about 5%.
Source: Portfolio Visualizer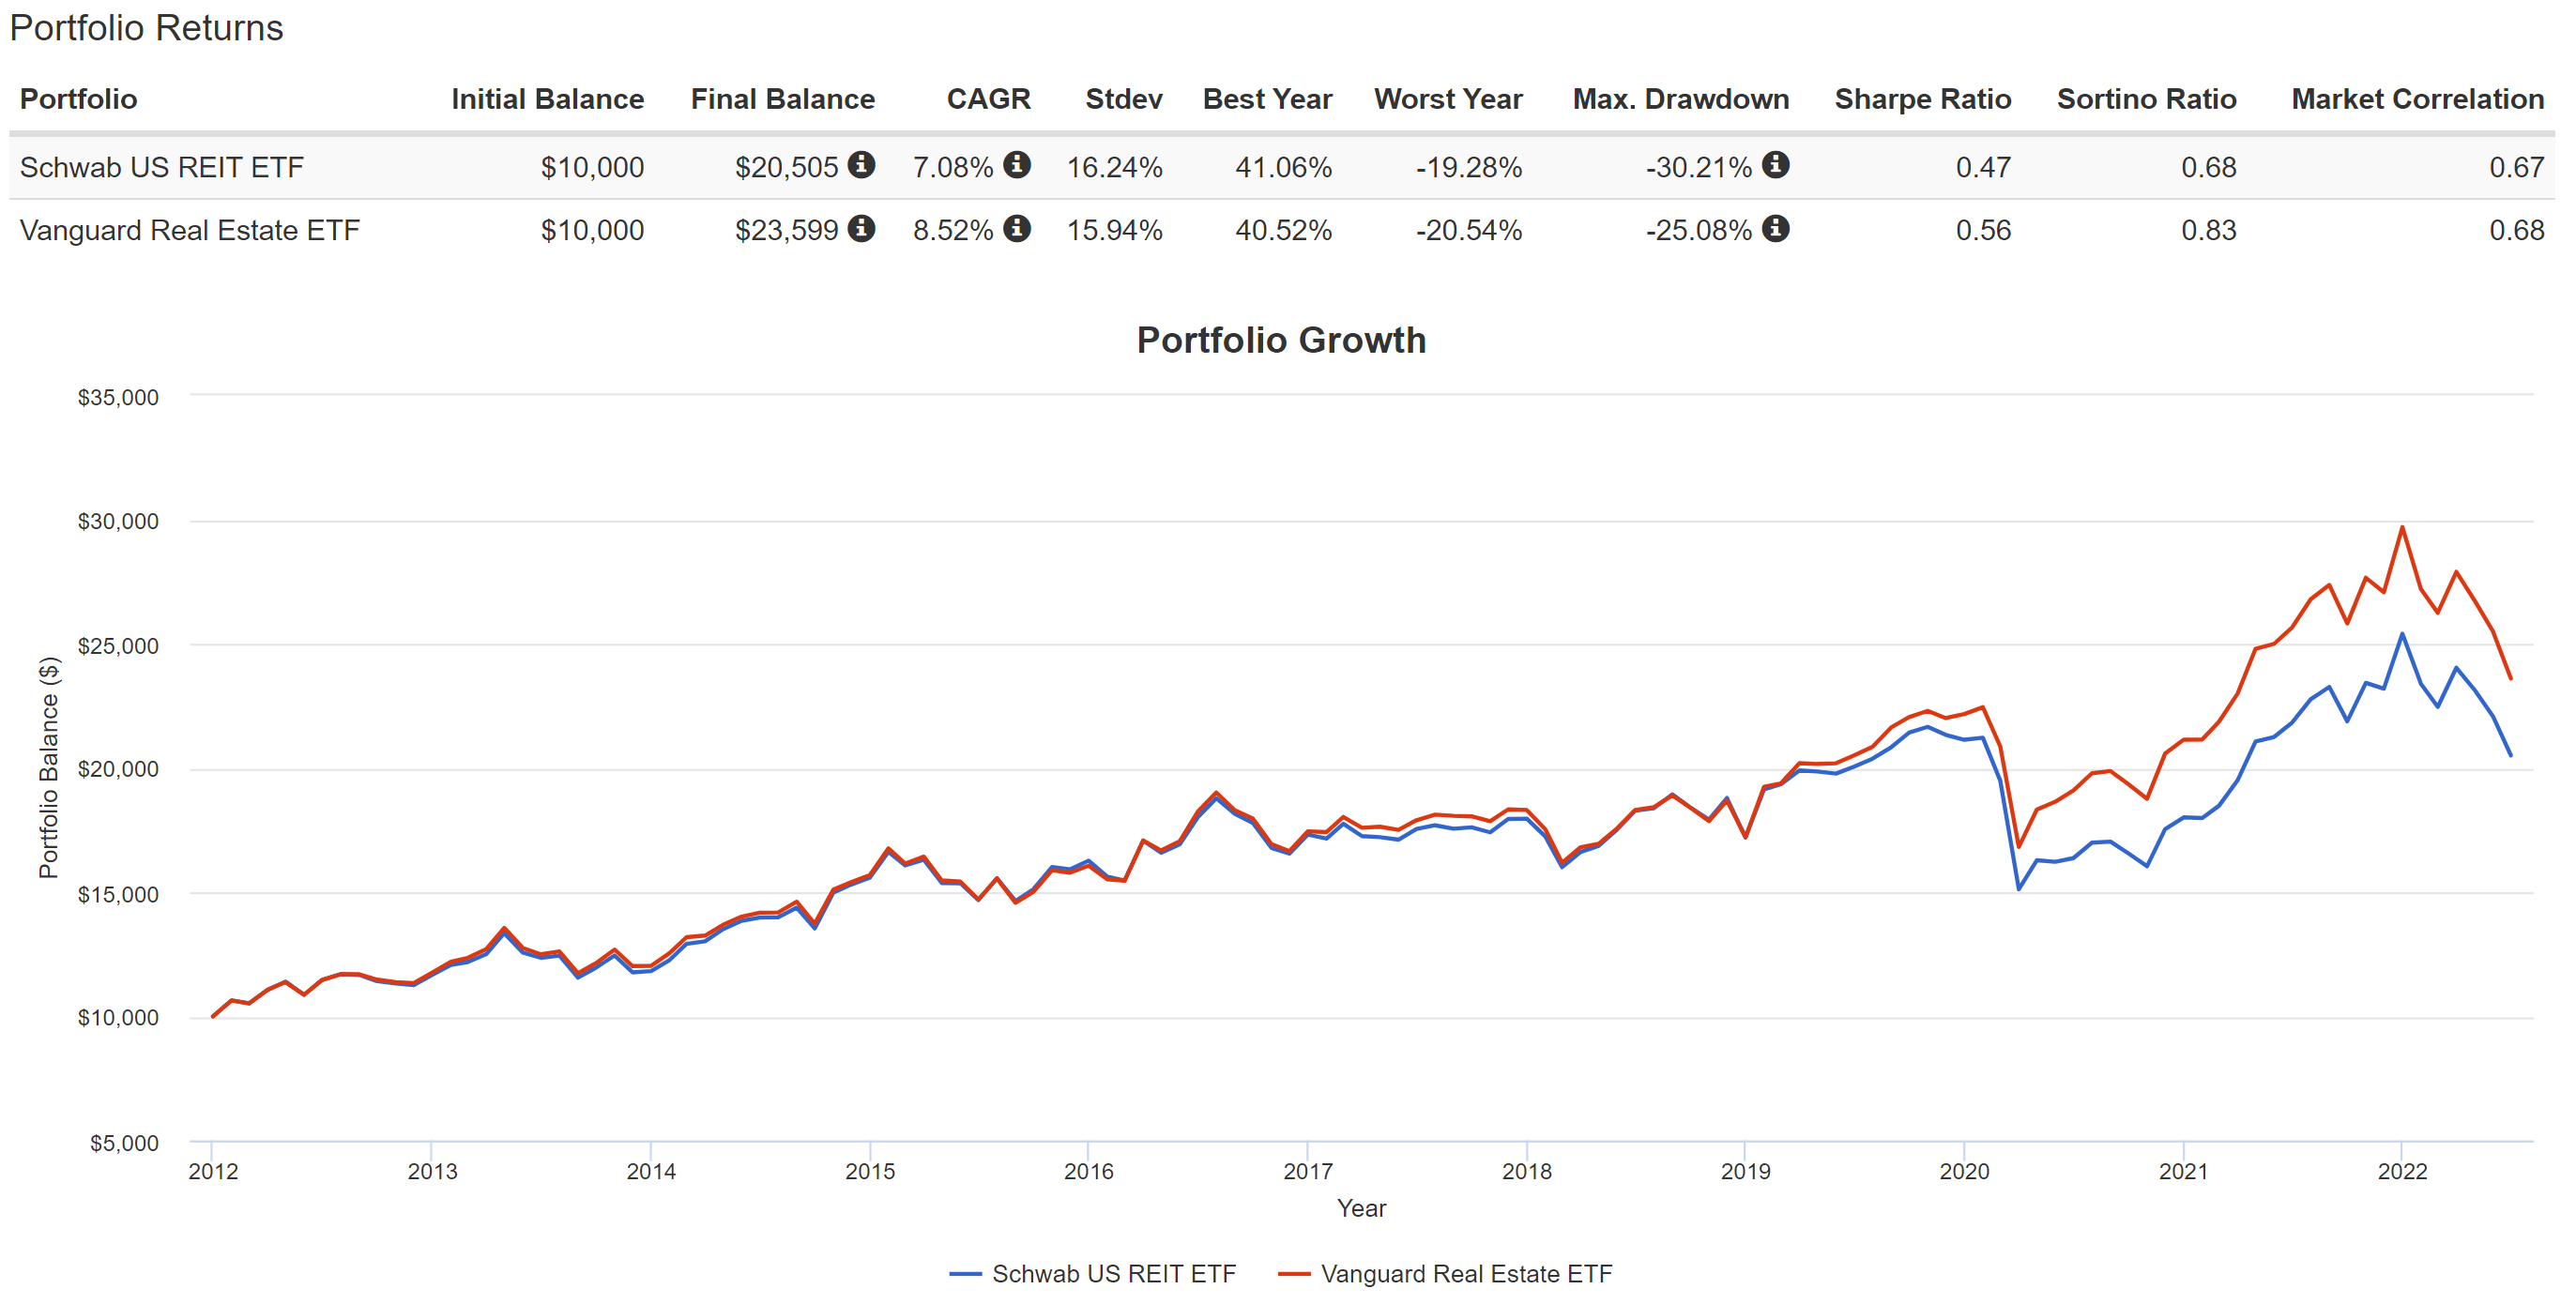
Final thoughts and other risks
In summary, this article compares two popular REIT funds, SCHH and VNQ, in detail. The goals are twofold. The first goal is to illustrate their similarities and differences to help REIT investors make an informed choice. And the second goal is to illustrate the current conditions of the REIT sector relative to other sectors.
Between these two funds, I prefer VNQ over SCHH for several reasons. VNQ’s valuation premium is lower, and it also provides a higher current dividend for better return support. Holdings in VNQ feature larger market capitalization on average, which subsequently leads to lower volatility risks. VNQ has also been delivering a higher total return in the past (an alpha of about 1.5% CAGR compared to SCHH).
Although, there are risks for VNQ too. Firstly, VNQ’s turnover rate is higher. As you can recall from an earlier chart, VNQ’s turnover rate is 7.4%, compared to SCHH’s 5% turnover rate. This might be a consideration for accounts that are taxed. Although both 7.4% and 5% turnover rates are relatively low in absolute terms. VNQ also charges a higher fee (0.12% vs. 0.07%).
Lastly, there are also risks that impact both of them. As mentioned, both funds are trading at a premium valuation relative to their historical averages. In terms of dividend yield, SCHH is at a 25% premium above its historical average in the past 4 years and VNQ is at an 18% valuation premium. Looking forward, I also see the current borrowing rates persist or even worsen, creating headwinds for both funds (and other REIT funds too). There are signs of a recession in the near future too. U.S. GDP has been in contraction for two consecutive quarters. Recent earnings reports from bellwether stocks like JPMorgan (JPM) and Walmart (WMT) provide more recession signals. The combination of premium valuation and recession could trigger oversized price corrections.
Be the first to comment