

Torsten Asmus
Investment Thesis
Persistently high inflation and interest rates aren’t necessarily bad for U.S. dividend stocks. Although we have limited information on the performance of exchange-traded funds (“ETFs”) like the Schwab U.S. Dividend Equity ETF (NYSEARCA:SCHD), a wealth of information exists in the form of historical returns for SCHD’s most consistent holdings like PepsiCo (PEP) and Coca-Cola (KO). The Kenneth French Data Library provides free access to the returns of dozens of unique portfolios formed by dividends, profitability, assets, size, and valuation dating back as far as 1920. Finally, SCHD’s well-balanced fundamentals ensure it will be a solid performer in most environments, which I’ll demonstrate by comparing it with over a dozen alternatives. In short, I remain confident in SCHD and its constituents’ impressive track record and am rating it as a buy.
ETF Analysis: A Different Approach
My approach for analyzing ETFs is different than most analysts. Rather than focusing on price charts to assess performance, I focus primarily on an ETF’s current composition and take a fundamentals-based approach when comparing them against their peers. The reason is because ETFs are merely baskets of securities that can change, sometimes dramatically, as an Index reconstitutes. Price charts are often misleading.
To illustrate, consider if you had launched an ETF called the Large-Cap Dividend Momentum ETF in 2017. The ETF has four straightforward rules applied each January, as follows:
- only dividend-paying S&P 500 securities are eligible
- a security’s minimum market capitalization is $50 billion
- securities are selected based on prior year returns (highest ones qualify)
- ten securities are held in equal weight (10% each)
From 2017-2021, Tech stocks like Apple (AAPL), Microsoft (MSFT), and NVIDIA (NVDA) were held, and the results were fantastic. But looking ahead to January, you’ve noticed the ETF will likely be dominated by Energy stocks like Exxon Mobil (XOM) and Chevron (CVX). Assuming that scenario plays out, what value would analyzing the ETF’s price chart have when trying to understand how the current holdings will perform going forward?
The answer is very little. So when you’re looking at the price chart of an ETF, understand that it’s different than an individual stock’s chart because of portfolio turnover. Evaluate the sensitivity of its screens, understand the size of the stock universe the Index selects from, and look for signs of style drift throughout the year. When in doubt, look at the current holdings because that’s what you’re buying today. The ETF’s price chart may still be helpful, but it reflects how a specific strategy performed rather than the current constituents themselves.
SCHD: Backtesting To 2011
A recent article on SCHD asserted the following:
The Dividend ETFs’ past performance record is too short to give us any insight here. They have not ever traded during a period of inflation lasting more than a few months. They have never traded in a period where inflation exceeded 4%. And most of all, they have never traded in a market that wasn’t heavily supported by the Fed’s policy of keeping rates below the actual rate of inflation.
As previously indicated, I agree with the sentiment that an ETF’s price chart is misleading. Moreover, there isn’t a single ETF trading today that was around when inflation was rampant in the early 1980s. In that sense, we may be entering unchartered waters as the Federal Reserve raises interest rates to combat high inflation.
However, SCHD’s constituents have much longer track records than the ETF itself, so I think we can still use that information to gain further insight into potential future performance. Specifically, 99 / 101 have a track record that predates SCHD, and they represent more than 99% of the ETF’s total weight. Here’s how such a portfolio, rebalanced quarterly and with the benefit of hindsight, performed against SCHD and SPY since the ETF’s launch.
Portfolio Visualizer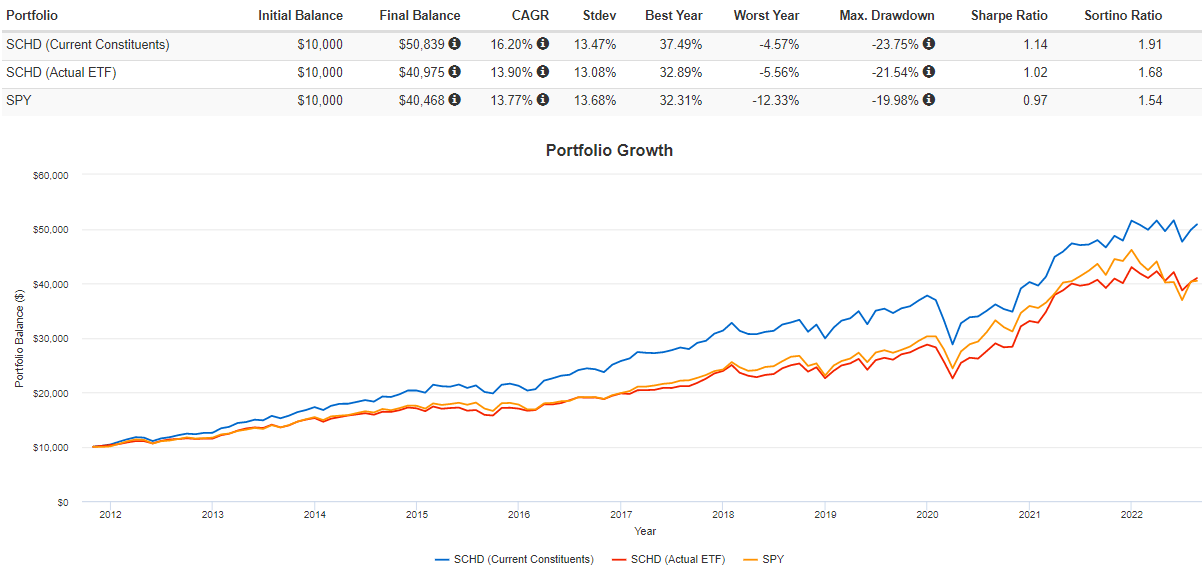
The results are excellent, but since they’re superior to the actual ETF’s returns, it suggests the portfolio relies on its best performers to do the heavy lifting. Also, there were likely some failed investments over the years and those that failed to raise dividends consistently. In short, this backtest is a decent start, but it’s far from ideal at best and misleading at worst. We can do better.
Let’s Get To 1993
It’s 2011, and we’re nowhere near where we need to be, so let’s keep eliminating holdings until we get enough of a track record to compete with SPY. I did that one by one using Portfolio Visualizer’s Backtesting Tool and ended up with 65 holdings. These 65 holdings account for a remarkable 85% of SCHD’s current weight.
I ran the same backtest as before but also a second equal-weight version to help control for hindsight bias. This step is crucial because assigning high weightings to companies like PepsiCo and Coca-Cola is unfair when we already know how well they’d perform.
Portfolio Visualizer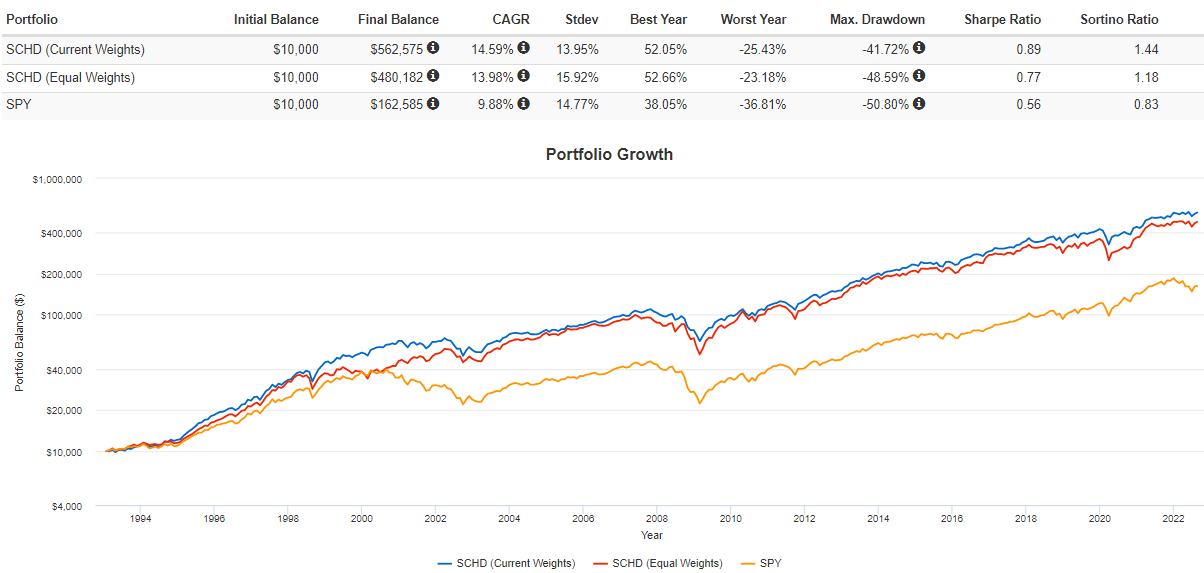
This 65-stock equally-weighted portfolio gained an annualized 13.98% compared to 9.88% for SPY. Importantly, risk-adjusted returns (Sharpe and Sortino Ratios) were better, with the key negative being higher volatility. The results are worse than the portfolio based on current weightings but also more realistic. No longer are we relying only on the top stocks to drive performance.
SCHD Core Holding Performances: 1975-1990
Turnover is a risk for any fund, and even though I think SCHD is one of the best dividend ETFs around, I still found time to criticize it almost one year ago. It’s part of keeping myself honest and acknowledging that no ETF is perfect.
That said, SCHD has its fair share of staples. By staples, I mean stocks that are consistently selected each year. After evaluating Schwab’s annual reports since 2012, I’ve identified the following ten current holdings that routinely show up with weights above 3%.
- PepsiCo (PEP)
- Home Depot (HD)
- Texas Instruments (TXN)
- Coca-Cola (KO)
- International Business Machines (IBM)
- Pfizer (PFE)
- Automatic Data Processing (ADP)
- Lockheed Martin (LMT)
- Verizon Communications (VZ)
- Altria Group (MO)
Currently, these stocks total 38.22% of the ETF. Call them SCHD’s top ten core holdings, with several founded over 100 years ago.
To combat high inflation, Paul Volcker, the Federal Reserve Chairman at the time, took the Federal Funds rate from an average of 11% in 1979 to 20% in June 1981. Some argue that such aggressive policy is required today, but I think even more doubt the resolve of the current Chairman.
St. Louis Federal Reserve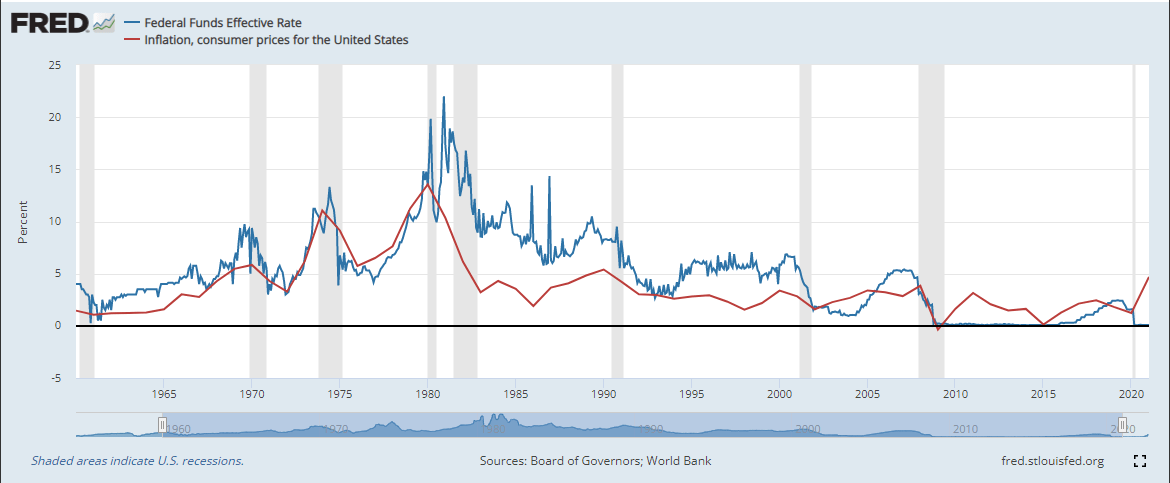
The graph above shows the Federal Funds Rate rose above the annual inflation rate beginning in 1980. Inflation quickly subsided, and the Federal Funds Rate remained above the inflation rate until the Tech crash in the early 2000s, except for a brief period in 1993. After the Great Financial Crisis ended in February 2009, the Federal Funds Rate remained below the inflation rate for almost an entire decade.
Currently, the Federal Funds Rate is 2.33%, within the target range of 2.25% to 2.50%. The latest CPI reading, summarized below by Hoya Capital, was 8.48%. The Michigan Consumer Sentiment survey reported one-year inflation expectations to be 5.0% and five-year inflation expectations to be 3.0%. It’s the latter one the Fed pays the most attention to, but still, no matter how you slice it, higher interest rates probably are needed.
Hoya Capital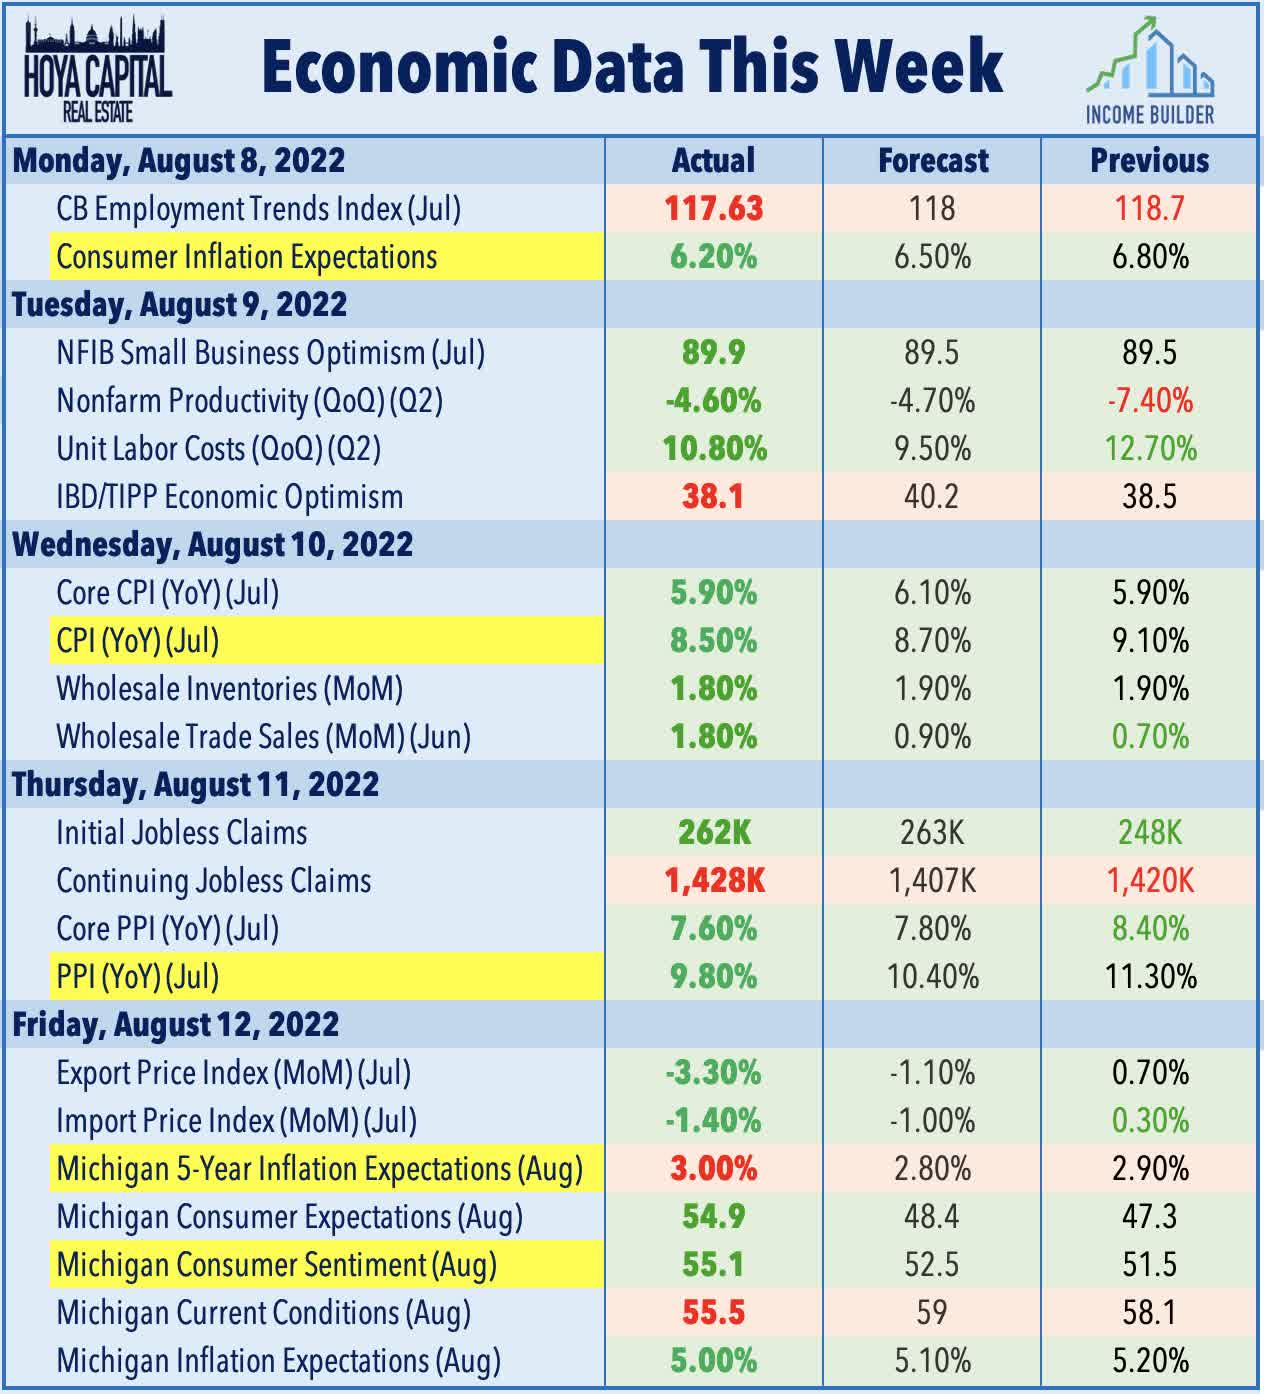
So can SCHD handle a scenario like the 1980s when the Federal Funds Rate exceeded the annual inflation rate? Again, let’s not rely on SCHD’s short history. We can turn right to the constituents themselves. Here are the annual price returns (excluding dividends) for the top 20 with trading histories dating back to 1985. Ten of these were trading in 1980. I’ve included annual returns from 1975-1990 because it’s essential to see how they performed when inflation was heating up, peaked, and finally subsided.
The Sunday Investor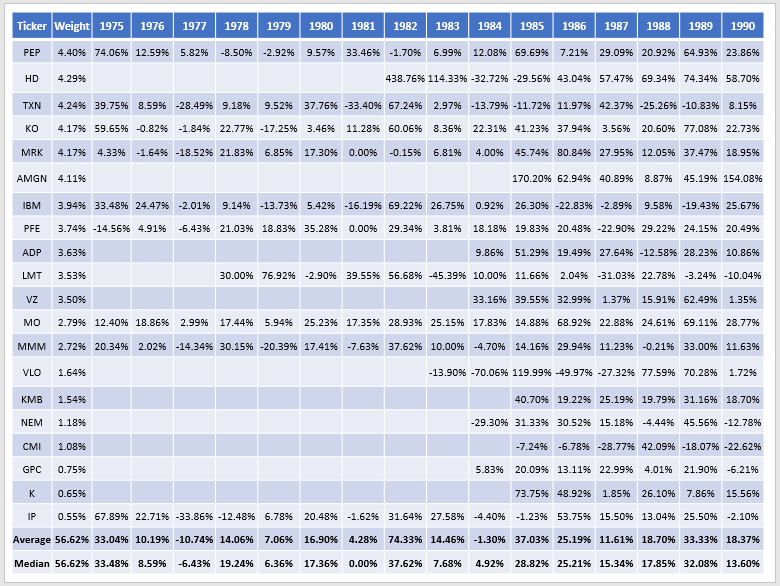
Here, we see that of the ten trading in 1980 (34% of the current weight), the average and median returns were 16.90% and 17.36% that year. In the two years preceding peak inflation, median returns were 19.24% and 6.36%, and in the two years after peak inflation, median returns were 0.00% and 37.62%.
According to MacroTrends, the S&P 500 lost 9.73% in 1981, but PepsiCo and Lockheed Martin delivered 30%+ price returns. During the 1990 recession, when the S&P 500 declined 6.56%, nearly all of these 20 stocks held up well. Why? Because when the chips are down, company profits, and by extension, dividends, matter. Investors turn to what they know.
The Kenneth French Data Library
The Kenneth French Data Library provides lots of free, historical data for anyone wanting a better understanding of the history of the U.S. stock market. Specifically, the library provides annual and monthly returns of value- and equal-weighted portfolios formed based on factors like:
- size
- book-to-market ratio
- operating profitability
- investment (change in total assets)
- earnings-price ratio
- cash flow-to-price ratio
- dividend yield
There are all sorts of multi-variate portfolios for those wishing to combine factors like size and earnings-price ratio, but let’s keep things simple and isolate two factors: operating profitability and dividend yield.
Portfolios Formed By Operating Profitability
You may wonder why I’m leading with operating profitability rather than dividend yield. The reason is that, despite SCHD’s robust yield features, its profitability rating stands out more. As part of my weekly process, I calculate dozens of fundamental metrics for nearly 800 U.S. Equity ETFs and rank them against peers across 40 categories. There are 26 high-dividend ETFs, including SCHD, and SCHD’s weighted-average profitability score (according to Seeking Alpha) is 9.32 on an adjusted ten-point scale. That’s the third best for the category and 11th-best out of all 65 dividend ETFs.
The following graph highlights the annual returns from 1975-1990 for three portfolios: one in the bottom 30% of operating profitability, one in the middle 40%, and one in the top 30%. I’ve included data callouts for the top 30% category, which SCHD solidly fits into.
Chart: The Sunday Investor; Data: Kenneth French Data Library
Notice how in 1980, the top 30% category gained 37.54% compared to 22.88% for the bottom 30%. Investors embraced not only highly-profitable companies but extremely volatile ones, as noted in this summary piece from the New York Times on January 1, 1981.
”After years of thinking that inflation is bad for the stock market, people this year began buying stocks as a hedge against inflation,” Donald B. Marron, president of Paine Webber Inc. and director of the Big Board, said in a telephone interview from a vacation spot in Nassau.
Mr. Marron probably wasn’t relaxing at Cable Beach the following year when the top 30% most profitable stocks declined by 7.55%. Still, the category combined for an annualized 12.77% gain over the two years, 1.19% better than the bottom 30% category. Then, in 1982, the market was back to 20% gains even as the Federal Funds Rate exceeded the annual inflation rate. As one pension manager reflected at the time:
Everybody thought the market was trapped in a Catch-22 situation – high interest rates meant tough competition for stocks and there was the fear that any economic growth would force rates even higher.
These statements should humble even the most bearish investor. Part of my approach is planning for the possibility that my outlook is wrong. I’m slightly defensive now, targeting a portfolio beta between 0.90 and 0.95, but it’s nothing extreme. One reason is that I don’t know how aggressive the Fed needs to be to combat inflation. S&P 500 earnings surprises continue to trend downward. There’s the war in Ukraine, concerns over an oil price shock, ongoing supply chain disruptions, and a cryptocurrency market that has a habit of frustrating fundamental investors like myself. In short, there are many unknowns, but sticking to well-established, highly profitable stocks seems like a winning strategy. That’s what SCHD offers.
Portfolios Formed By Dividend Yield
The Data Library provides value-weighted returns for four portfolios formed by dividend yield, as follows:
- non-dividend paying stocks
- bottom 30% of dividend-paying stocks
- middle 40% of dividend-paying stocks
- top 30% of dividend-paying stocks
In the S&P 500 Index, 395 companies paid a dividend last year. The average trailing dividend yield for the bottom 30% is currently 0.77%. For the middle 40%, it’s 1.98%, and for the top 30%, it’s 3.78%. Given SCHD’s trailing 3.21% yield, it’s closest to the top 30%, so that’s the one I’ve highlighted in the following graph.
Chart: The Sunday Investor; Data: Kenneth French Data Library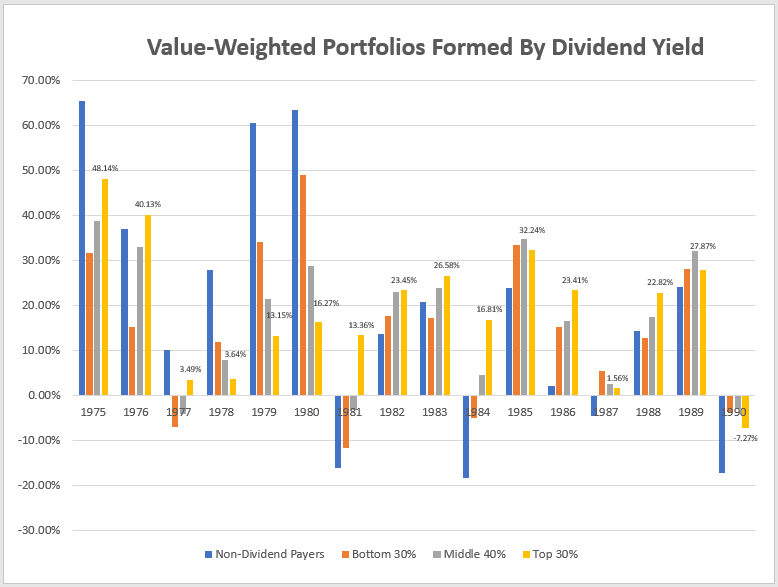
Notice how reliable the returns for dividend-paying stocks were across the entire period from 1975-1990. The top 30% category (yellow bar) even produced a 13.36% gain in 1981 when all other categories declined. Non-dividend paying stocks (blue bar) underperformed yearly from 1981 to 1990. Only after the recession ended in 1990 did investors find their appetite for risk again. Not shown here, but they outperformed the top 30% by 29.87% in 1991. I attribute this to breaking the nine-quarter trend of negative earnings surprises. Investors breathed a sigh of relief that year and were willing to take on more risk, just like they did in 2009 after the Great Financial Crisis.
As shown in the chart below, dramatic changes in earnings surprises provide investors with clear reasons to take on or avoid risky stocks. Most recently, we saw this in 2020 when earnings surprises were 20%+. The downward trend reversed the gains of risky stocks, and I look for signs that investor sentiment will improve each quarter. I don’t think we’re there yet.
Yardeni Research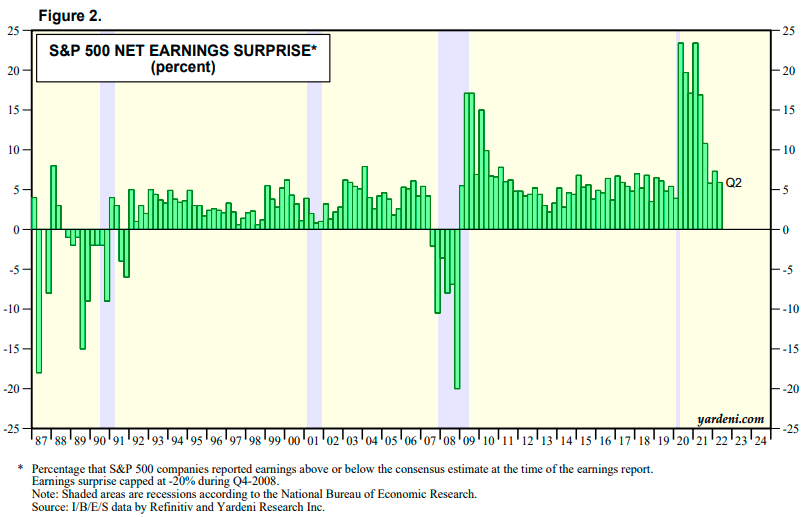
In any case, selecting highly profitable, dividend-paying stocks was successful in the early 1980s. It also just makes sense from a risk management perspective. Short of exiting equities altogether, which some may find appropriate, I think shifting your investments around within each asset class is a better solution. I hope readers don’t equate SCHD with U.S. equities in general because, as I will demonstrate next, the two are quite different.
SCHD: Fundamental Analysis
The following table compares SCHD’s fundamentals with a dozen other dividend ETFs you might own. I hope this summary provides insight into why I believe SCHD is an excellent dividend ETF, as it scores poorly on no metric, including fees, volatility, dividends, growth, valuation, and profitability.
The Sunday Investor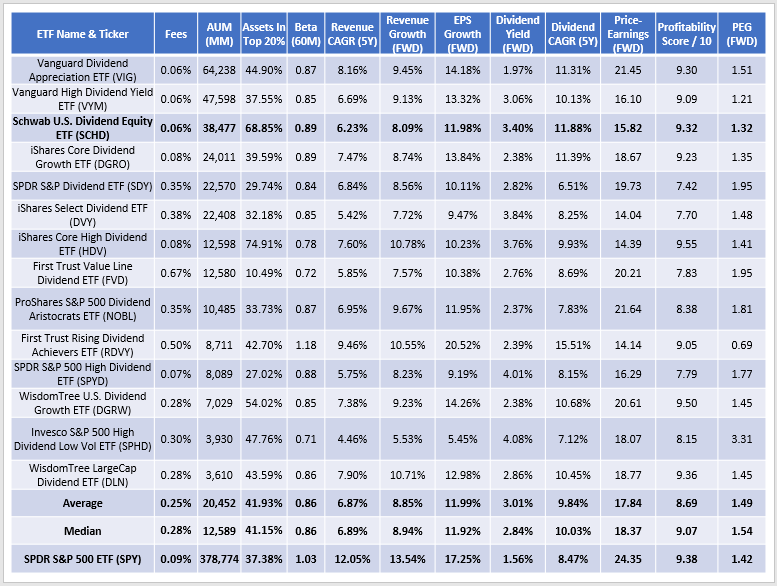
I mentioned how SCHD’s 9.32 profitability score places it 11th-best among all dividend ETFs. Among these largest ones, it’s fourth best behind HDV, DGRW, and DLN, but look at the dividend yield and growth you’re getting in exchange. SCHD’s constituents currently have a gross 3.40% yield and have grown dividends at an annualized 11.88% over the last five years. Among all 65 dividend ETFs, that growth is eighth-best and the highest among those yielding above 3%.
SCHD’s five-year beta is 0.89, just above the average and median for the sample. Its forward revenue and EPS growth rates may seem low, but then you look at its forward earnings valuation and see that it trades at a relative discount. For GARP investors, I’ve divided the estimated EPS growth rate into the forward price-earnings ratio to calculate a forward PEG ratio. SCHD’s 1.32 is third behind VYM and the tech-heavy First Trust Rising Dividend Achievers ETF (RDVY), reviewed here.
The only area SCHD where potentially suffers is diversification, given that its top 20 holdings comprise 68.85% of the ETF compared to the 41.93% sample average. However, further digging reveals that the top 20 industries account for 84% of the ETF, which is only slightly above average. ETFs like SPHD and RDVY regularly push 90%, while the average for all dividend ETFs is about 76%. In short, the assets in the top 20% figure may be alarming initially, but I don’t think SCHD is significantly less diversified than most peers. As for the industries behind these metrics, consider SCHD’s top 20 compared with SPY.
The Sunday Investor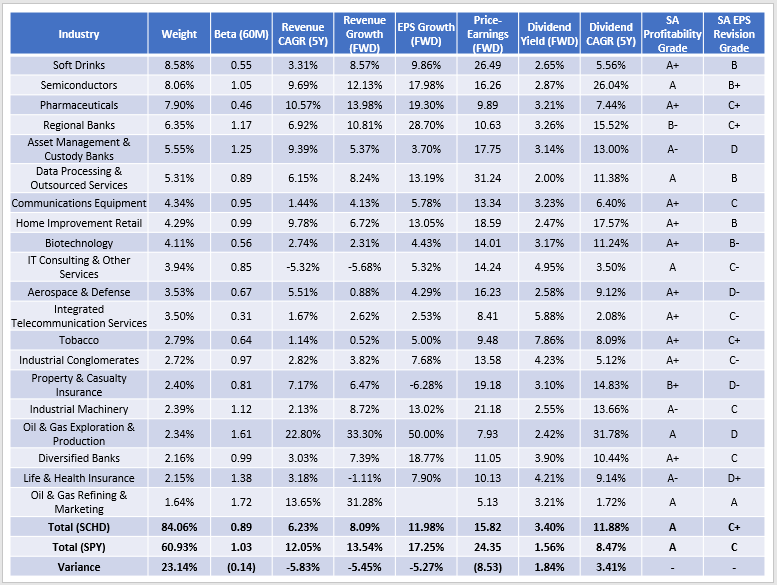
Soft Drink stocks like PepsiCo and Coca-Cola combine to total 8.58%, followed by low P/E stocks in the Semiconductor, Pharmaceuticals, and Regional Banks industries. There’s a nice mixture of low- and high-beta stocks, and analysts are more bullish on SCHD’s constituents, as indicated by Seeking Alpha’s EPS Revisions Grade (C+ vs. C). SCHD’s yield is 1.84% more, but it does give up a fair amount of growth potential. In my view, that’s its biggest weakness. Please reference the previous table for complementary ETFs if you share that view. VIG, VYM, and DGRO all stand out as low-fee options with better growth.
Regardless of how you weigh each factor, it’s clear SCHD has entirely different fundamentals compared to the broader market. If you’re still concerned about U.S. equities in a high-inflation environment, I think SCHD is much better equipped to deal with it than the more volatile SPY.
Investment Recommendation
A review of the evidence, including historical returns for SCHD’s current constituents, and data provided by the Kenneth French Data Library, strongly suggests SCHD is suited to deliver strong returns in a high-inflation environment. Since an ETF is merely a product of its holdings, we can infer that it actually has a terrific track record. Combined with my fundamental analysis that shows a 3%+ dividend yield, double-digit dividend growth, and strong ratings on various other metrics, I’m reiterating my buy rating on SCHD. Thank you for reading, and I look forward to discussing this further in the comments section below.
Be the first to comment