

DarrelCamden-Smith/iStock via Getty Images
We’re just over a week away from the beginning of the Q1 Earnings Season for the Gold Miners Index (GDX), and one of the first companies to release its preliminary results is Sandstorm (NYSE:SAND). Overall, the company had a solid quarter, reporting a new record for attributable gold-equivalent ounce [GEO] volume and sales. This was helped by the addition of new royalties last year. However, while the results were solid, some of this looks priced into the stock. So, with SAND trading at ~1.50x P/NAV, I don’t see any way to justify chasing the stock here above $9.00.
Hod Maden Project – Turkey (Company Website)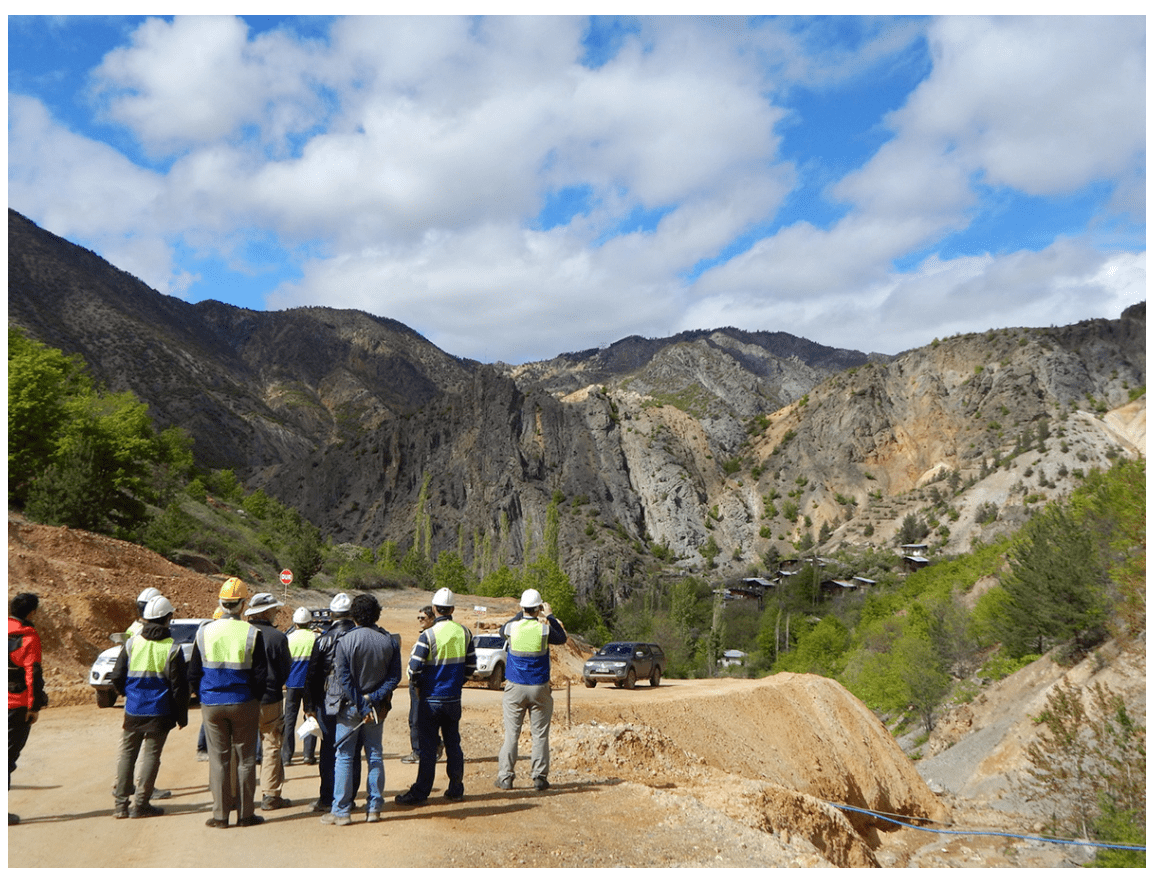
Sandstorm Gold released its preliminary Q1 2022 results last week, reporting a quarterly volume of ~18,300 GEOs, a new multi-year high for the stock that has allowed production to break out of a long-term range, a positive development. The increase in attributable production was helped by the company’s acquisition of a package of Vale royalties last summer and the acquisition of a gold stream with Vatukoula in Fiji. Combined, these deals add close to 10,000 GEOs per annum to its attributable production profile before the Vatukoula stream decreases after the 5.5-year fixed delivery period to a ~2.70% stream.
Sandstorm – Quarterly Attributable Gold-Equivalent Ounce Volume (Company Filings, Author’s Chart)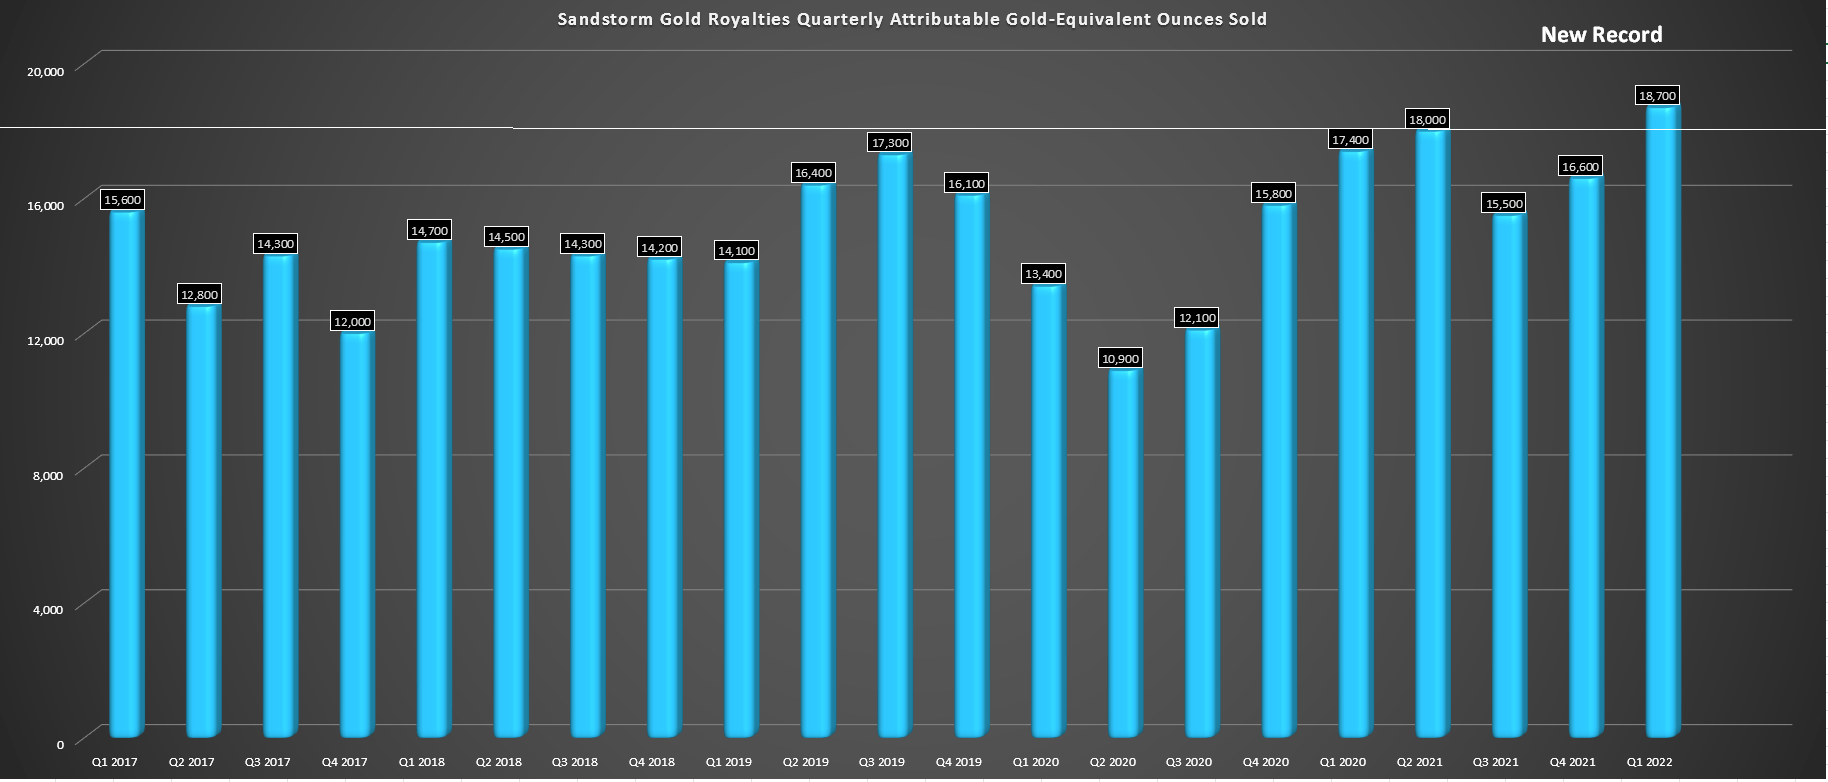
These deals were timed wisely for Sandstorm, which otherwise may have seen a dip in production in FY2022. This is because the company’s attributable production from Santa Elena was set to decline in FY2022, and has already begun to decline, which is related to First Majestic’s (AG) focus on the nearby Ermitano deposit, where Sandstorm does not have royalty coverage. Elsewhere, Sandstorm has seen a sharp decline in its contribution from the Karma Mine. The reason is that the five-year delivery period concluded in Q1 2021, with the stream now capturing just ~1.63% of annual production.
Sandstorm – Attributable GEO Volume Per Asset (Company Filings, Author’s Chart)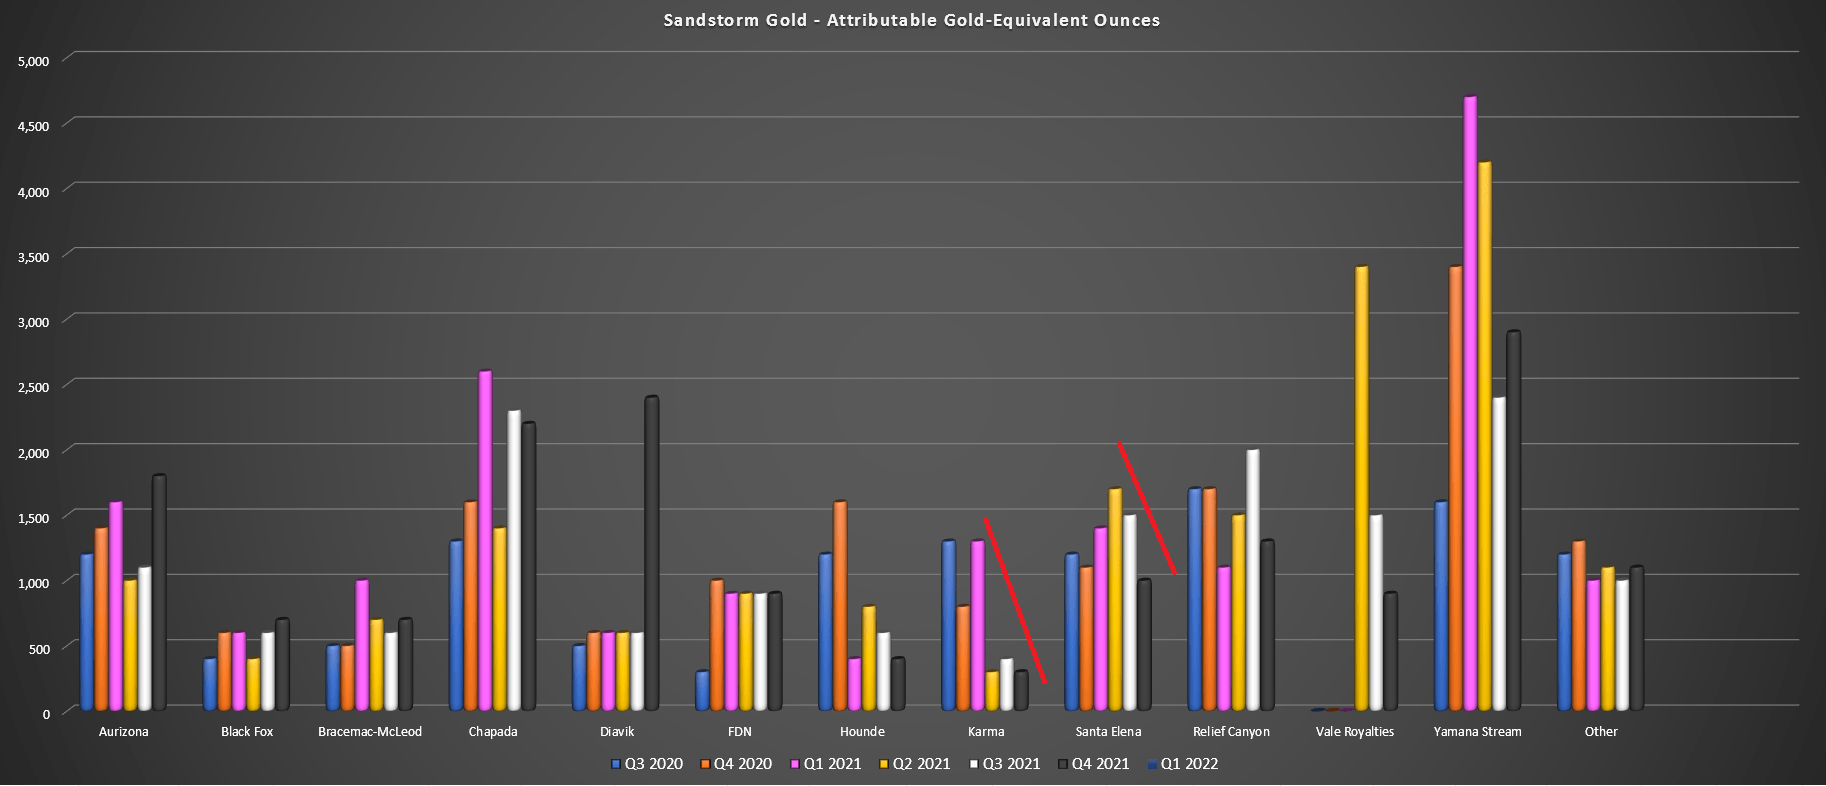
Given the solid attributable production results in Q1, Sandstorm’s revenue also hit a new record, benefiting from the strong gold price in Q1. As the chart shows, Sandstorm’s revenue was up 13% year-over-year to the preliminary revenue figure of $35.3 million, easily surpassing the previous record of $31.0 million. Given the continued strength in the gold price in Q2, with a quarter-to-date average price of $1,925/oz, Sandstorm is set up for another strong quarter for revenue, assuming the gold price can hold above the $1,850/oz level.
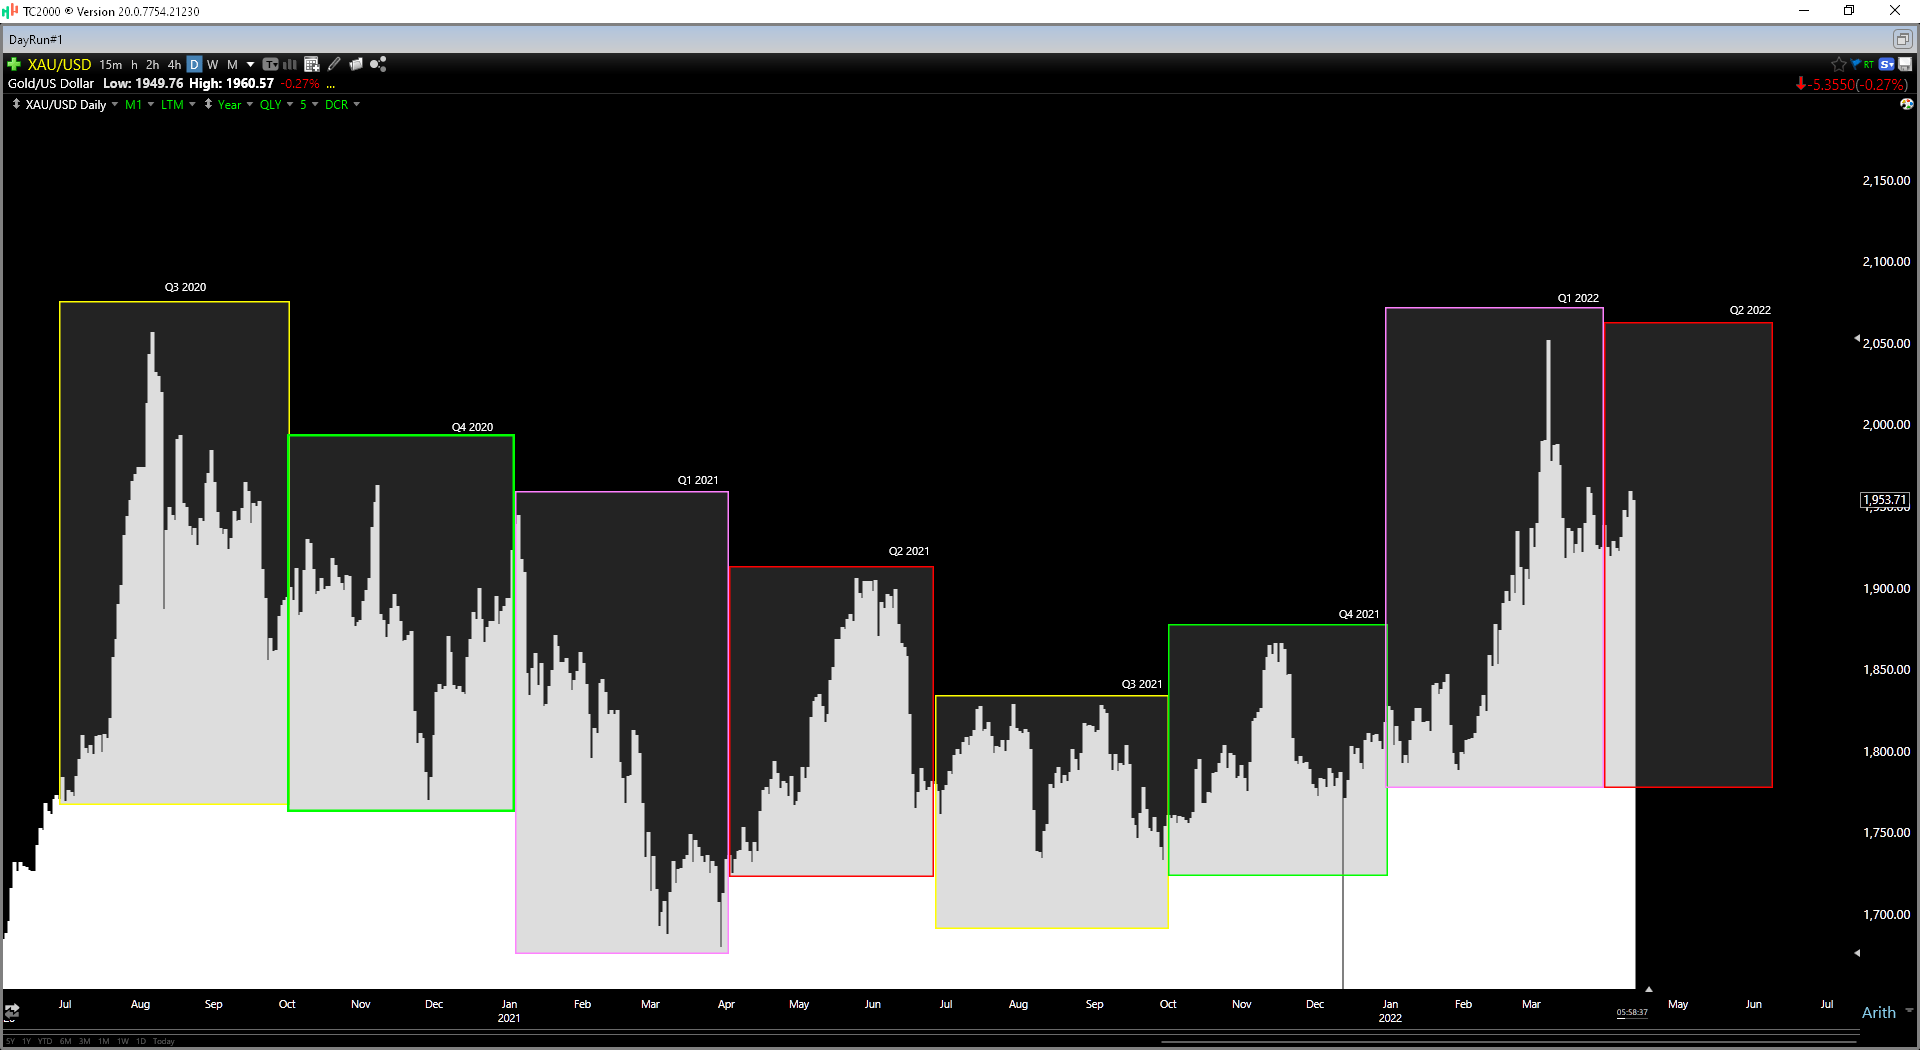
Sandstorm – Quarterly Revenue & Average Realized Gold Price (Company Filings, Author’s Chart) Gold Futures Price (TC2000.com)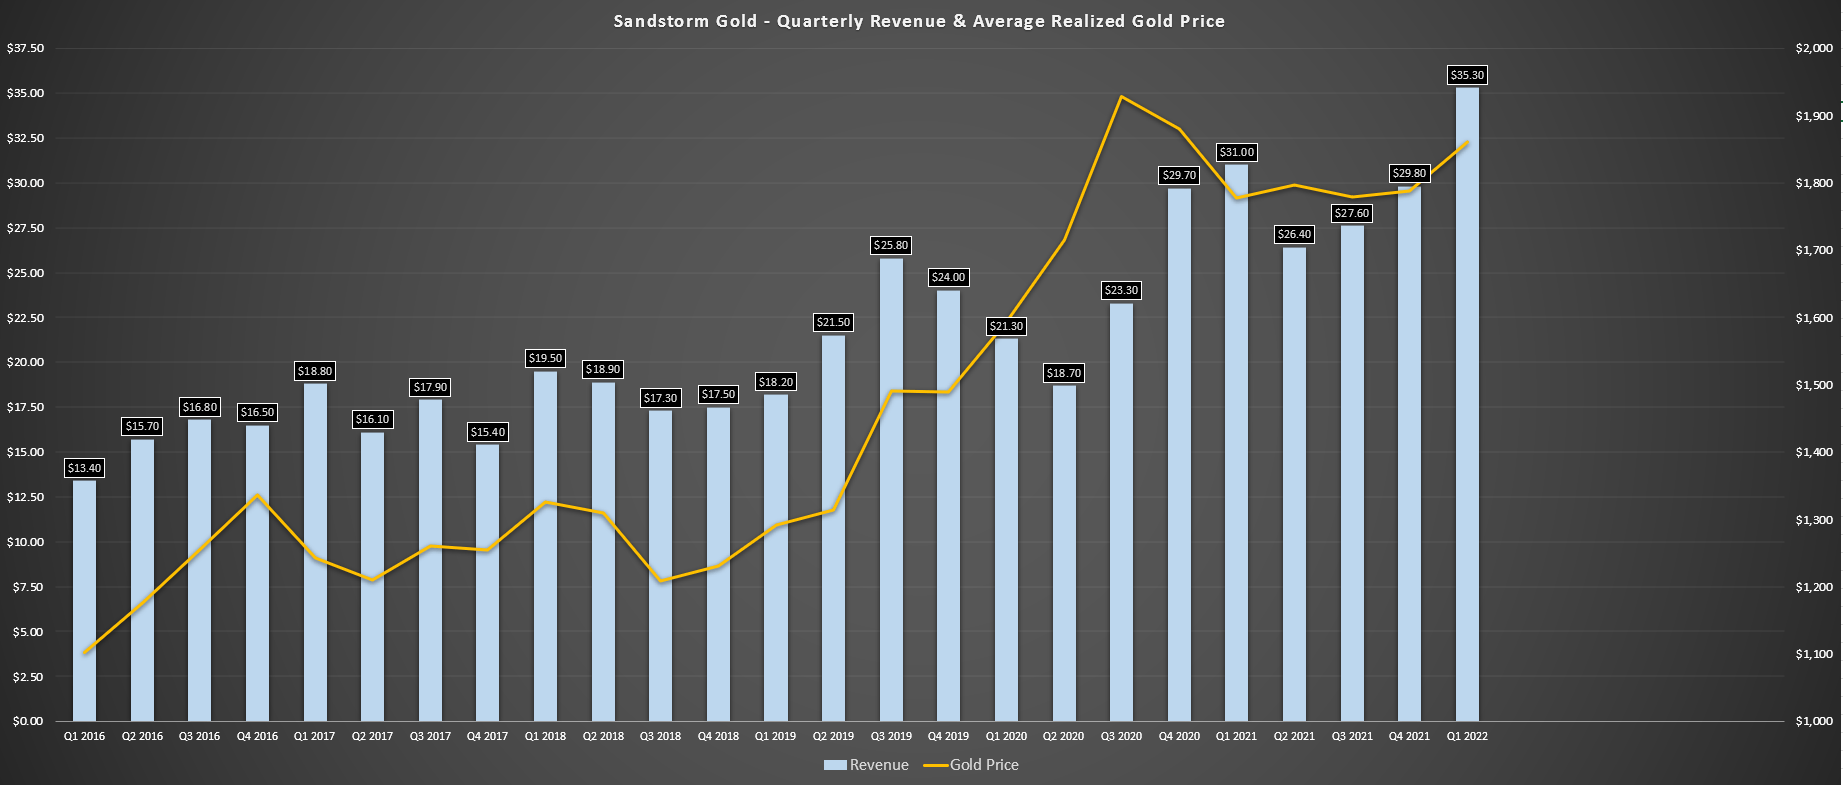
Long-Term Growth
If we look out longer-term, Sandstorm certainly differentiates itself from the largest companies in its peer group, which struggle to grow production at more than 20% per annum due to their size. In Sandstorm’s case, the company has a path to ~50% production growth by FY2025, assuming the Hod Maden Project comes online at a similar period to the updated estimate of 2025. However, while the below chart presented by Sandstorm might imply that it should trade at a healthy premium to peers, there are a few points worth making clear.
Sandstorm Gold – Long-Term Production Forecast (2021-2025) (Company Presentation)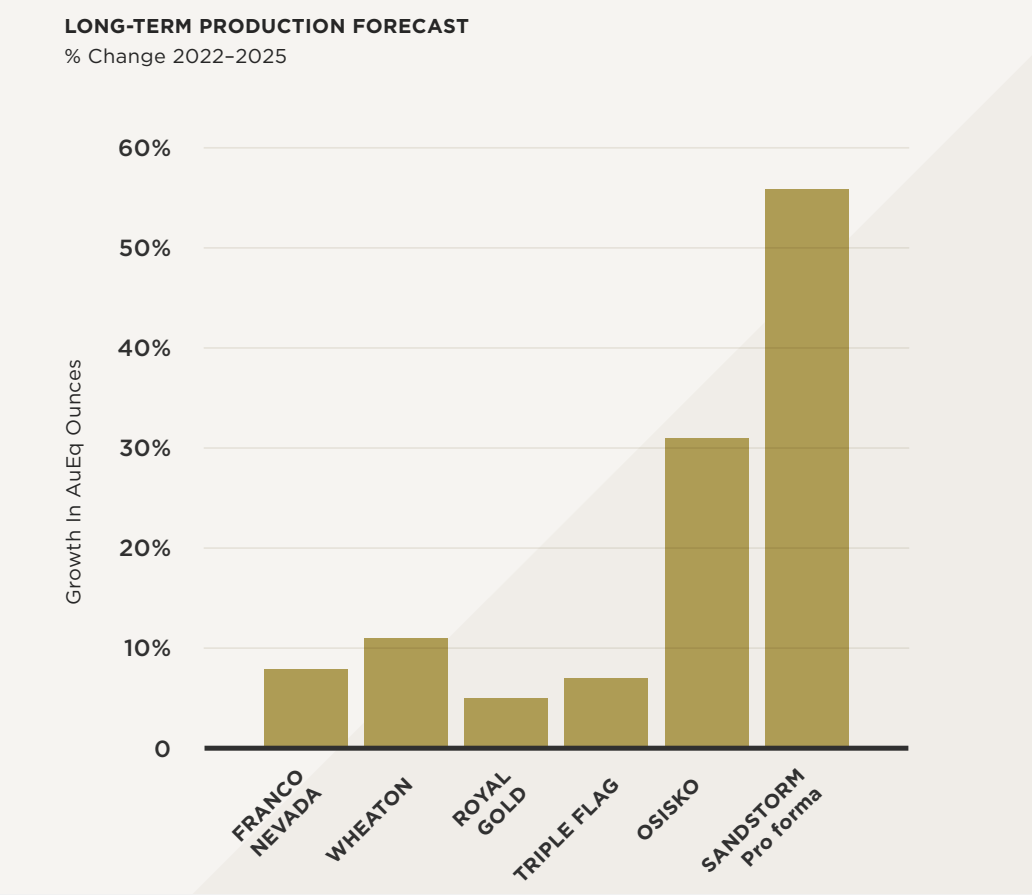
The first is that Sandstorm is not a great comparison with mature companies like the largest cap royalty/streamers, and it’s not difficult to point out a growth profile higher than mature peers. In fact, Sandstorm comparing itself to Wheaton would be akin to Eldorado Gold (EGO) comparing itself to Barrick Gold (GOLD) and pointing out that it has a higher growth profile. While certainly true, it isn’t that impressive an achievement given that both companies are at completely different stages.
Peer Production Long-Term Production Forecast (2021-2025, and 2022-2025) (Company Presentation, Author’s Notes & Drawings) Sandstorm Long-Term Production Forecasts (Company Presentation)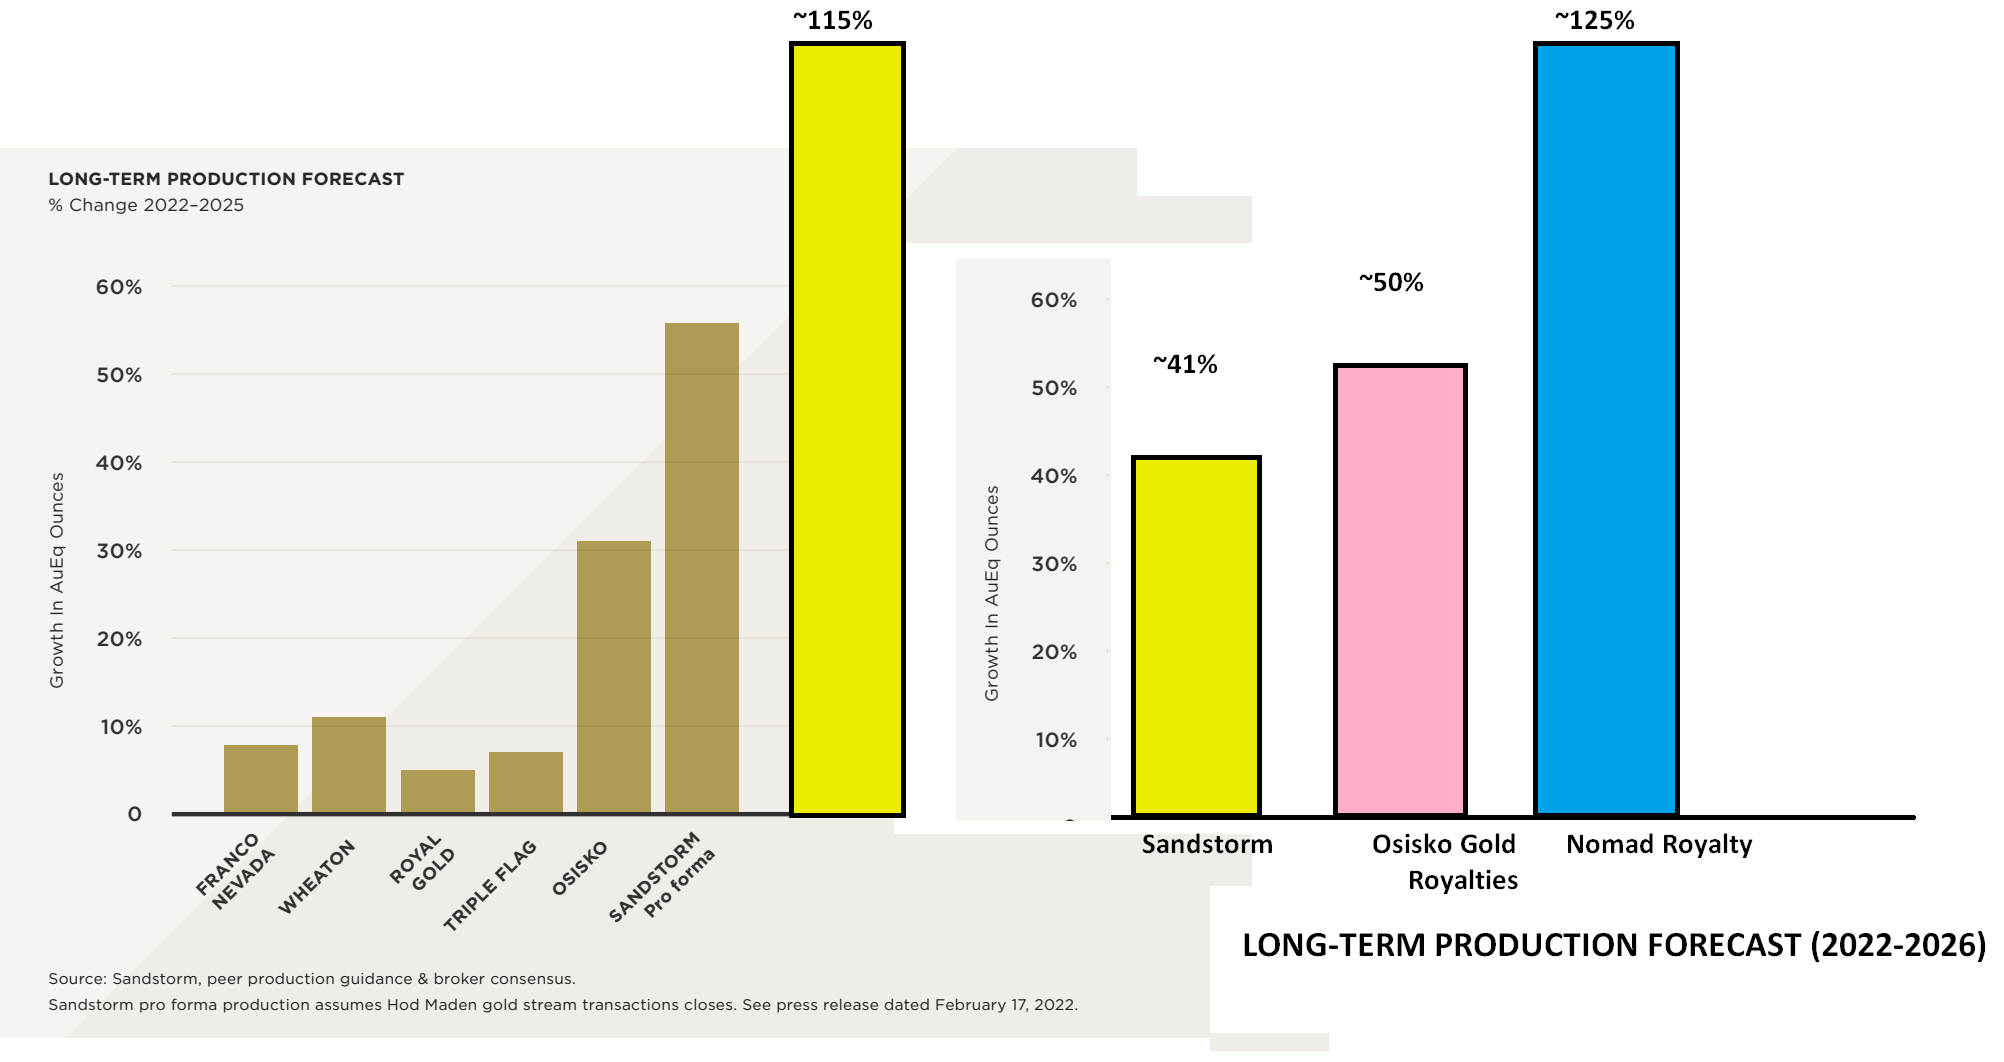
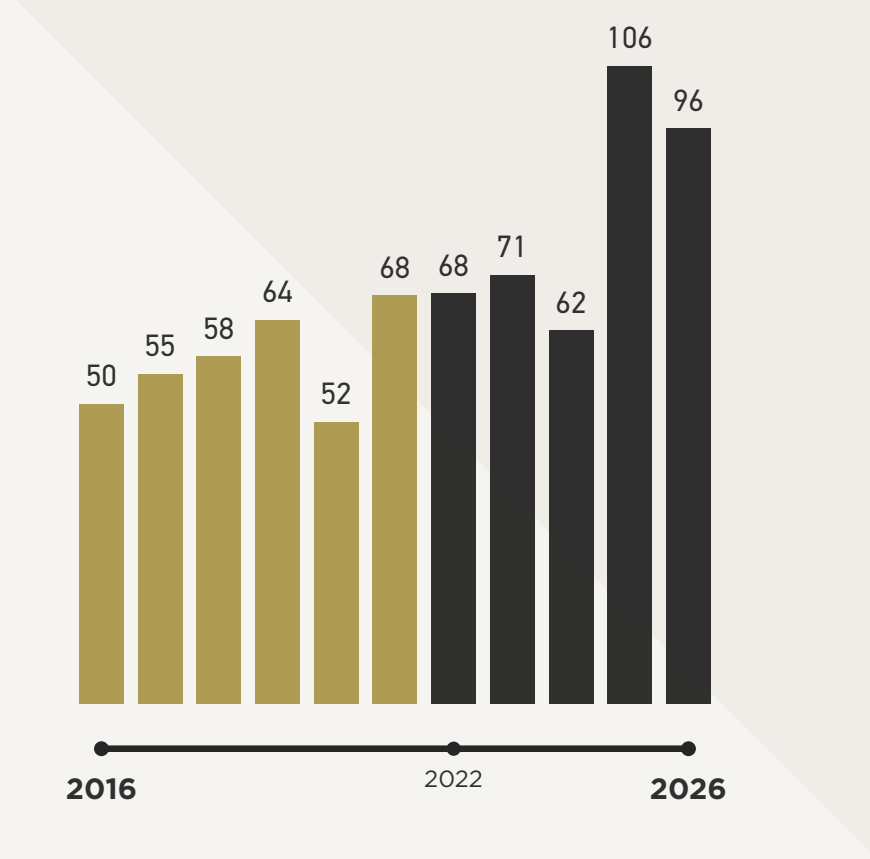
Meanwhile, Sandstorm has not only picked a convenient comparison period (2021 to 2025), but it’s also left out some of its peers who are actually closer comps than the ones it’s chosen to include. If we address the first point, Sandstorm’s production is expected to drop off slightly in FY2026, while the production profile of closer peers is forecasted to push higher. This is evidenced by the chart I have drawn in, which shows that Osisko Gold Royalties actually has a much higher growth rate than Sandstorm if we simply use the 2022-2026 period (50% vs. 41%).
In addition, while Sandstorm has included companies that produce 600,000 more GEOs per annum than it (Wheaton, Franco-Nevada), it has excluded companies that produce within ~50,000 GEOs of it, like Nomad Royalty (NSR). If we were to add Nomad Royalty onto the first and second charts, we can see that Nomad’s growth would dwarf that of Sandstorm, with the potential to grow production by 115% and 125% in the FY2022-FY2025 and FY2022-FY2026 periods. Hence, while Sandstorm has a respectable growth profile, it’s actually lower than that of Nomad and Osisko, depending on how one chooses to frame their charts and relevant comps.
Finally, while Sandstorm does have a solid growth profile, much of its incremental growth comes from one key asset, Hod Maden, which is not the case with its similar or higher-growth peers. This is because both Osisko Gold Royalties and Nomad have multiple assets contributing to their growth and organic growth from within their portfolio is also a large contributor (assets already in production). Meanwhile, Sandstorm relies on mostly one asset that’s already tracking nearly four years behind Sandstorm’s initial guidance of 2021 production. For this reason, I would argue there is more risk to this growth outlook, with a lot of eggs in one basket.
“And then finally I am just going to speak to one slide here which is a reminder of what the new Sandstorm looks like. This is an analysis of who our counterparties are and how strong they are over time. And you can see that in 2010, 100% of the ounces attributable to the Sandstorm came from junior mining companies. And everyone here is aware we have been working very hard to change that. Currently, in 2017, that number is now 71% majors and mid-tier. And based on Cerro Moro ramping up by 2019 and Hod Maden coming on in 2021, we expect that majors and mid-tier counterparties will account for 95% of the ounces bought or sold.”
– Nolan Watson, Sandstorm CEO, Q2 2017 Conference Call
Valuation & Technical Picture
Looking at Sandstorm’s historical cash flow multiple below, we can see that Sandstorm has typically traded at ~17x cash flow. Following the recent rally, the stock trades well above this historical multiple at ~20.5x FY2022 estimates. I would argue that given the improvement in its business model (simplified model with Horizonte Copper), Sandstorm could command a slight premium of 20x cash flow. However, even at this premium multiple, Sandstorm is still trading right near fair value, as shown below.
Sandstorm – Historical Cash Flow Multiple (FASTGraphs.com)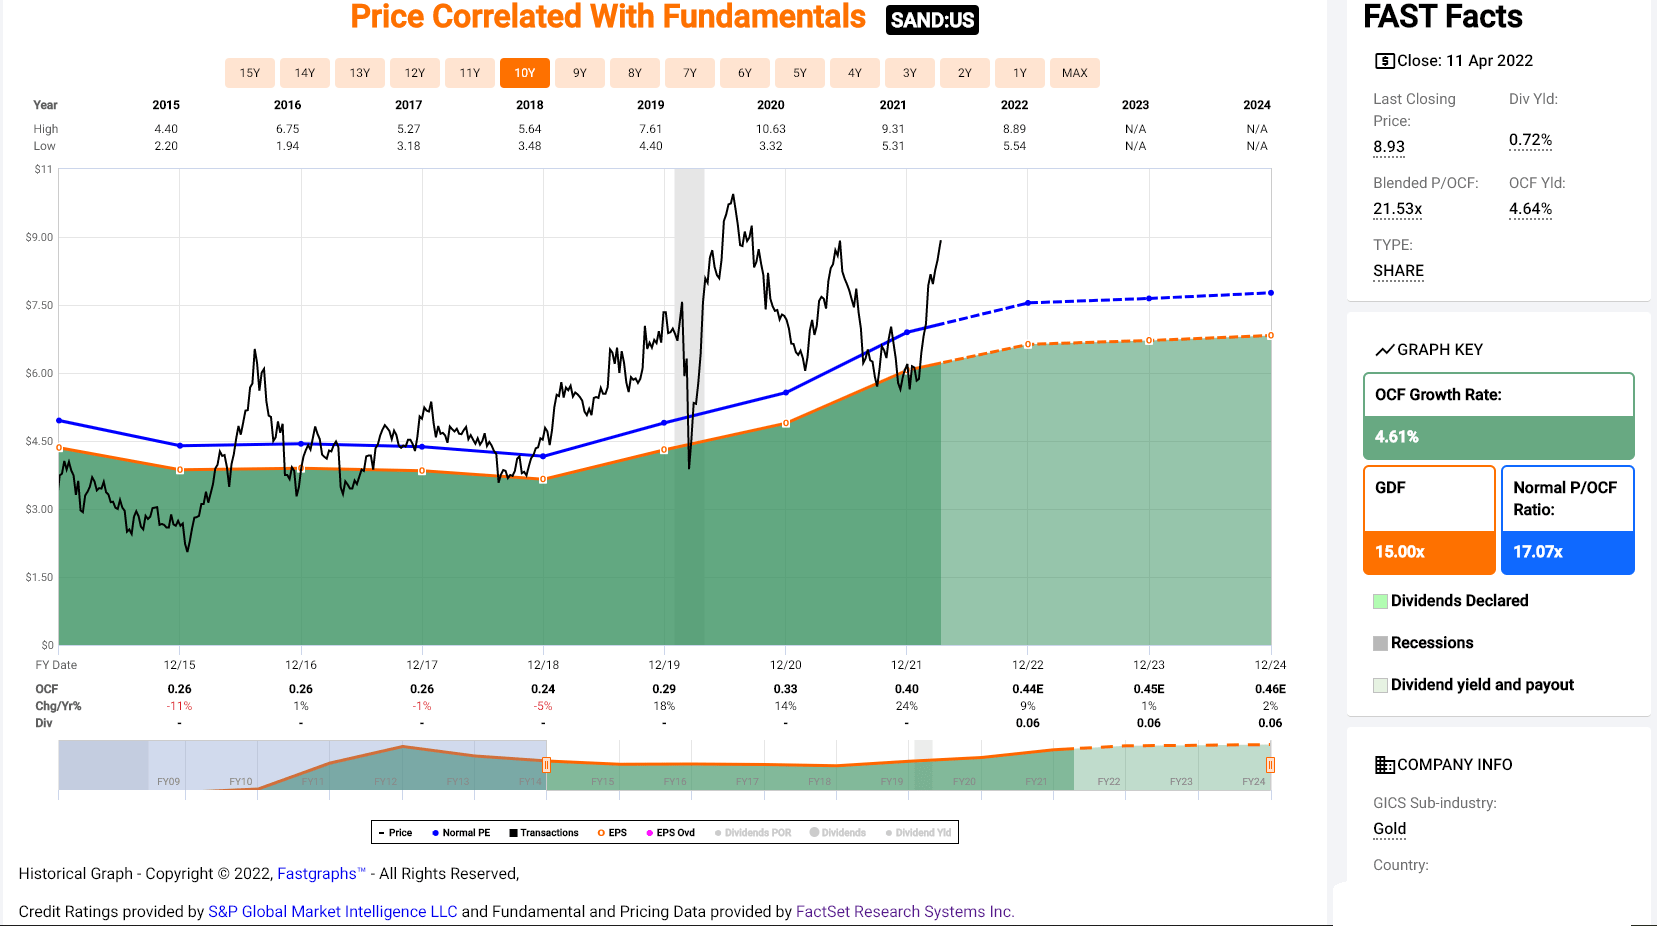
Meanwhile, Sandstorm also looks close to fully valued from a P/NAV multiple standpoint, trading at approximately ~1.50x P/NAV. This is based on Sandstorm sporting a market cap of ~$1.78 billion (fully diluted) vs. an estimated net asset value of ~$1.20 billion. While this figure may seem cheap compared to large-cap royalty names like Franco-Nevada (FNV), Sandstorm does not belong in that peer group. Instead, it’s a closer peer to names like Osisko Gold Royalties, which trades at ~1.1x P/NAV.
The fact that Sandstorm trades at a premium to its more relevant peer group (~40,000 – ~100,000 GEO royalty/streamers) does not mean that it can’t head higher from here. However, with Sandstorm and Triple Flag (OTCPK:TRFPF) trading at a premium to their peers, I see much better value in names like Osisko Gold Royalties and Nomad. This is especially true given that these two companies have similar or superior growth profiles to Sandstorm and pay much higher dividend yields.
Peer Group Dividend Yield (Nomad Royalty Company Presentation)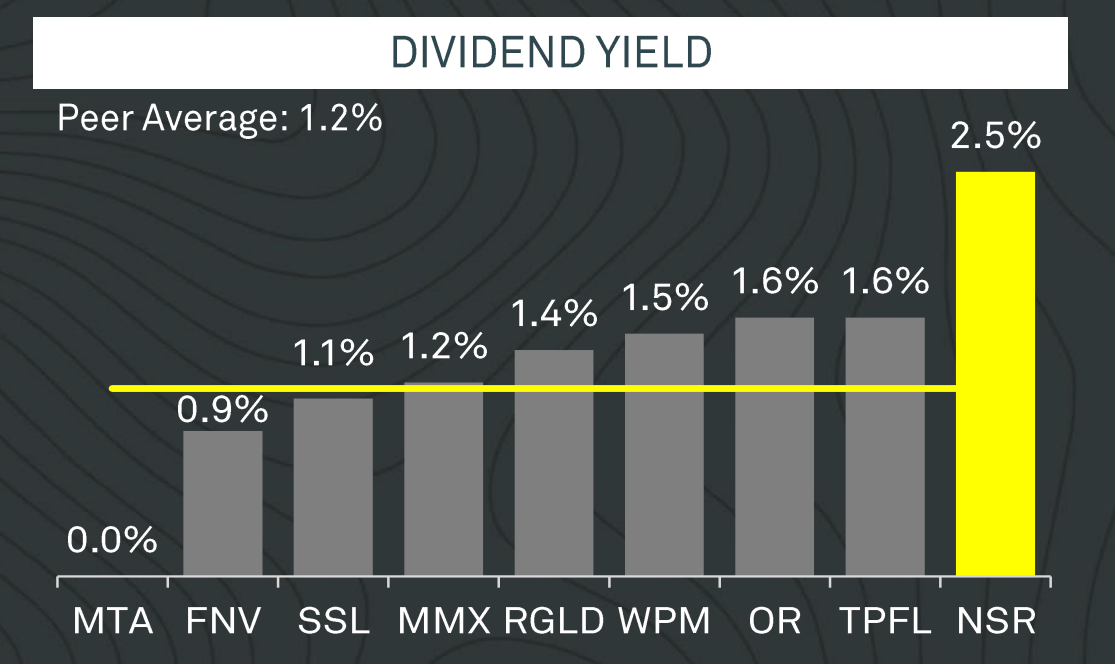
Finally, if we look at Sandstorm from a technical standpoint, the stock has found itself in the upper portion of its trading range, with an unfavorable short-term reward/risk profile of 0.35 to 1.0. This is based on the stock having strong resistance at $9.95 and no strong support until $6.30. Generally, when the reward/risk profile degrades to this level, it’s not a bad idea to book some profits, especially if a stock is approaching fair value from a fundamental standpoint.
SAND Daily Chart (TC2000.com)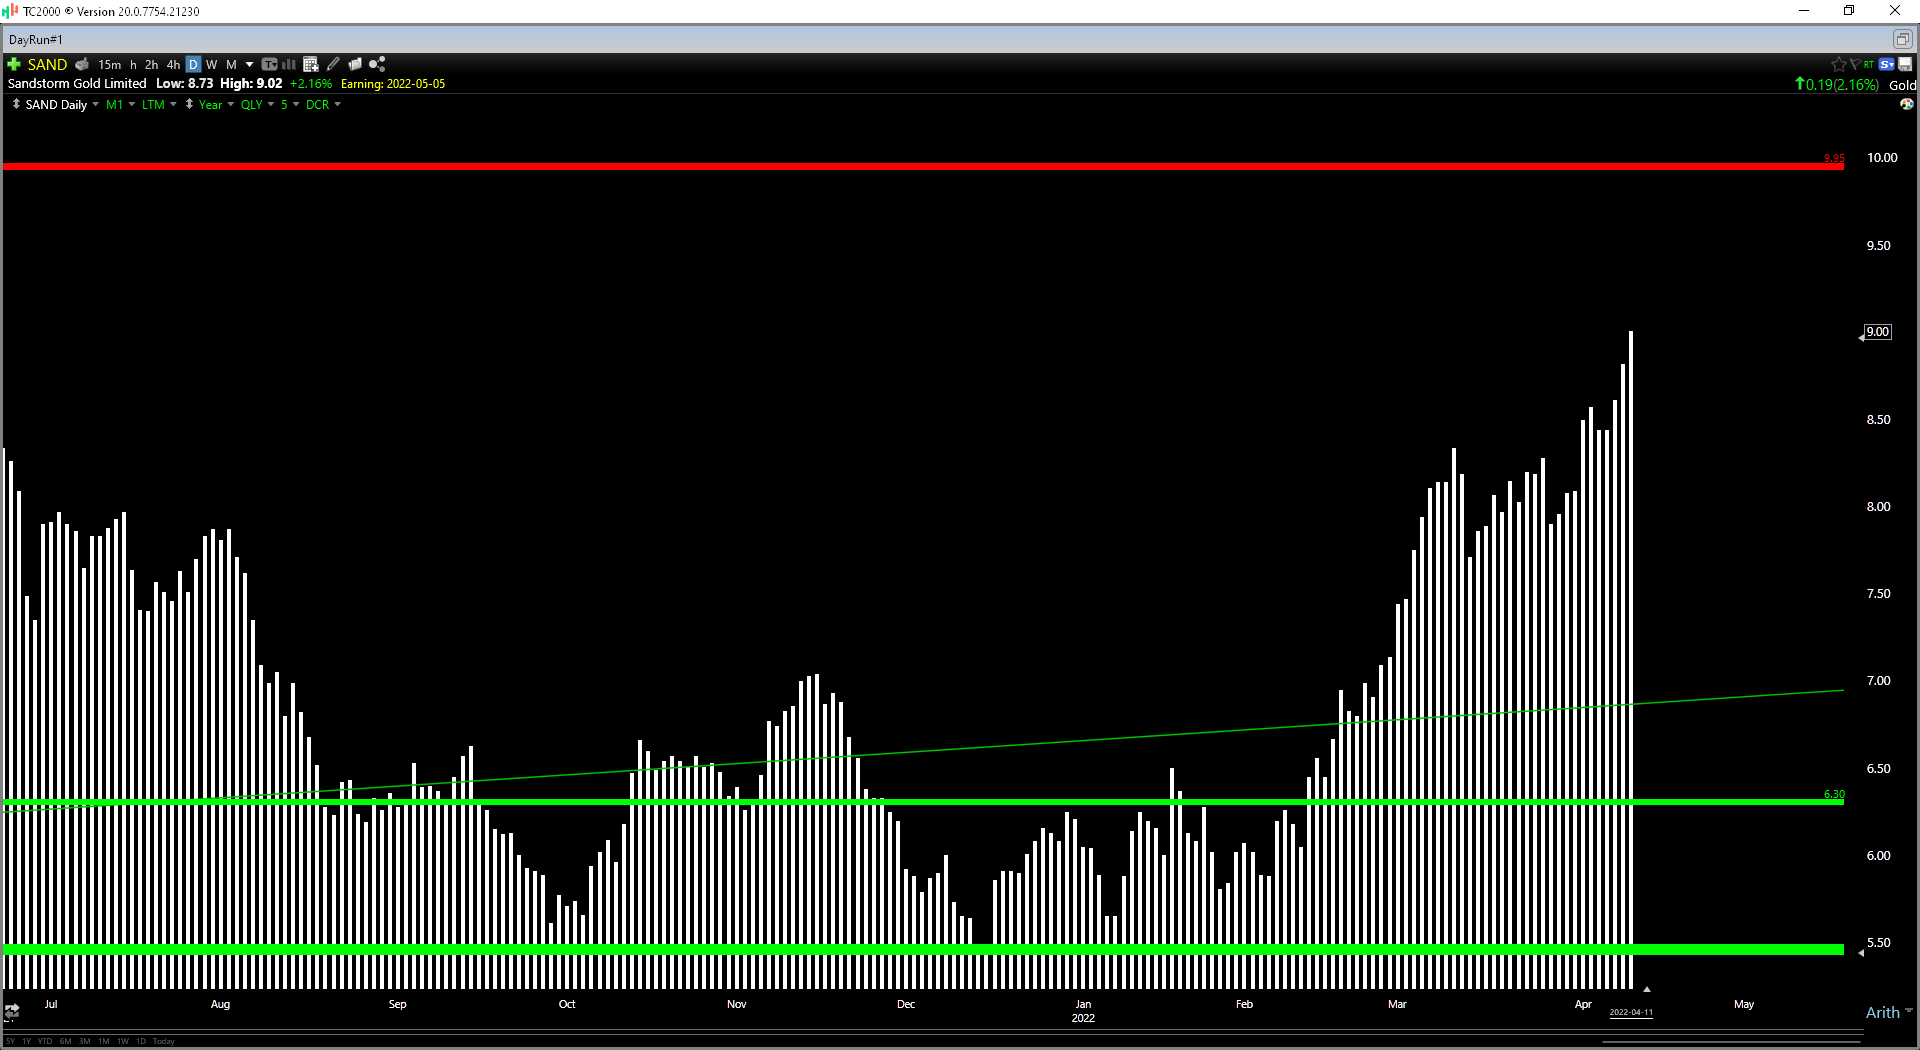
Sandstorm had a solid start to the year and should come close to the ~70,000 GEO mark in 2022. However, after a sharp rally higher that has extended into early Q2, I don’t see much upside as the stock gets ready to report earnings in the next few weeks. For this reason, I see this rally above $9.00 as an opportunity to book some profits from a tactical standpoint. For investors looking for growth at a more attractive price in the royalty/streaming space, I continue to favor names like Nomad, which have the potential to more than triple attributable production from FY2021 to FY2026 (~16,400 —> ~52,000+ GEOs).
Be the first to comment