

jaturonoofer
We have covered Safehold Inc. (NYSE:SAFE) before and also discussed its parent iStar (STAR) in a different article.
When we last covered SAFE we had a clear message.
A trough would come next year in the stock as it trades at 12X-15X earnings ($25-$30), which would still be more than 25X-30X operating cash flow. We are actually long the iStar Inc. PFD G 7.65% (STAR.PG) as we think that STAR will merge with SAFE and redeem the most expensive cost of financing, the preferred shares. So we love the idea of lending to SAFE, and we might even buy their bonds if we get a 6% plus yield. But we think equity holders will have a hard time clawing back losses. Regardless of how it plays out, it will be interesting to watch.
Source: The Bubble And Its Consequences
Now the market loves to mess with investor minds and it certainly did mess with our thinking. We are talking about this.
Seeking Alpha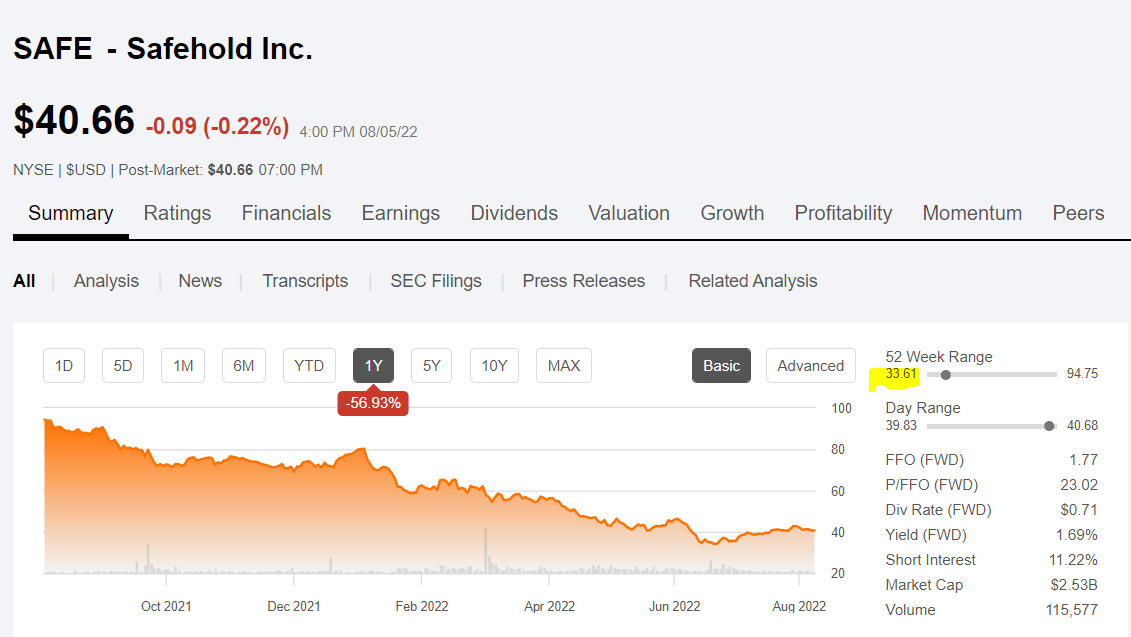
The stock did get quite close to our target and reversed nicely. Do we close the chapter on the downside? We look at the Q2-2022 results and tell you why we think we are not close to being done.
What Is The FFO?
When you see earnings from REITs, the GAAP numbers, pretty much everyone disregards them and focuses on the funds from operations (FFO). Why is that? Well, the main reason is that the true earnings power and the true dividend paying power, lay in the direction of FFO. Now, SAFE reports GAAP earnings and that is the headline number you see. You won’t find a FFO in their numbers despite the fact that it is a REIT.
In their defense, GAAP numbers have one thing working for them and that is that since most of their asset base is actual land, there is no depreciation. So from that perspective, GAAP works. But from a dividend paying perspective, GAAP EPS is so far removed away from reality that one cannot even think about using that. Let’s look at the Q2-2022 numbers as an example. The reported GAAP numbers were at 37 cents. For the first six months, this totaled 79 cents. Both are shown below.
SAFE 10-Q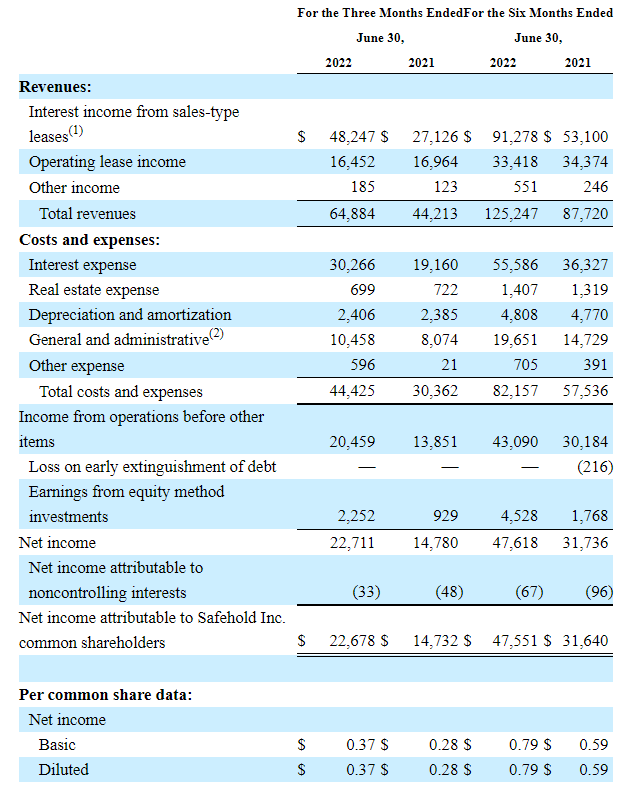
At first glance, that looks like amazing growth and one that really covers the dividend by a huge margin. But the cash flow tells a very different story.
Cash Flow
Starting with the $47.6 million net income, we have the statement of cash flows below.
SAFE 10-Q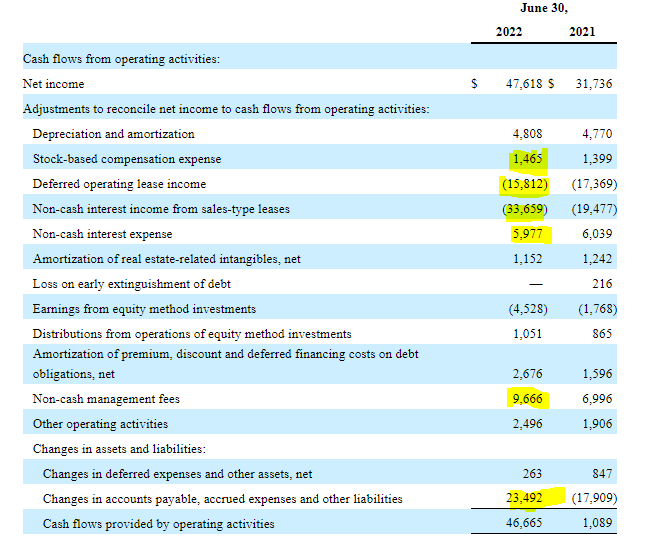
We have highlighted a few items and we will go through them in 3 groups.
1) Changes in working capital, which is $23.492 million. To get to real cash flow we always assume that this number is not there. If it is positive, we subtract it out and vice versa. So cash flow without this was $23.2 million. In 2021, we would add this back and get to about 19.0 million. You can see how our adjusted numbers make more sense than the raw ones presented. This $23.2 million for 2022 is our baseline cash flow and as you can see, it is half the net income.
2) The second group is the one in the middle.
SAFE 10-Q
As a huge portion of SAFE’s revenues are earned from a GAAP point of view, but actually paid way later (we are talking decades here), they are subtracted from cash flow. The last line adds to cash as SAFE also has debt in which the interest is paid later.
3) The final aspect here are the stock based compensation and non-cash management fees. They total about $11 million and if these were paid in cash, cash flow would have been about $12 million for the first half of 2022.
Dividend Paying Capability
If we go by the cash flow adjusted for working capital changes, SAFE could pay $23 million and actually paid $20.2 million in dividends.
SAFE 10-Q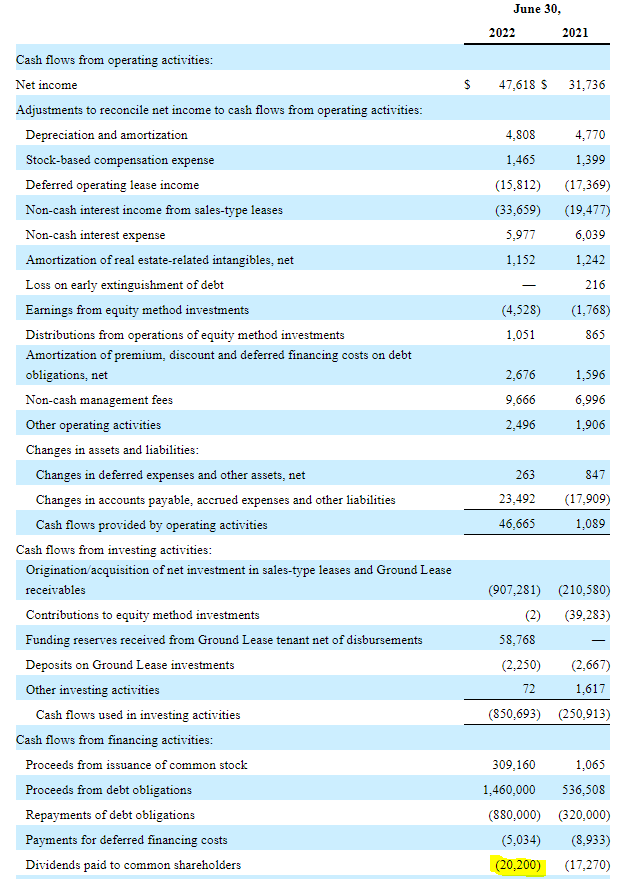
So in theory, it could boost the dividend a little more. But the free cash flow yield is close to the dividend yield of 1.7%, and nowhere close to earnings yield of 4.3%. Even this free cash flow yield would be about half the dividend yield, if stock based compensation and non-cash management fees were actually paid in cash.
Verdict
The bull argument is built on owning the building at the end of the lease. An extension of that is defaults will be extremely rare. We completely agree with those two facts, just not the interpretation of what those facts should mean. Strong triple net companies have historically had extremely low defaults. Here is Realty Income’s (O) 2009 report. FFO per share fell marginally (less than 3%) between 2007 and 2009. Dividends were raised by 10%.
Realty Income 2009 Annual Report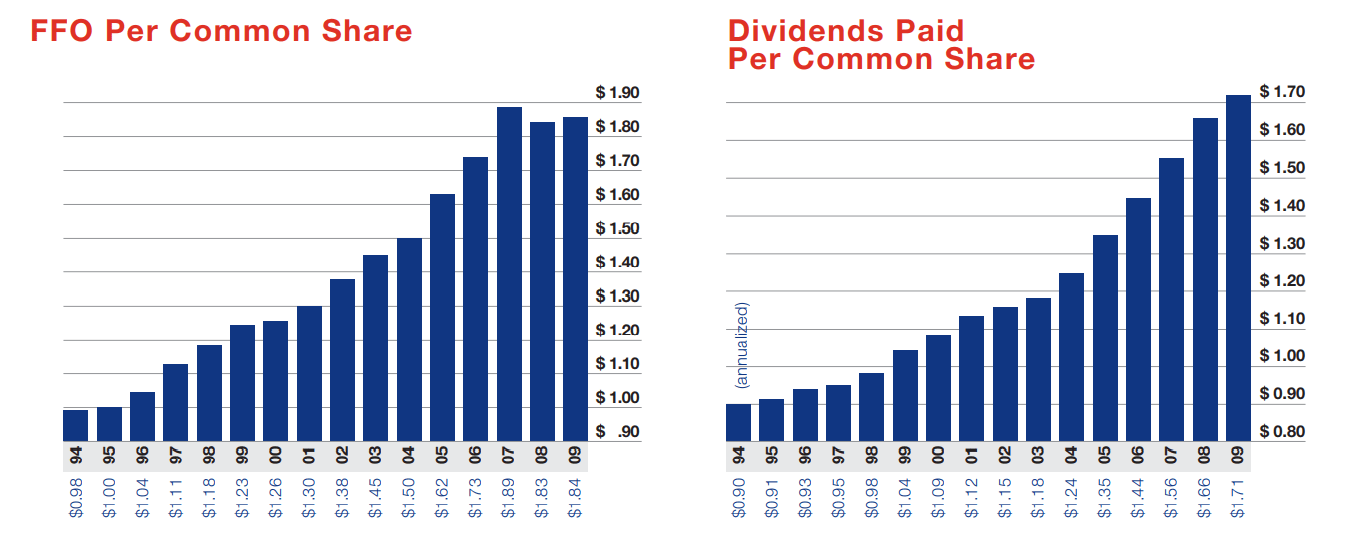
Why was there such a robust performance? That is because occupancy fell one percent between 2007 and 2009.
Realty Income 2009 Annual Report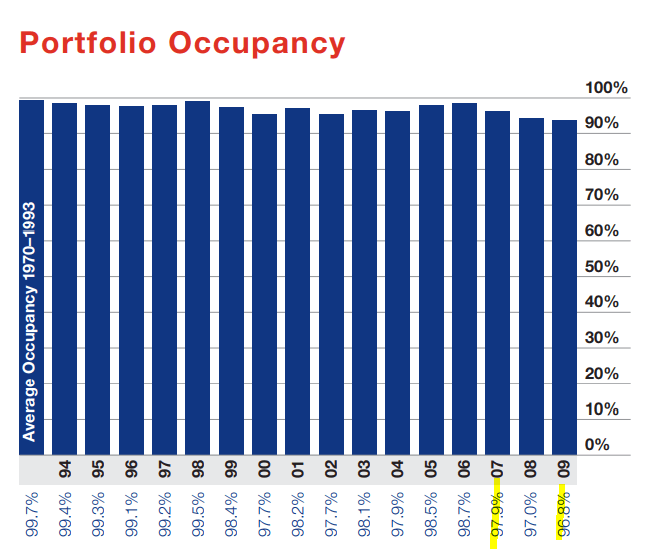
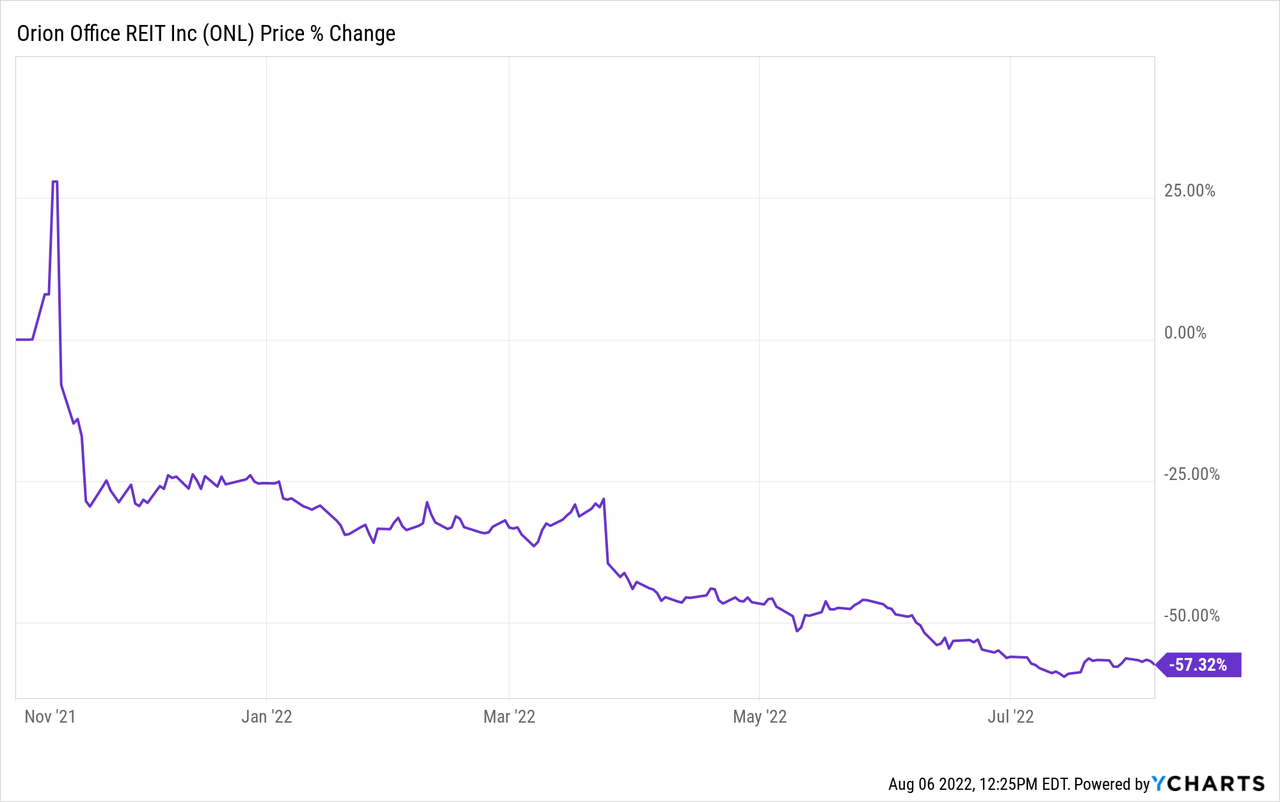
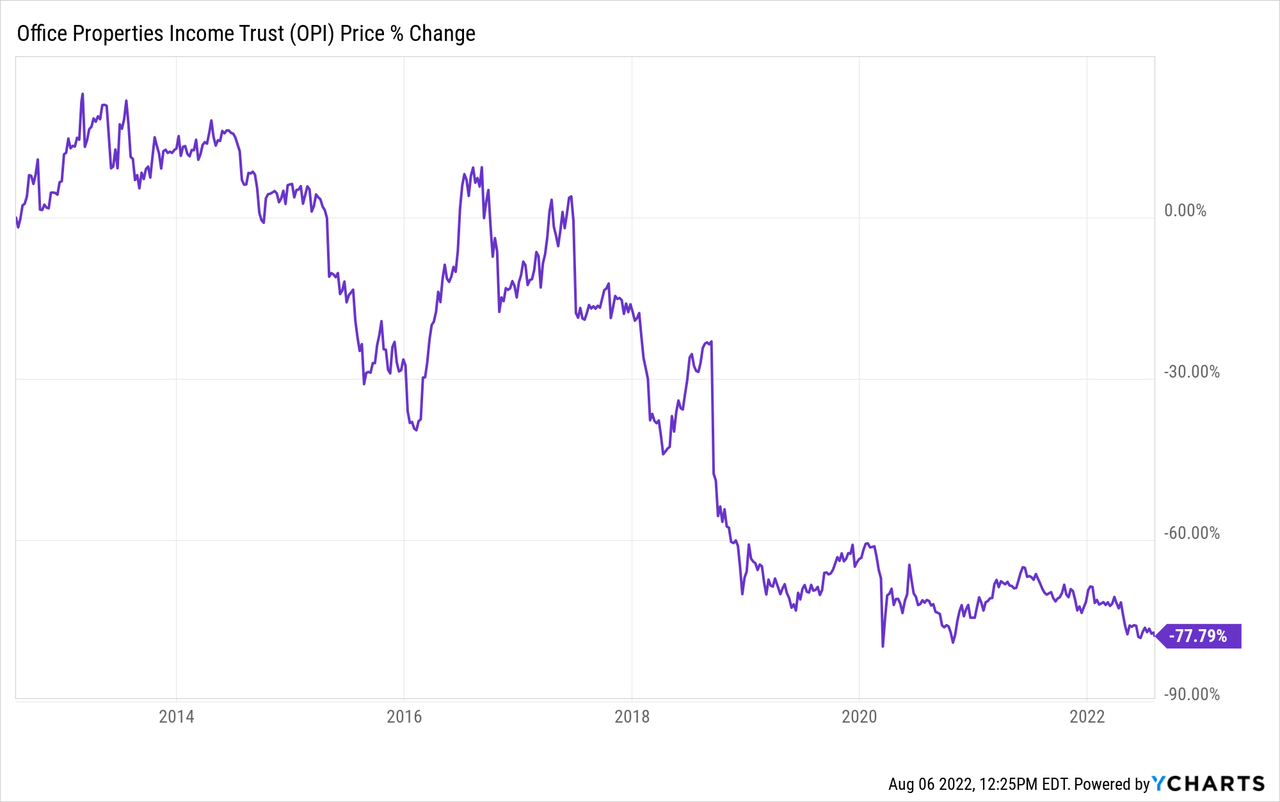
One percent. The fat in our milk falls more than that in recessions. Realty Income is hardly unique here. W. P. Carey (WPC) reported identical adjusted funds from operations (AFFO) in 2008 and 2009. Our point here is that the additional margin of safety for SAFE is so small (it is not like the tenant will pay you extra in a crisis) and the discounted value of a building 100 years from now is so abysmally low, that we would only pay normal FFO multiples for SAFE. We also think investors are vastly overestimating the usefulness of inheriting single tenant office buildings (46% of SAFE’s gross book value) in the middle of crisis. These are incredibly hard to lease in the best of times and following the exploits of Orion Office REIT Inc. (ONL) and Office Properties Income Trust (OPI) should tell you what we are talking about.
Currently, valuation for SAFE is still so outlandish that we don’t think the bottom is in or even close to being in. It is generating less than $50 million in adjusted free cash flow annually on its $2.5 billion market cap. Look for mid $20s for an entry point if you like this stock. That is our opinion and just like our call when this stock was in the $70s we are doubling down on it.
Please note that this is not financial advice. It may seem like it, sound like it, but surprisingly, it is not. Investors are expected to do their own due diligence and consult with a professional who knows their objectives and constraints.
Be the first to comment