

shapecharge
Medical REITs (real estate investment trusts) are off to a flying start this year, returning 13.8% YTD, as compared to the Equity REIT Index gain of 11.5% and the S&P 500 (SP500) gain of just 7.8%.
Hoya Capital Income Builder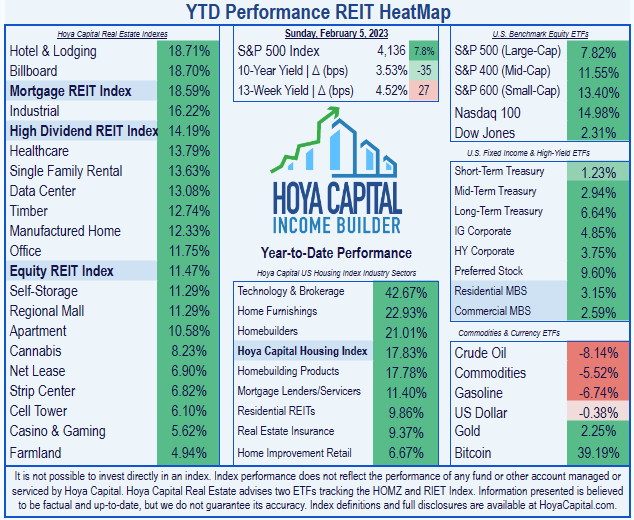
This recent outperformance comes in spite of strong headwinds in the form of high labor costs due to a shortage of skilled nurses and waning government fiscal support. Hoya Capital’s recent sector report on Healthcare REITs reads in part:
We’d generally prefer to skew our exposure more towards the “private pay” sectors – senior housing, MOB, and lab space – as the outlook for government-pay and “triple net” subsectors – hospitals and skilled nursing – will continue to be largely at the mercy of regulators and the financial health of their operator tenants while these sub-sectors also face broader headwinds from the longer-term shift towards lower-cost healthcare settings.
That doesn’t bode well for high-yielding Sabra Health Care REIT, Inc. (NASDAQ:SBRA), since 60% of their business comes from skilled nursing. Nevertheless, SBRA has gained 7.8% YTD, virtually matching the S&P 500.
Sabra’s peer group of small-cap and mid-cap REITs that deal primarily in skilled nursing and senior housing includes Omega Healthcare Investors (OHI) at $6.89 billion, National Health Investors (NHI) at $2.55 billion, CareTrust (CTRE) at $2.01 billion, and LTC Properties (LTC) at $1.55 billion.
Among this peer group, the two with the lowest concentration of skilled nursing and the highest concentration of senior housing facilities are NHI and LTC, while the one with the highest concentration of skilled nursing facilities and lowest concentration of senior housing is CTRE.
Sabra Health Care investor presentation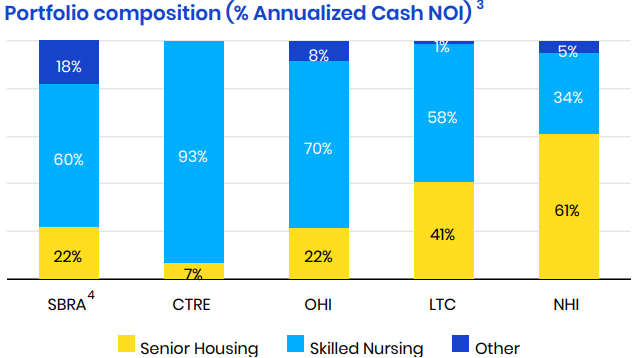
Sure enough, peer price gain over the past 12 months is directly correlated with the concentration in senior housing and inversely correlated with the concentration of skilled nursing facilities, just as Hoya Capital suggested. Over the past 12 months, SBRA’s 6.9% price gain ranks middle of the pack, as does its 60% concentration in skilled nursing. The best price gains among its skilled nursing and senior housing REIT peers have been enjoyed by LTC and NHI at 14.4% and 10.8% respectively, while CTRE has fared the worst, at 4.70%.
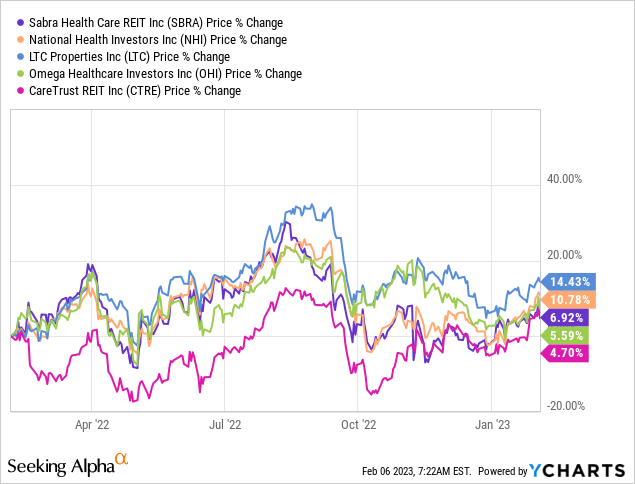
Nevertheless, all these companies have been relatively good investments over the past 12 months, posting gains where the average REIT has posted losses while paying higher-than-average dividend yields.
This article takes a closer look at SBRA, examining the growth, balance sheet, dividend, and valuation metrics for this upper small-cap Medical REIT.
Meet the company
Sabra Health Care
Founded in 2010 and headquartered in Irvine, California, Sabra Health Care owns 442 properties in the U.S. From this portfolio, 60% of annualized cash NOI (net operating income) comes from Skilled Nursing/Transitional Care facilities. Senior Housing accounts for 22% of NOI, split almost evenly between facilities the companies own and facilities they manage for third parties. Behavioral health facilities account for 13.5% of NOI, and the remaining 5% comes from specialty hospitals and other types of medical installations.
Sabra Health Care investor presentation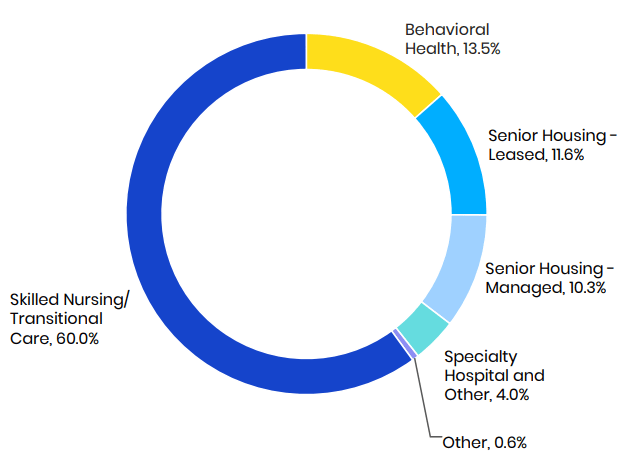
All 5 segments are struggling with occupancy. As of September 30, the Skilled Nursing segment enjoyed only 73% occupancy, while Behavioral Health led the way with just 83%. In addition, the entire triple-net portion of the portfolio was a quarter in arrears as of September 30.
| Segment | Occupancy | Rent Coverage |
| Skilled Nursing/Transitional | 73% | 1.83x |
| Senior Housing – owned | 82% | 1.13x |
| Senior Housing – managed | 81% | — |
| Behavioral Health | 83% | 1.72x |
| Hospital/Other | 80% | 7.30x |
Source: Sabra Health Care investor presentation.
On the other hand, the smallest segment of the company, Hospital/Other, enjoys the best rent coverage, at 7.30x. The largest segment, Skilled Nursing, has relatively healthy tenants, with 1.83x rent coverage, but the tenants in the Senior Housing owned portfolio (11.6% of NOI) have a rather tenuous grip, with just 1.13x rent coverage.
Still, that tenuous 1.13x rent coverage is tops among SBRA’s peer group. (Not sure why they made this number look so very tall in their investor presentation, do you? See chart below.)
Sabra Health Care investor presentation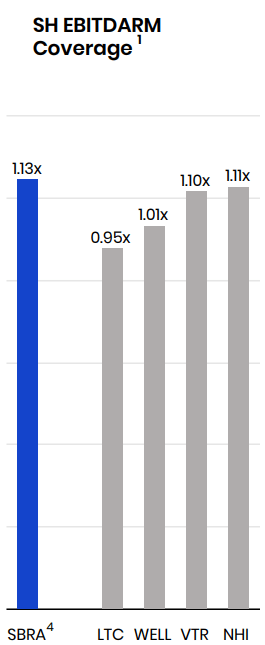
SBRA also has an unconsolidated joint venture with Enlivant, which consists of 157 facilities and 6,996 senior housing units. SBRA is actively increasing its exposure to drug addiction treatment facilities. This includes the conversion of a 48-unit memory care facility in Aurora, Colorado, and the acquisition and conversion of a 132-bed hotel in Greenville, South Carolina.
SBRA’s portfolio is leased to 72 tenants, with a weighted average remaining lease term of 8 years. The top 5 of these tenants account for 36.7% of the company’s annualized cash NOI.
Sabra Health Care investor presentation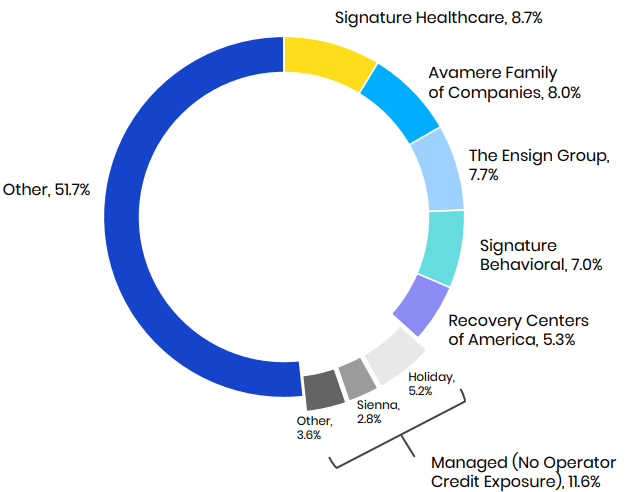
Ordinarily, this much dependence on a few tenants would not be favorable, but it is the healthiest mix among SBRA’s peers:
Sabra Health Care investor presentation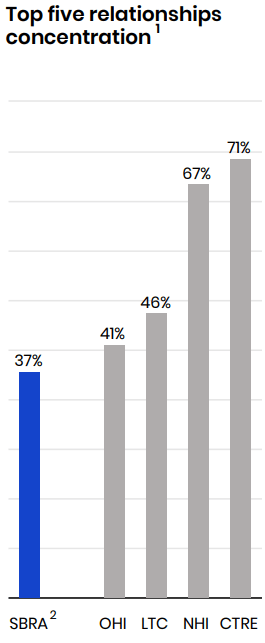
The company’s acquisition strategy is opportunistic, seeking off-market price dislocations. Sabra seeks to be the capital partner of choice for the expansion and growth of
- leading operators
- with regional expertise
- concentrated in markets with favorable demographics,
always with an eye on the future of healthcare delivery. The company prioritizes liquidity and capital recycling to finance acquisitions if possible, rather than taking on new debt or issuing more shares.
As of September 30, Sabra’s consolidated enterprise value stood at $5.5 billion.
Sabra Health Care investor presentation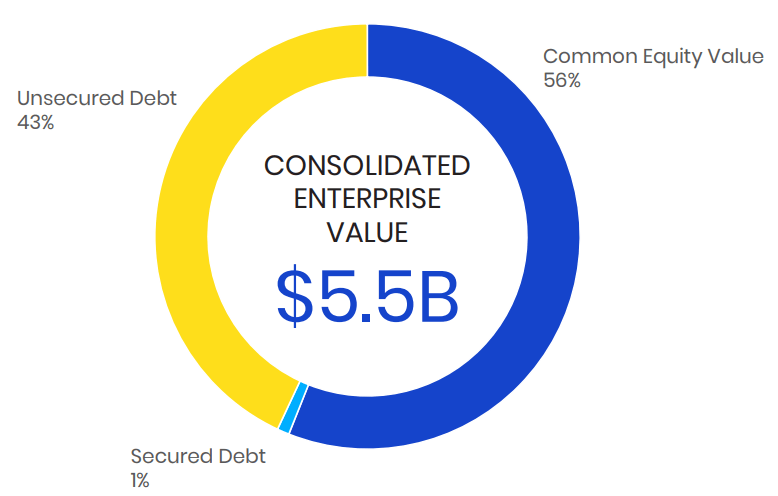
Growth metrics
Here are the 3-year growth figures for FFO (funds from operations), TCFO (total cash from operations), and market cap. After two pandemic-plagued years in the doldrums, SBRA’s FFO rebounded strongly this year and is expected to hold essentially even next year. FFO per share, however, continues to decline, along with TCFO and market cap.
| Metric | 2019 | 2020 | 2021 | 2022* | 3-year CAGR |
| FFO (millions) | $393 | $347 | $253 | $318 | — |
| FFO Growth % | — | (-11.7) | (-27.1) | 25.7 | (-6.8)% |
| FFO per share | $1.89 | $1.78 | $1.57 | $1.47 | — |
| FFO per share growth % | — | (-5.8) | (-11.8) | (-6.4) | (-7.7)% |
| TCFO (millions) | $372 | $355 | $356 | $331 | — |
| TCFO Growth % | — | (-4.6) | 0.0 | (-6.0) | (-3.8)% |
| Market Cap (billions) | $4.37 | $3.59 | $3.09 | $2.87 | — |
| Market Cap Growth % | — | (-17.8) | (-13.9) | (-7.1) | (-13.1)% |
*Projected, based on Q3 2022 results.
Source: TD Ameritrade, CompaniesMarketCap.com, and author calculations.
Meanwhile, here is how the stock price has done over the past 3 twelve-month periods, compared to the REIT average as represented by the Vanguard Real Estate ETF (VNQ).
| Metric | 2020 | 2021 | 2022 | 2023 | 3-yr CAGR |
| SBRA share price Feb. 6 | $21.69 | $17.88 | $12.71 | $13.50 | — |
| SBRA share price Gain % | — | (-17.6) | (-28.9) | 6.2 | (-14.6)% |
| VNQ share price Feb. 6 | $95.59 | $88.11 | $105.02 | $91.27 | — |
| VNQ share price Gain % | — | (-7.8) | 19.2 | (-13.1) | (-1.5)% |
Source: MarketWatch.com and author calculations.
After two years of steep declines, SBRA share price bottomed at $11.68 late last April and is up 15.6% since then. Still, the 3-year CAGR for SBRA has been a miserable (-14.6)%. Even with yields approaching 10%, SBRA has lost money for its investors over that period. Meanwhile, VNQ reached its bottom of $76.14 on October 14, climbing 19.9% since, resulting in a nondescript 3-year CAGR of (-1.5)%. With yields around 4%, VNQ has been a slight money-maker.
Balance sheet metrics
Every company with a market cap of $1.5 billion or higher in the medical REIT sector has a bond-rated balance sheet. Sabra’s is no exception and shows a strong liquidity ratio at 2.22, but weaker-than-average debt ratio of 44% and Debt/EBITDA of 7.6.
| Company | Liquidity Ratio | Debt Ratio | Debt/EBITDA | Bond Rating |
| SBRA | 2.22 | 44% | 7.6 | BB+ |
Source: Hoya Capital Income Builder, TD Ameritrade, and author calculations.
As of September 30, SBRA had $900K of available liquidity with the capacity to borrow up to $2.75 billion. In 2018, 27% of the company’s debt was held in unhedged variable rate instruments. They have reduced that to just 5.6%, resulting in an annual savings of $7.6 million in interest.
Of the company’s debt, $1.75 billion is held in unsecured bonds at a weighted average interest rate of 4.03%, and $527 million is held in term loans at 4.5% interest. The latter comes due during Q4 of 2024, and until that time, Sabra faces essentially no debt maturities, which is a very fortunate position to be in.
Sabra Health Care investor presentation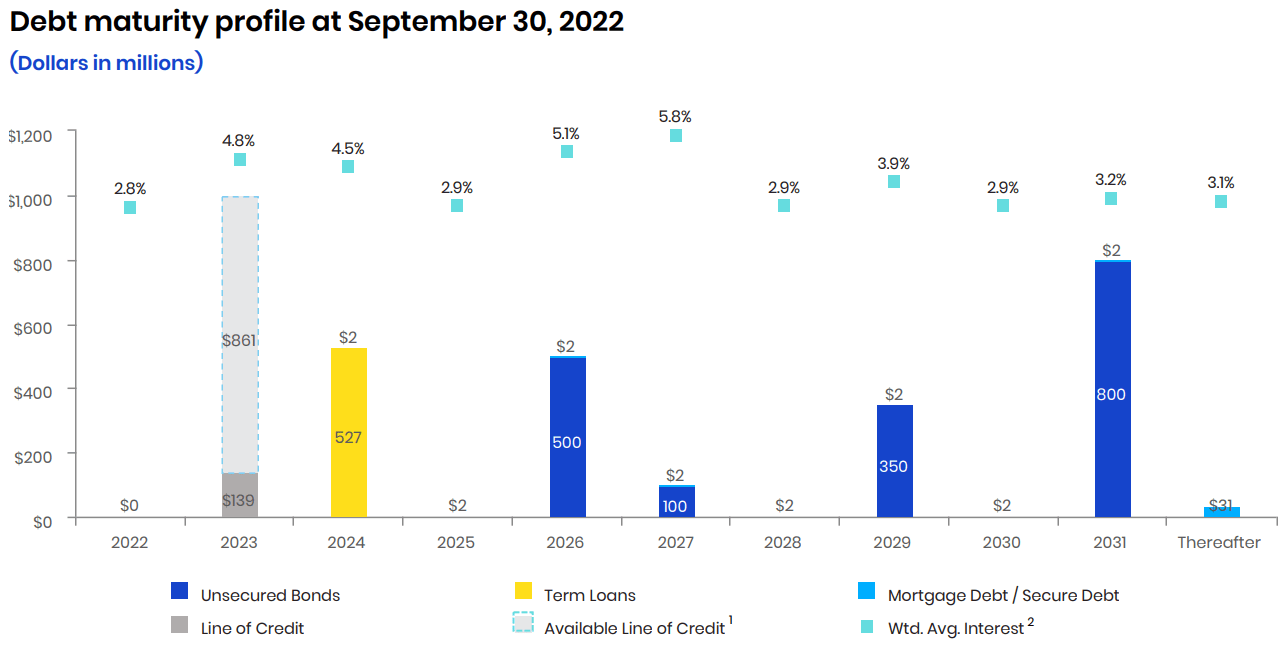
Thus, although the debt ratio and debt/EBITDA are shaky, maturities are favorable, and interest rates on the debt are reasonable, if slightly high.
Dividend metrics
SBRA sports a high yield of 8.83%, but due to the deep cuts of 2020, the Dividend Score is just 5.90%. However, that is still much higher than average. Even with a payout ratio of 80%, the dividend safety rating assigned by Seeking Alpha Premium is a near-perfect C. The high current yield looks quite safe.
| Company | Div. Yield | 3-yr Div. Growth | Div. Score | Payout | Div. Safety |
| SBRA | 8.83% | (-12.6)% | 5.90 | 80% | C |
Source: Hoya Capital Income Builder, TD Ameritrade, Seeking Alpha Premium.
Dividend Score projects the Yield three years from now, on shares bought today, assuming the Dividend Growth rate remains unchanged. SBRA is currently the yield champion among its peers.
Sabra Health Care investor presentation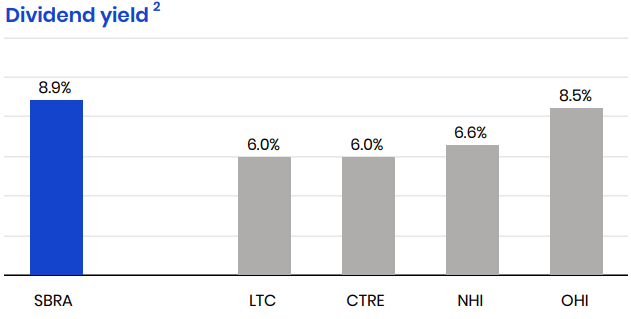
Valuation metrics
At just 9.2, SBRA sells at barely half the REIT average price/FFO, while paying a much higher dividend.
| Company | Div. Score | Price/FFO ’22 | Premium to NAV |
| SBRA | 5.90 | 9.2 | (-3.6)% |
Source: Hoya Capital Income Builder, TD Ameritrade, and author calculations.
SBRA also sells at the lowest price/FFO of its peer group, as shown below.
| SBRA | OHI | CTRE | NHI | LTC |
| 9.2 | 10.3 | 14.3 | 13.3 | 14.7 |
Source: Hoya Capital Income Builder
Similarly, SBRA also sells at the steepest discount to NAV of its peer group.
| SBRA | OHI | CTRE | NHI | LTC |
| (-3.6)% | 2.1% | 7.0% | 5.3% | 13.4% |
Source: Hoya Capital Income Builder.
What could go wrong?
In a highly connected world, there is always a risk of another pandemic, though there are no new ones on the horizon, to my knowledge. In the meantime, labor shortages persist, and although there are signs of easing, this continues to pressure SBRA’s tenants.
Sabra operates in a complex web of governmental regulations and patient rights, which are subject to change and to litigation at any time.
Sabra has a 49% stake in a joint venture with Enlivant and has already taken a $164 million impairment charge associated with it (June 2021). They do not expect to buy Enlivant out at any time in the future, and an additional impairment charge could result, depending on when, whether, and for what price Enlivant decides to sell its share.
Continued pressure on Sabra’s tenants could render some of them unable to pay their rents. This is particularly true in the Senior Housing owned portfolio.
Investor’s bottom line
Sabra Health Care, along with all REITs with heavy concentrations in skilled nursing facilities, got hit hard by COVID, and by the shortage of skilled nurses that followed. The worst seems to be over, and occupancy has stabilized and started to gradually mend. However, a return to robust growth is not yet in sight.
For a growth investor, there is nothing to recommend SBRA, but it merits a Hold. However, for a value investor, the combination of a safe inflation-busting yield with a low price/FFO and deep discount to NAV is compelling, particularly for those who are dependent on dividend income. For such investors, SBRA is definitely a Buy.
Seeking Alpha Premium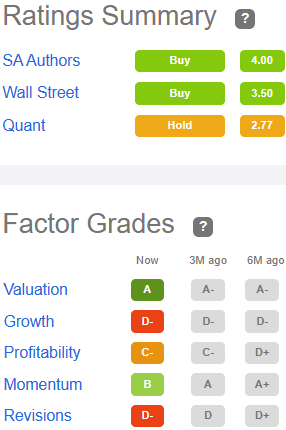
Of the 16 Wall Street analysts covering SBRA, 10 rate the company a Hold, but for the remaining analysts, Buy ratings outnumber Sell ratings by 5 to 1. The average price target is $14.08, implying only 4.3% upside, but Hoya Capital Income Builder places fair value at $16.50, implying 22.2% upside.
The Street and Ford Equity Research rate SBRA a Hold, and TipRanks rates it on the high end of Neutral (7 out of 10). Meanwhile, revisions-sensitive Zacks recommends Selling.
As always, the opinion that matters most is yours.
Be the first to comment