

Araya Doheny/Getty Images Entertainment
Investment Thesis
Asana, Inc. (ASAN) is an emerging platform leader in the work management space. It also operates a highly scalable go-to-market (GTM) model. Its low-friction self-service model is suitable for small teams in the SMB space. It also has a direct sales team that focuses on growing its enterprise base, which accounts for most of its revenue. Given that it has a paying customer base that reached 114K in FQ3’22, there’s little doubt about Asana’s scalability. Moreover, it’s still leveraging a massive TAM estimated to reach $50.7B by CY25.
However, its stock has been battered over the last two months. Given its nosebleed valuations in November, no one should be surprised. Despite that, the stock has still performed remarkably well for its investors on a 1Y basis. Therefore, some investors could also be considering whether it’s an attractive opportunity to add exposure.
Despite that, we don’t think Asana’s current valuation is attractive enough to consider adding. We discuss more below.
Asana Stock 1Y Performance
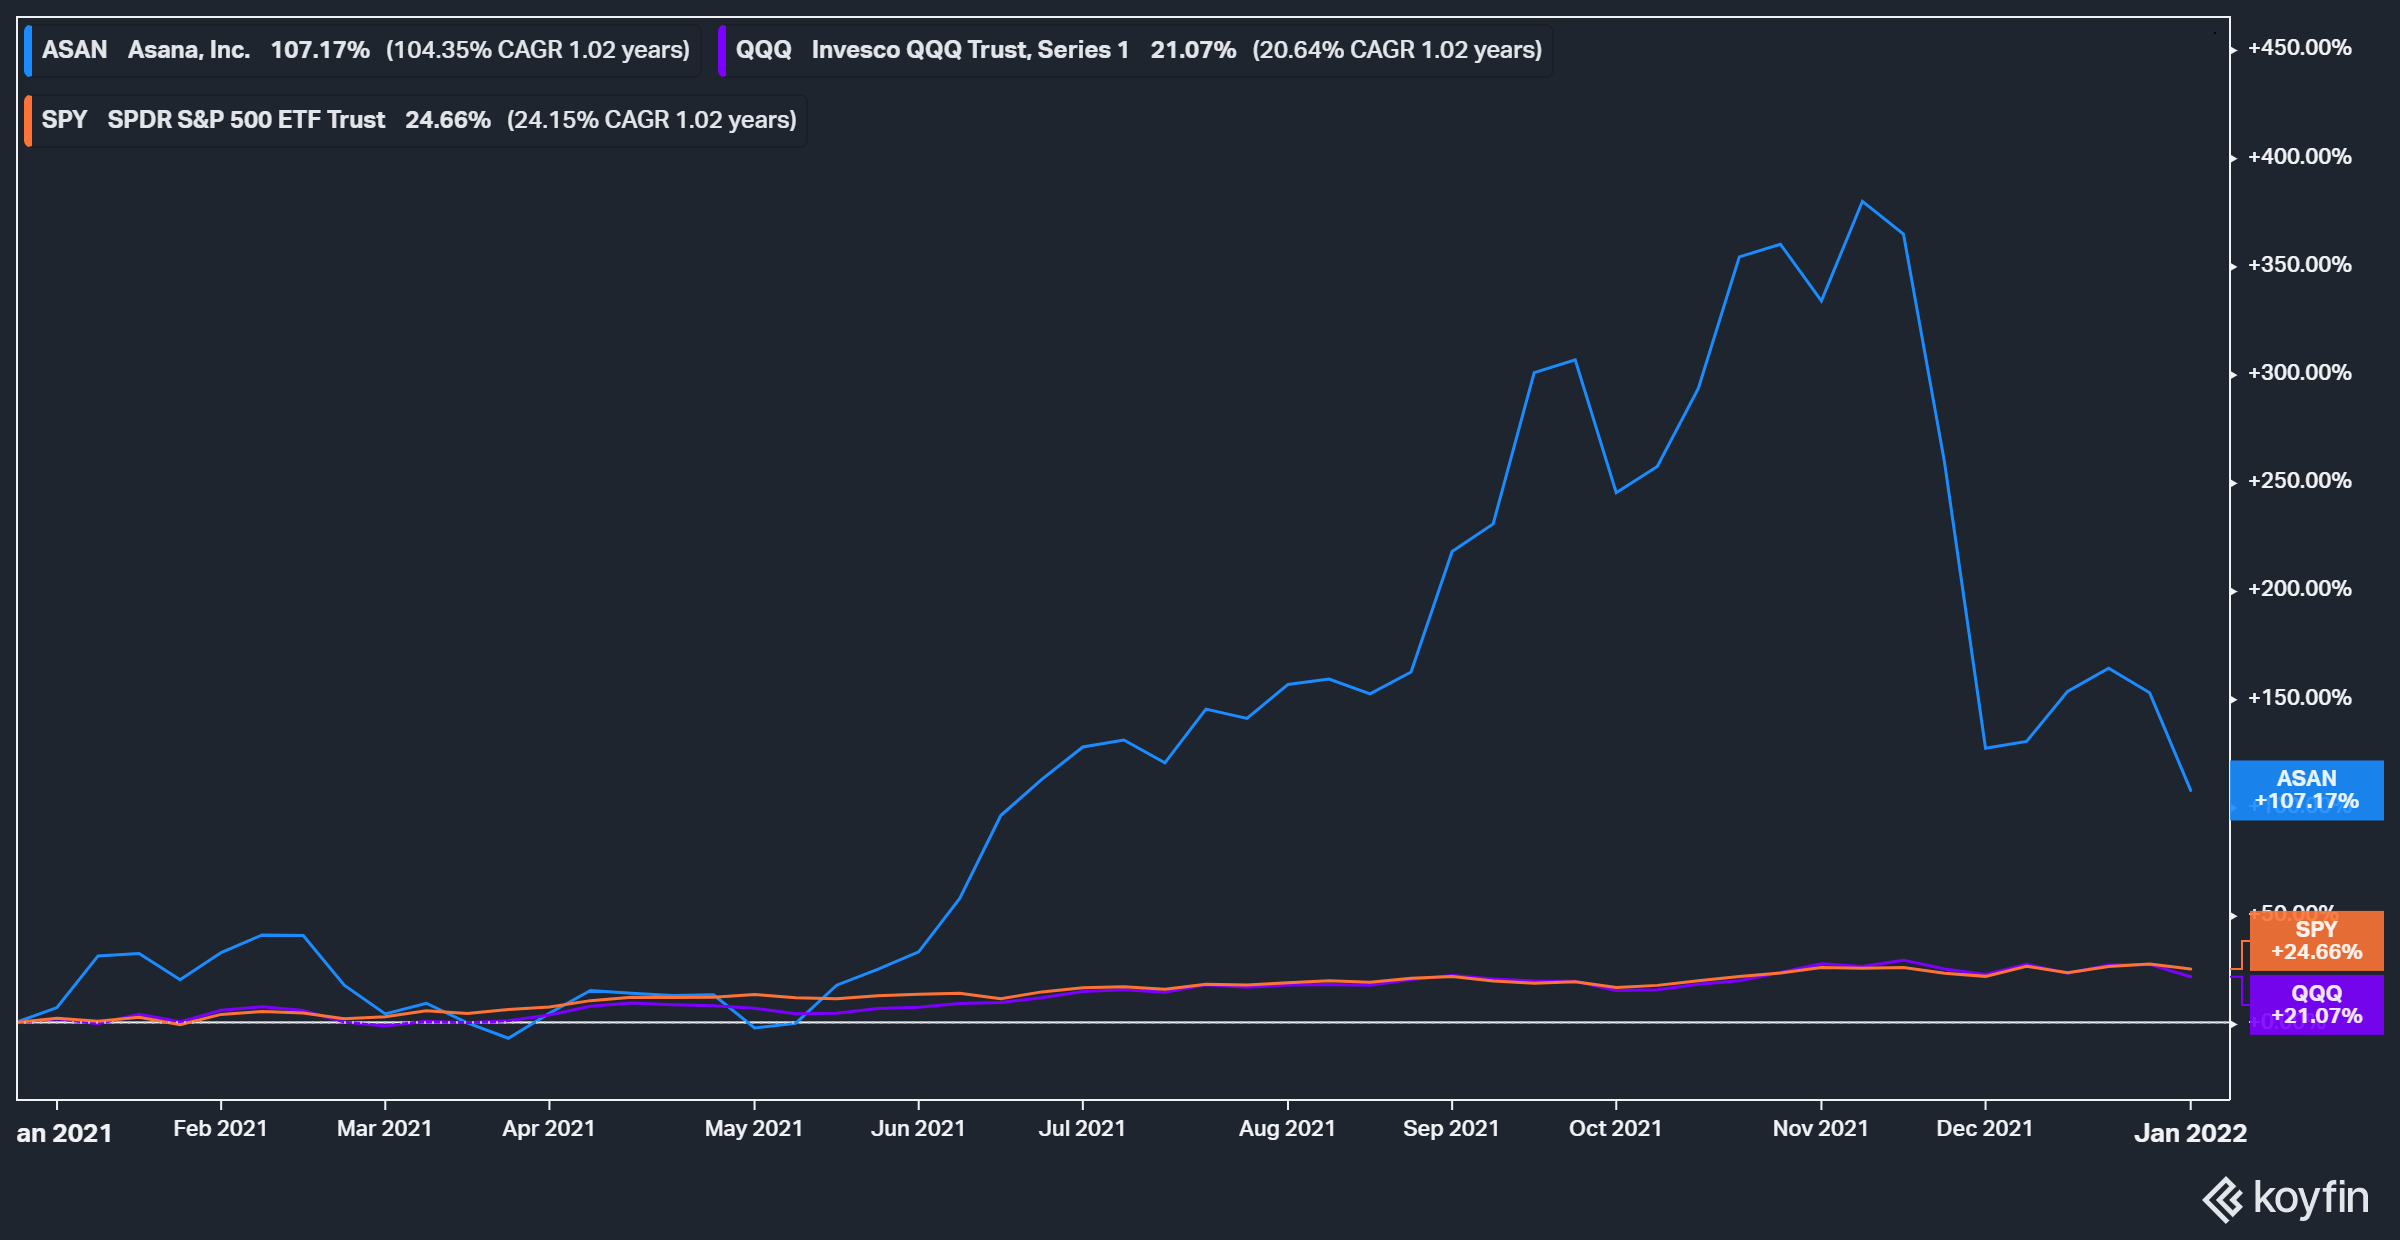
ASAN stock 1Y performance (as of 7 Jan’22).
Asana stock posted an impressive 107% return over the past year, outperforming the market by a wide margin. But, its YTD gains in early November were even more incredible before sellers assumed control. Asana stock had registered YTD gains of 379% before the steep correction.
Why Investors Should Not Be Surprised
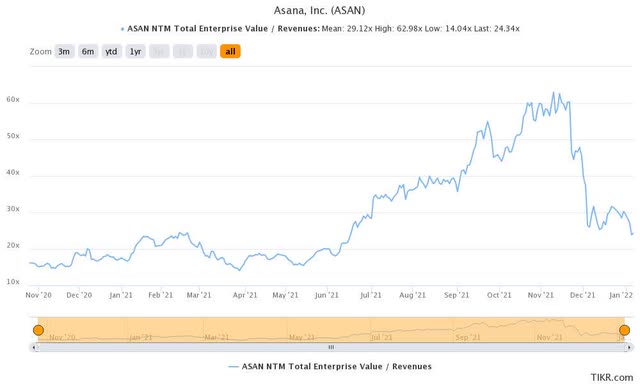
Asana stock EV/NTM Revenue mean.
Readers can quickly glean that Asana stock traded at its peak valuation of more than 60x NTM revenue in November before its dramatic tumble. Given that its high-growth SaaS peers traded at a median of 25x NTM revenue, its valuation was clearly unsustainable. Nevertheless, greedy traders ran up the price from July’21, hoping to pass it on to the next greater fool. These traders finally learned invaluable lessons on valuations as the “elevator came crashing down.”
Why Investors Were So Hyped Up With Asana
We are surprised by the hype as well. Asana is not the only high-quality competitor in the work management and collaboration space. Nevertheless, IDC MarketScape identified Asana as one of the Leaders in its 2021 assessment.
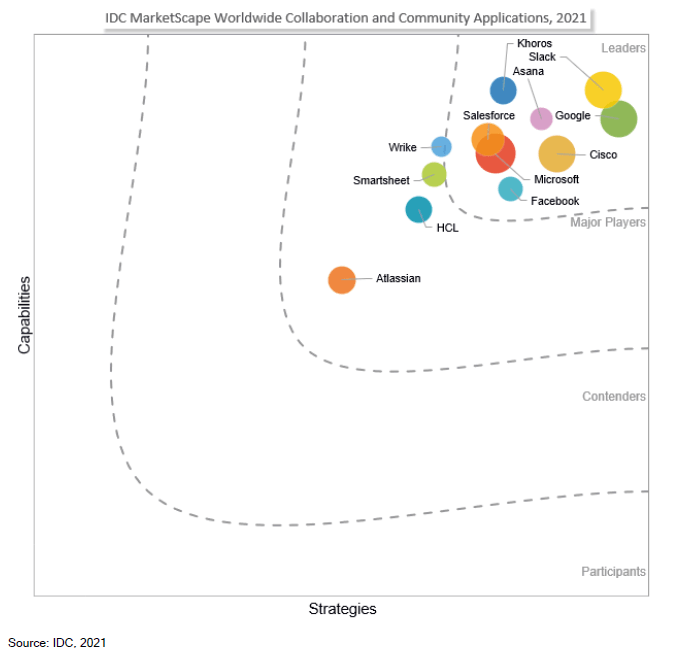
IDC MarketScape 2021 assessment for worldwide collaboration and community applications.
Nonetheless, readers can glean the multitude of top competitors in the space that Asana is operating in. But, IDC also opined that Asana’s unique Work Graph Data Model helps facilitate “organization-wide clarity.” IDC emphasized (edited):
Asana enables the flow of work to be better visualized and managed, with a rich collaboration layer for messaging. Asana also integrates with other popular messaging platforms such as Slack (CRM) and Microsoft (MSFT) Teams. In a unique use case for a graph database, the Asana Work Graph helps users facilitate work across the organization. This intelligence facilitates better visibility and aggregated insights for individuals, managers, and the enterprise. (IDC MarketScape Assessment)
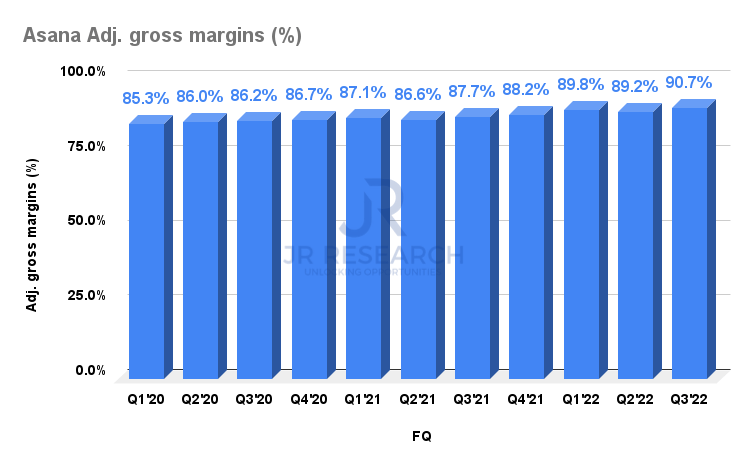
Asana adjusted gross margins. Data source: Company filings
Therefore, we believe that Asana has created a critical differentiator that has allowed it to post consistently high gross margins. Asana reports best-in-class gross margins among its high-growth SaaS peers that we track. In addition, it has consistently reported adjusted gross margins well above the 90th percentile of its peers’ group margin of 81%. In FQ3’22, Asana’s adjusted gross margin even reached 90.7%. Hence, there’s no doubt that Asana has tremendous pricing power. Despite that, Asana’s business model has not been optimized for profitability yet. Given that the company is still prioritizing growth over profitability due to its massive TAM, we think it’s reasonable.
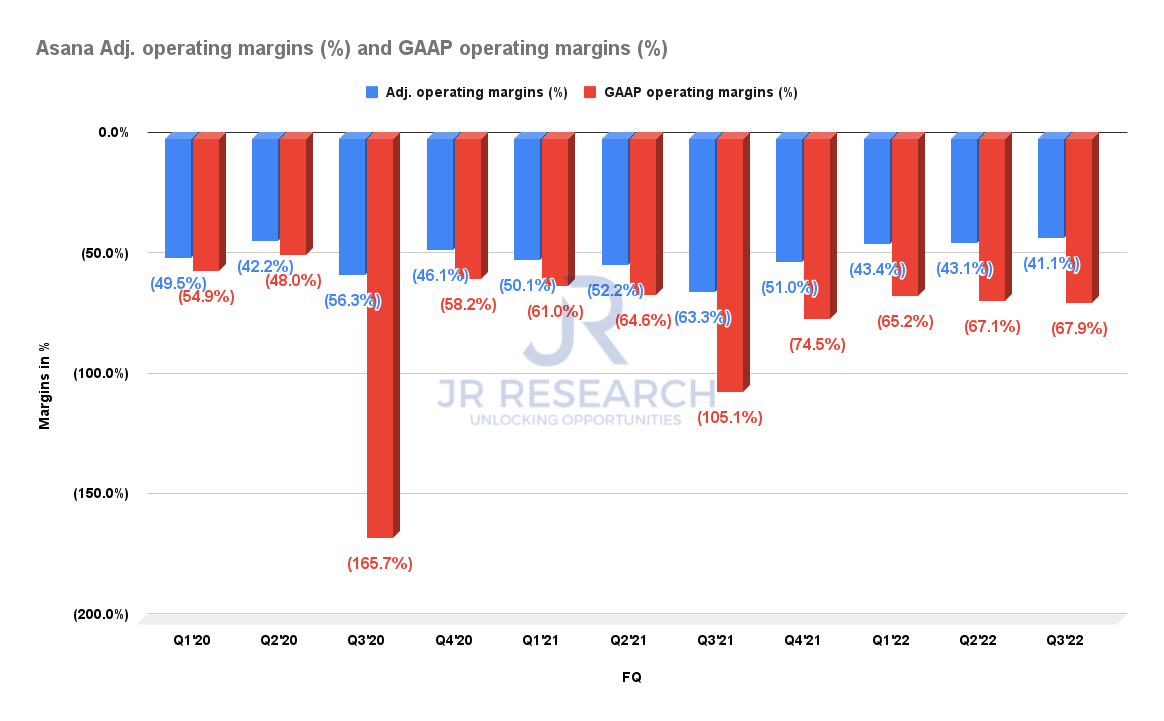
Asana adjusted & GAAP operating margins. Data source: Company filings
Its operating profitability also seems to have improved as it reported an adjusted operating loss of 41.1% in FQ3. Nevertheless, the company profitability remains deeply mired in the red. The company’s adjusted SG&A accounted for 92.9% of its revenue in FQ3. Moreover, Asana also reported an adjusted R&D margin of 39%. Therefore, even though its GTM model seems to be highly scalable, it came at very high costs as it aims to penetrate the enterprise space further.
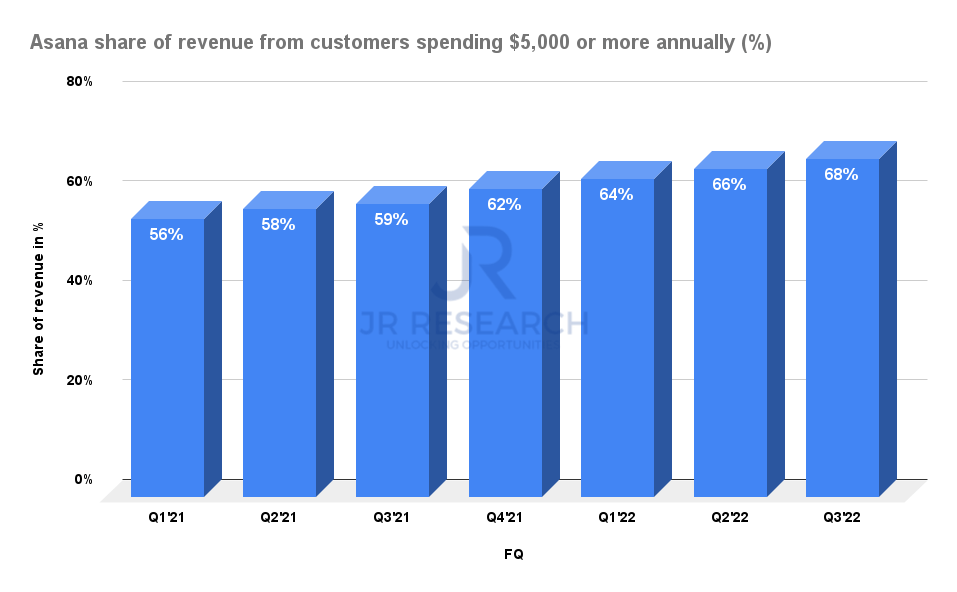
Asana share of revenue from customers spending $5K or more annually. Data source: Company filings
Furthermore, its momentum over its low-friction small teams SMB space seems to be slowing down, as noted in its FQ3 earnings call. Even though the SMB space accounted for just 32% of its revenue in FQ3, these small teams still accounted for most of its 2M subscriptions. Moreover, given its low-touch approach, it can optimize the SG&A spend towards this segment. Although it’s clear that the company is investing heavily towards the enterprise space to scale its topline rapidly (which it needs to justify its valuations), the leverage hasn’t been meaningful yet.
Moreover, billings growth also seems to have slowed in FQ3, even though its monthly billings have impacted it. Nevertheless, we can understand why Asana is focusing on larger deployments. The net retention rate (NRR) over its largest customers ($50K or more spending annually) has consistently been higher than its smaller customers. In FQ3’22, the segment posted an NRR of 145%, in line with FQ2’s performance. Therefore, it makes sense that Asana is gunning for those large enterprise deals to justify its premium valuation and help with retention.
Nevertheless, we believe that it’s essential for Asana to show meaningful leverage moving forward as we aren’t sure whether its enterprise momentum is sustainable on its bottom line.
Why Asana Stock Still Seems Overvalued
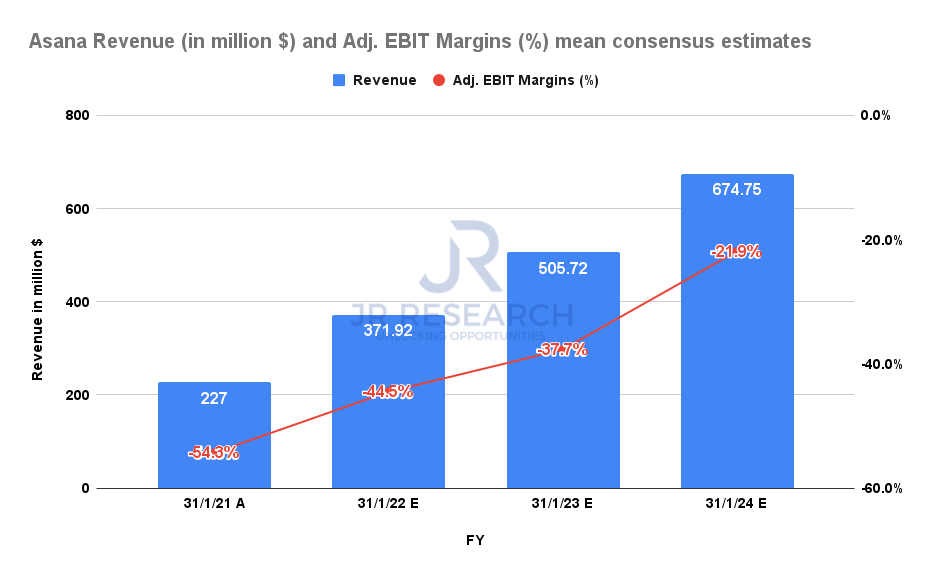
Asana revenue and adjusted EBIT margins mean consensus estimates. Data source: S&P Capital IQ
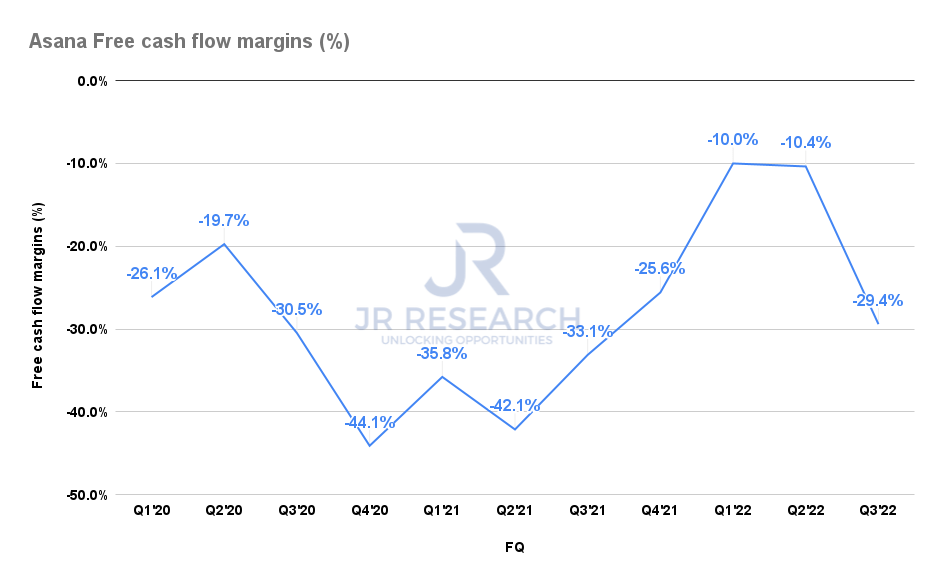
Asana FCF margins. Data source: Company filings
Asana’s negative free cash flow (FCF) margins make it very challenging to model its fair value meaningfully. Moreover, consensus estimates do not point to the company reporting adjusted EBIT profitability over the next three FYs.
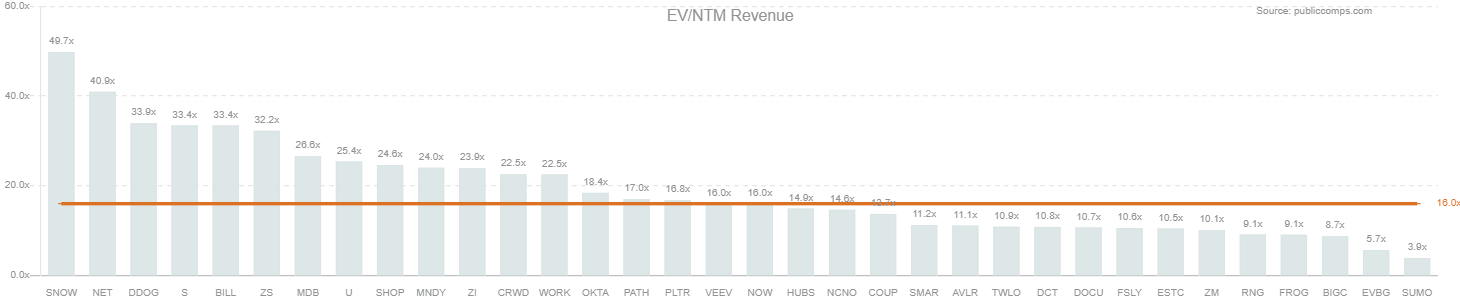
High-growth SaaS peers EV/NTM Revenue median.
Moreover, ASAN stock is still trading at a significant premium against its peers’ group median of 16x NTM revenue. Even though Asana stock has collapsed 58% from its all-time high in November, it’s still trading at an EV/NTM Revenue of 24.3x. Furthermore, its revenue growth is estimated to decelerate moving forward, at a CAGR of 34.7% between FY22-24. In contrast, its topline is expected to increase at a YoY growth of 63.8% in FY22.
Given the above factors, we find it challenging to justify its current valuation and don’t think the current entry point is attractive.
Therefore, we rate ASAN stock as Neutral for now. But, we will review our position if a deep retracement occurs subsequently.
Be the first to comment