

Lemon_tm/iStock via Getty Images
Written by Nick Ackerman, co-produced by Stanford Chemist. A version of this article was originally published to members of the CEF/ETF Income Laboratory on March 21st, 2022.
Saba Capital Income & Opportunities Fund (NYSE:BRW) is either really taking their time to position their portfolio, or they will be a heavy SPAC fund. They’ve finally given us a bit of an update on their holdings. Overall, I’m not too excited at this point. It will be interesting to see where the fund goes next.
A SPAC, of course, is a special purpose acquisition company that we had heard all about in 2020. These started to really fizzle out in 2021, and now most pre-merger SPACs are below the key $10 price. That’s before they even make a deal.
After they make a deal it gets worse, the average stock price for SPACs that found businesses to merge with in 2020 and 2021 was $8.70 at the end of December 2021. Given the market conditions, this has probably only sunk further since.
It might come as a bit of a shock that BRW has nearly 80% of its portfolio in SPACs at the end of January 2022. Quite a material jump for the fund when in July of 2021, they had around 27% exposure. They had still been transitioning from taking over the fund from Voya. Previously, it was a senior loan fund. So at that time, they still had nearly 69% in senior secured first-lien loan exposure.
On the other hand, if they are holding these SPACs just as a place to park some cash to deploy it in better investments – that could make a lot of sense too. This fund is a bit of a gamble overall as we still really aren’t seeing how it will be positioned. Saba is an activist in the closed-end fund space, which made me believe we would see a much heavier weighting to CEFs. In July 2021, CEF weighting was 1.46%, which is now 9.36%. On an absolute basis, I expected much more. To be fair, it would be a massive jump on a relative basis.
In a recent announcement, they have approved a reverse 1 for 2 stock split. This doesn’t change anything fundamentally with the fund. It will cut the share count in half and the price will double. This is expected to happen on May 20th, 2022.
The Basics
- 1-Year Z-score: 0.85
- Discount: 5.24%
- Distribution Yield: 12.74%
- Expense Ratio: 1.38%
- Leverage: 24.32%
- Managed Assets: $407 million
- Structure: Perpetual
BRW has an investment objective to “provide investors with a high level of current income, with a secondary goal of capital appreciation.” Their website highlights that they will “invest in high yield credit.” They will also “opportunistically invest in other products, such as, closed-end funds and special purpose acquisition companies.” Then finally, they will “also use derivatives where it believes it can achieve attractive risk-adjusted returns as a way to reduce portfolio risk.”
The fund is a fair size, and the leverage isn’t too overly elevated either. Though either way, leverage adds risks and should be considered before investing.
The fund’s expense ratio comes in at 1.38% when they last reported in their Annual Report. However, this has jumped up to 3.03% when including leverage expenses as reported at the end of February 2022. Given the nature of the underlying investments, this is all the more reason I’d be hoping to see a drastic shift in their portfolio.
Performance – Attractive Discount
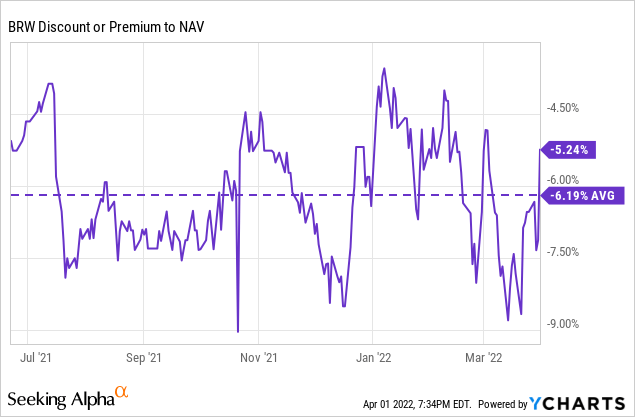
One of the more appealing features of the fund at the moment is the discount. It last came in at 7.82%. That hasn’t changed dramatically since Saba commandeered the fund. In my opinion, it is a bit shocking considering the distribution yield that the fund is currently paying. We often see higher-paying funds immediately start trading at higher valuations, whether the higher valuation is warranted or not.
I suspect we can see this drift to a narrower discount over time. This is a smaller fund and wasn’t so popular before, so it can take years for investors to catch on in the CEF space. Of course, if it performs terribly and continues to erode its NAV, that could spook investors away. With the uncertainty in the fund at the moment, that could also be playing a role in the wide discount.
The below graph of the discount to NAV was from June 22nd, 2021, to today. June 22nd, 2021, was when the transition officially went into effect.
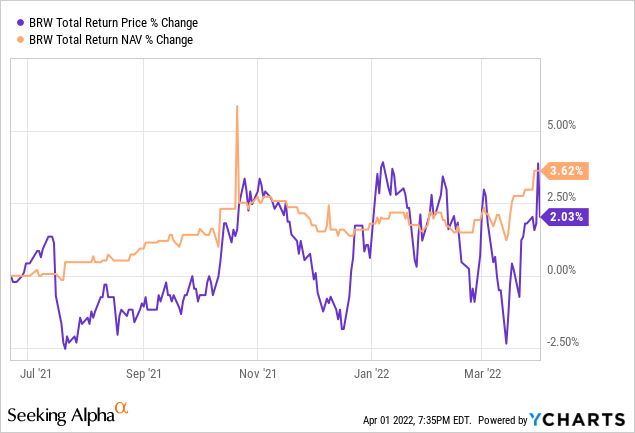
The performance since that time is less relevant given the transition they’ve been going through. However, below are the total returns on both share price and NAV since that time. The price itself has been quite volatile.
Distribution – 12% Managed Plan
When we previously covered the fund, they had announced an 8% target managed plan. Since that time, they’ve now ramped this up to 12%. It is an important reminder that it doesn’t mean they return this much, just that this is the amount they will pay shareholders annually regardless of coverage. This will be adjusted each month, which takes away some of the appeal. The most recent distribution came to $0.047. A slight decline from the previous few months as the NAV has been declining along with the broader market.
BRW Distribution History (CEFConnect)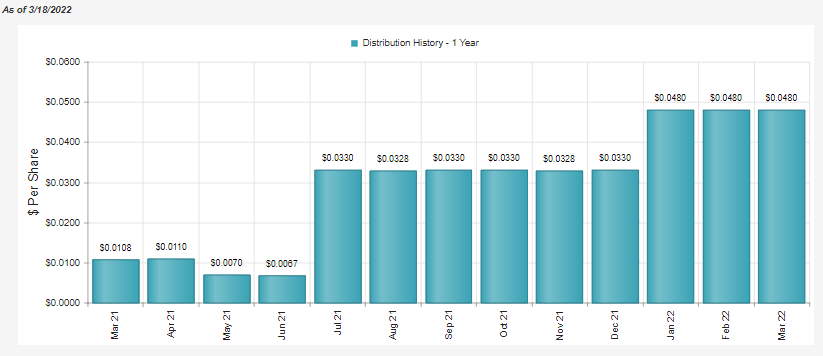
In terms of coverage, we can take a quick look at the latest Annual Report. However, we can’t get too much information from it since it is a wildly different fund at this time.
BRW Annual Report (Saba Capital)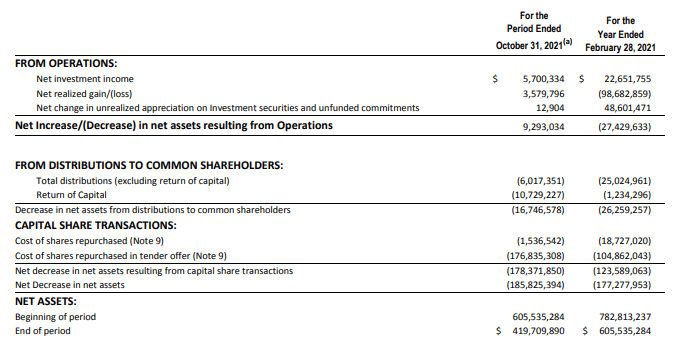
Net investment income was still a rather material amount in the fund at the end of the fiscal year 2021. As the portfolio is composed now, it would need to rely on capital gains entirely or almost entirely. The reason being is that NII is simply dividends and interest minus expenses.
The total income will be low because of the lack of dividend and interest-paying positions in the underlying portfolio. At the same time, the expenses are heading higher, with leverage expenses rising. I wouldn’t be too surprised to see the next report show a negative NII figure.
For tax purposes of the distribution, it can really be anyone’s guess on how that will fall for now. At this time, I would anticipate mostly return of capital unless they change their portfolio dramatically from here.
To a degree, I also believe that we will see destructive return of capital utilized as well-the kind where it will erode NAV over time. The reason for this is because the 12% plan means they need to have a portfolio that can return that every year. At the current positioning, I think it would be impossible – and it is already an ambitious plan if it was invested better.
BRW’s Portfolio
With little surprise, the turnover rate for BRW over the last year fiscal year they reported was an elevated 94%. As I mentioned above, the bulk of this is in SPACs at the moment.
BRW Portfolio Composition (Saba Capital)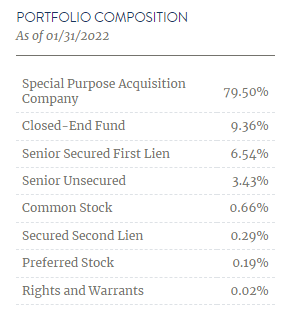
I suspect this will continue to transition over time. However, I’m still a bit shocked at the amount of SPAC exposure nonetheless. I believed they’d be a bit quicker with their transition. On the other hand, it does mean that they haven’t participated in the downside the rest of the broader market has experienced. Below is the YTD performance comparison between BRW and SPDR S&P 500 ETF (SPY).
YCharts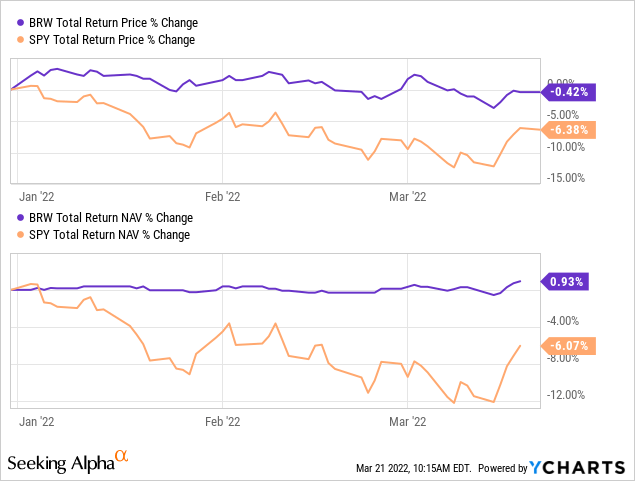
Looking at the fund’s top positions, I’d say we get a lot of what we would expect: mostly SPACs and some CEFs. The CEFs are all tilted towards heavier energy-focused funds.
BRW Top Holdings (Saba Capital)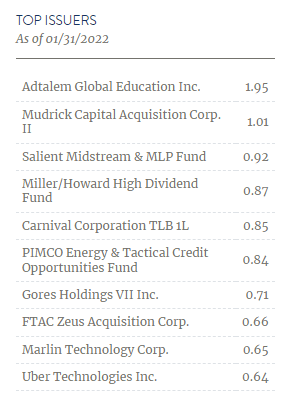
One of them is the PIMCO Energy & Tactical Credit Opportunities Fund (NRGX), which I had just provided a full update for very recently. There is also the Miller/Howard High Dividend Fund (HIE). That is another Income Lab portfolio holding and holding of mine too. As such, I regularly provide coverage for that fund too. This isn’t an energy-focused fund specifically, but they have a fairly heavy weighting to the sector as a high dividend-focused fund.
There is also the Salient Midstream & MLP Fund (SMM). This was a fairly recent acquisition in the Tactical Income- 100 Portfolio after selling Guggenheim Strategic Opportunities Fund (GOF). The key driver for Stanford Chemist’s alert on SMM was Saba’s position in the fund. They owned 16.71% of the fund at last look. Confirmation that BRW will be participating in their activist activities, which is one of the key reasons to invest in BRW in the first place.
Conclusion
Overall, the fund is still in transition, and we can probably expect to see more changes going forward. Admittedly, I’m not thrilled by their exposure at this time. I wanted to see less SPAC exposure and more allocations to real investments.
SPACs exposure can really pay off if you are invested in the right ones. However, they have hundreds of investments and a seemingly endless number of SPACs they are invested in when looking at their full portfolio list. Even if one or two hit the jackpot, the portfolio won’t really feel it. As an example, Digital World Acquisition Corp (DWAC) is one of BRW’s positions.
YCharts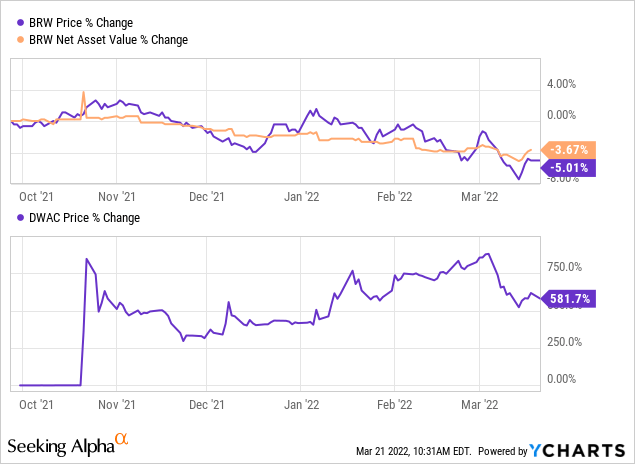
You’ll notice in the chart that DWAC had really blasted higher. This took place in October 2021, when a merger deal was announced with Trump Media. BRW’s NAV jumped $0.17 that day, too, but it looked like an error that happened on the same day. The following day, the NAV fell back down $0.16. Anyway, the main point is that DWAC is up around 580%, and BRW didn’t noticeably benefit due to their hundreds of positions.
Overall, this continues to be a wait-and-see. The discount is attractive, but given the uncertainty, it seems warranted.
Be the first to comment