

RichVintage
When we wrote about (NYSEARCA:RYLD) we did elicit some strong emotions. After all, the title itself suggested people were not getting true returns from this product. We left our jeering fans with a solid evaluation point for the future.
All said and done, we think 5% annual total returns are more probable than 13%.
Source: The Imaginary 13% Yield
With a nice line drawn in the sand, we can see exactly how the theory is panning out. We do that and update our outlook for this crowd favorite.
The Fund Basics
RYLD, as the name implies, follows a “covered call” strategy. This is also known as a “buy-write” strategy, in which RYLD buys the stocks in the Russell 2000 Index and then writes corresponding covered call options on the Russell 2000 Index. RYLD seeks to provide returns that correspond generally to the price and yield performance of the CBOE Russell 2000 Buy Write Index. The fund has $1.4 billion in total assets and holds $400 million in the Vanguard Russell 2000 ETF (VTWO).
Global X – RYLD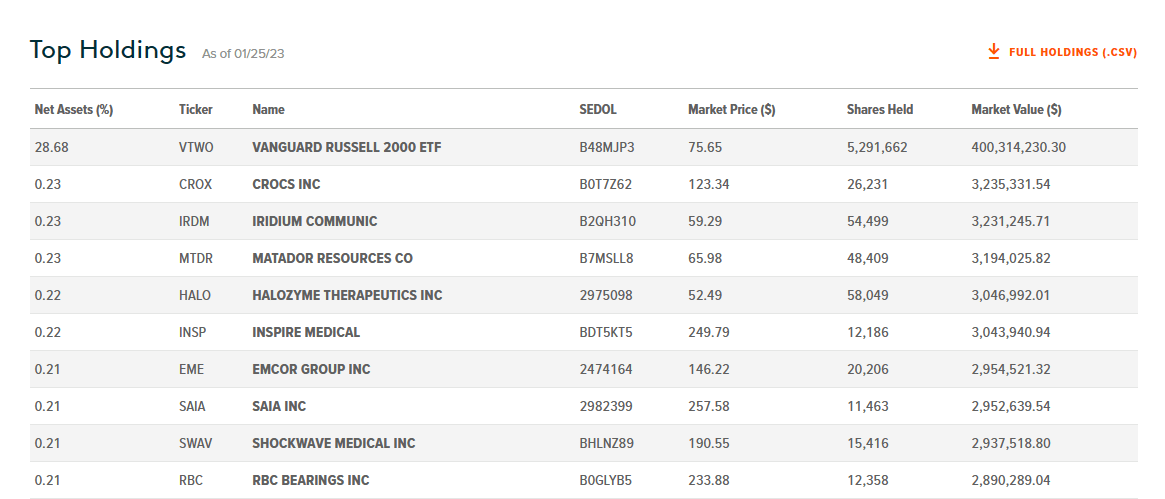
RYLD mentions that it uses VTWO to a large extent as a core holding. This likely comes from the ease with which it can enter and exit VTWO rather than all 2000 stocks in the actual index. The latter choice can become a pain in times of large movements of funds in and out of the ETF. What is unclear though is why RYLD bothers to do anything but own VTWO and sell calls. Why the actual ownership of close to 2000 different companies? As you look at the list it does start to look pretty silly at the end where RYLD actually owns a single share in many companies.
Global X – RYLD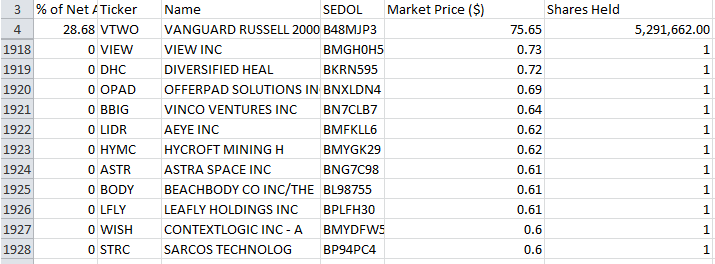
That peculiarity aside, the fund does do a good job of tracking its benchmark index.
Global X – RYLD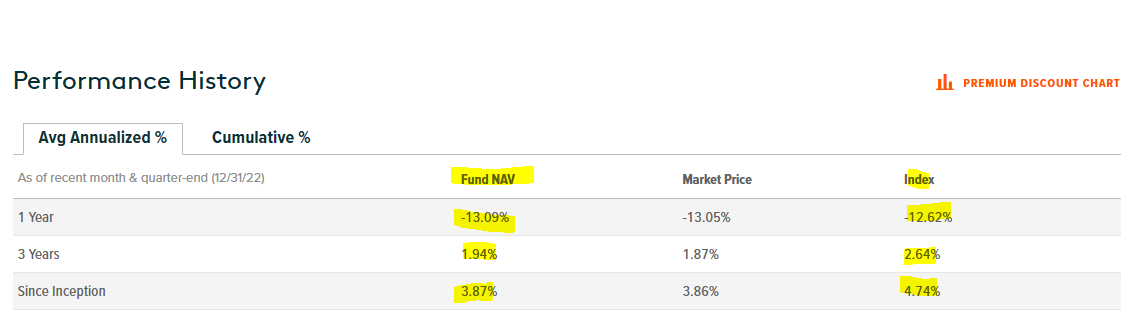
The fund does lag the index by about 0.6% to 0.9% annually, but that is to be expected. The CBOE index does not have expenses, while RYLD obviously does.
Global X -RYLD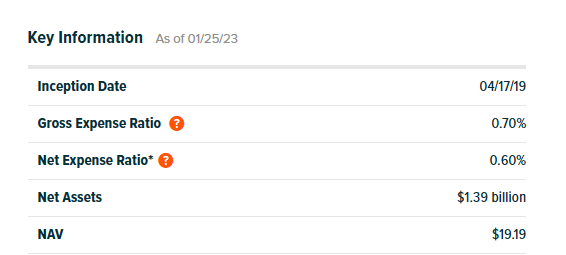
The lag is in the ballpark of the expense ratio. That is pretty good considering that option writing is a complicated task on an index with so many holdings.
What Happened Since We Wrote That Article
Since we wrote that piece and upset the fan club by calling for 5% total returns, RYLD has certainly performed as expected. While the yield was fat and the NAV losses were fatter.
Seeking Alpha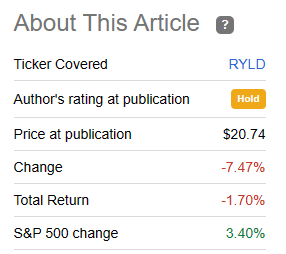
Total return went to negative 1.7% and trailed the S&P 500 (SPY) by 5.1%. Of course, the SPY is hardly an appropriate benchmark for RYLD. There are two better comparatives. The first being the CBOE Russell 2000 Buy Write Index shown earlier. As we know, RYLD tracks that pretty well. But a more appropriate benchmark for the discerning, math-conscious, investor, is the actual Russell 2000. For that, we can use VTWO above as well as iShares Russell 2000 ETF (IWM). Since VTWO and IWM track each other to almost the third decimal point on a day-by-day basis, the two actually look like one line to everyone outside those blessed with falcon vision.
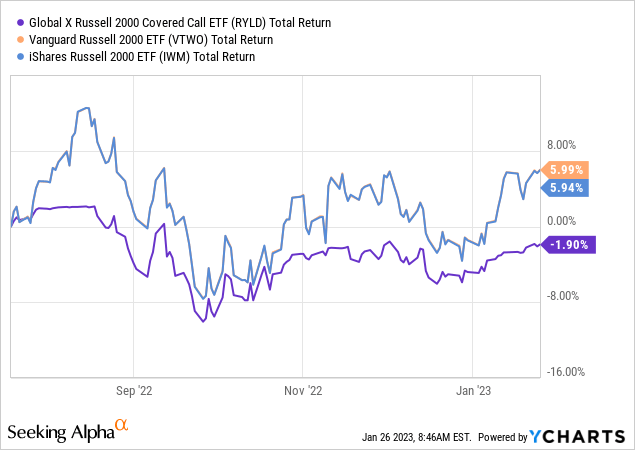
So there is your loss and there is your opportunity cost for wanting an unrealistic yield.
Mind you, those are total returns including your distributions, so that 8% lag (or about 16% annualized) must really hurt. Fortunately for RYLD shareholders, over longer timeframes, the fund has not amplified this bad performance.
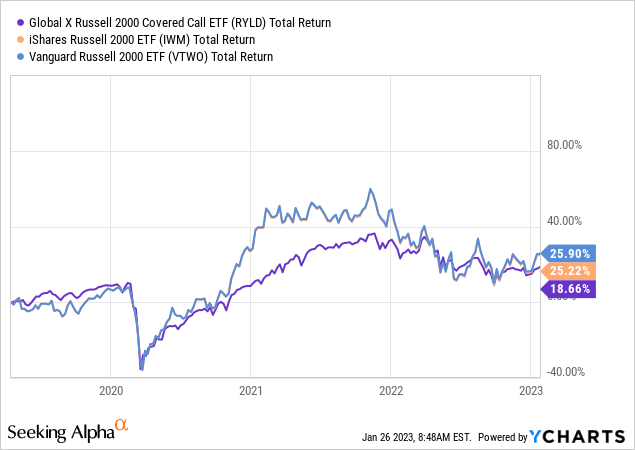
What is also rather apparent from the chart above is that the fund provided very little buffer during COVID-19. So you did not get much for giving up returns.
Outlook
The stocks of the Russell 2000 will be most influenced by where the US economy goes. In that area, it appears very unlikely that we dodge a recession.
The Conference Board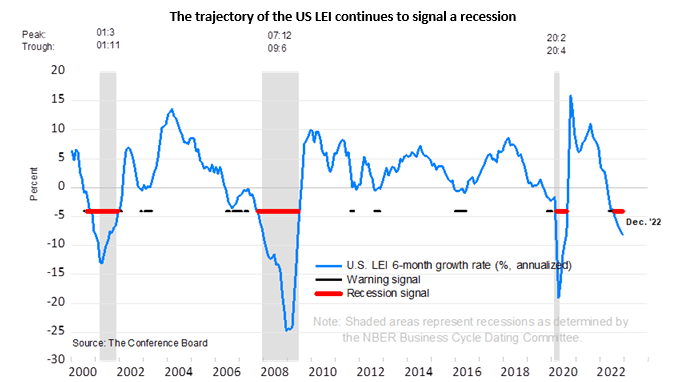
That is one strike for owning RYLD here.
The second strike of course comes from the passive investing bubble. When you buy RYLD you indirectly buy this comedy show.
Morgan Stanley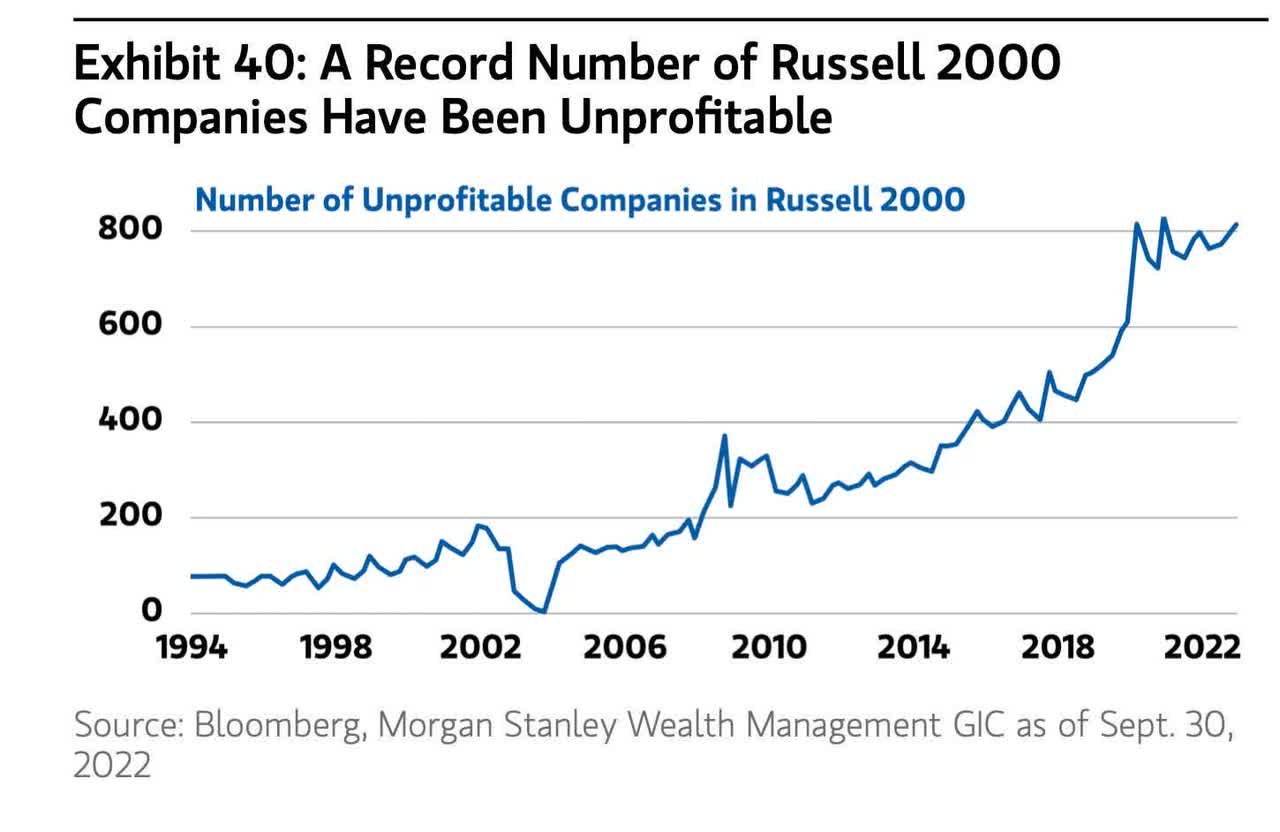
The biggest fiscal stimulus and biggest monetary stimulus of all time, and Russell 2000 companies look like the walking dead. Actually, somebody with far more clout than us used that term for companies that could not even cover their interest payments.
Leuthold Group – Twitter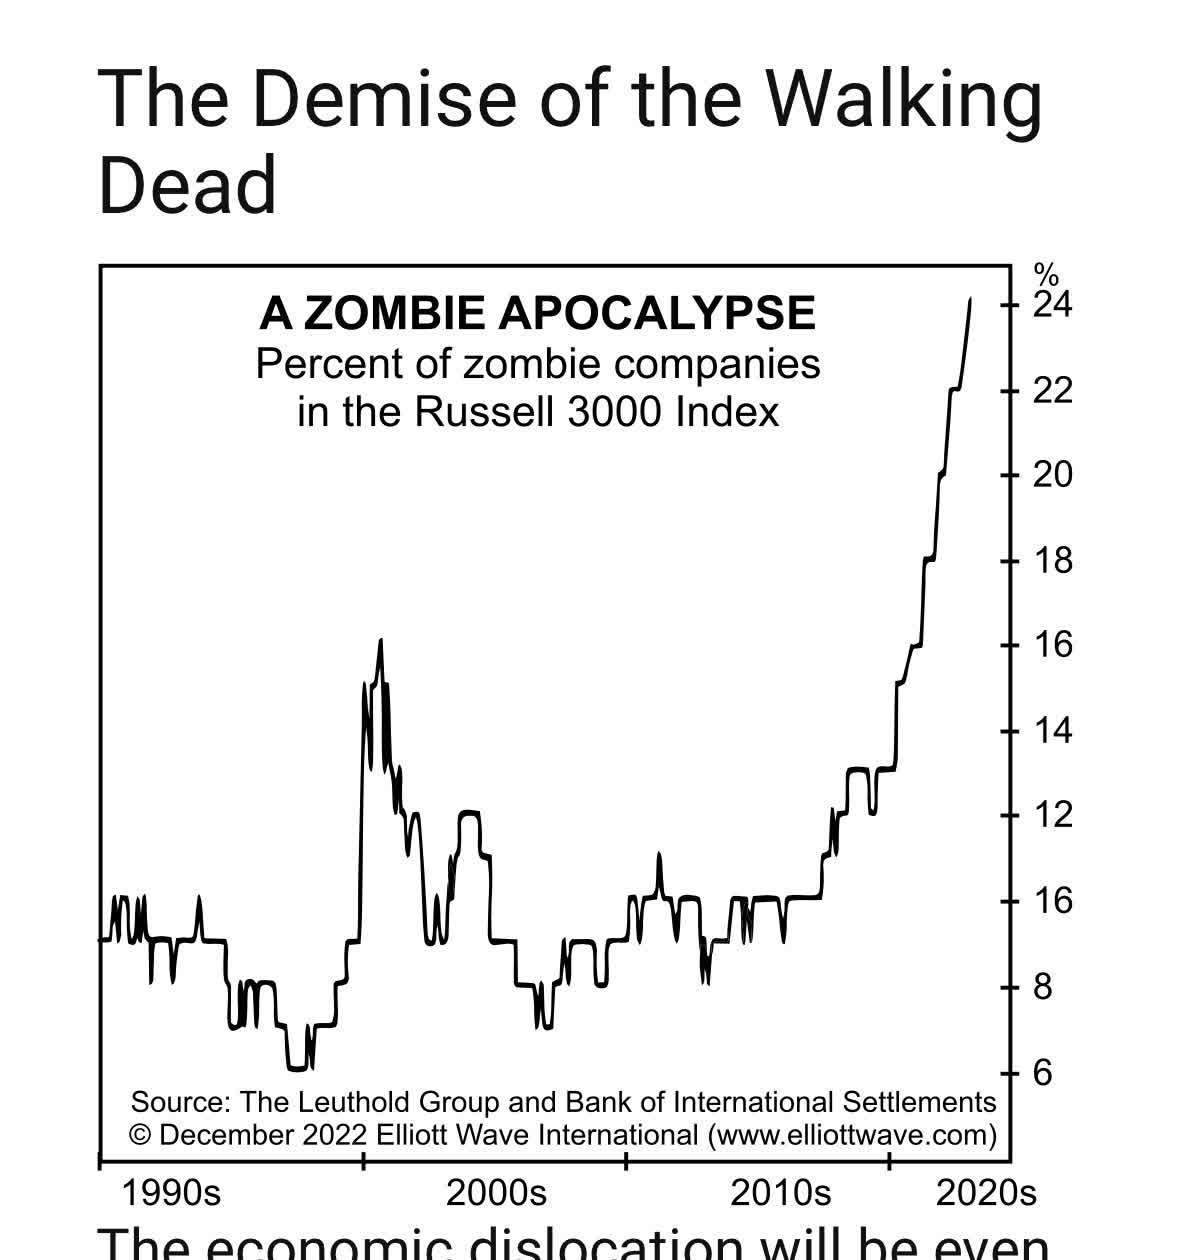
So count us out of investing in a passive index here.
The final issue here is the big whipsaws that RYLD faces. Most covered call funds sell options that expire a month or so away. This forces the fund to give away the upside when the index rallies. At option expiration, these contracts are closed out at a loss and the cycle restarts. In our opinion, these types of options are unsuitable for the bear market ahead and could result in even more severe losses than the index without covered calls.
What To Consider Instead
For those looking for income and having an enormous faith in the passive index methodology, we would suggest a method that involves selling longer-term covered calls.
Interactive Brokers Jan 26, 2023
For example, purchasing IWM today and selling the January 2024 calls would produce about 12% in income, including the underlying dividends.
Author’s App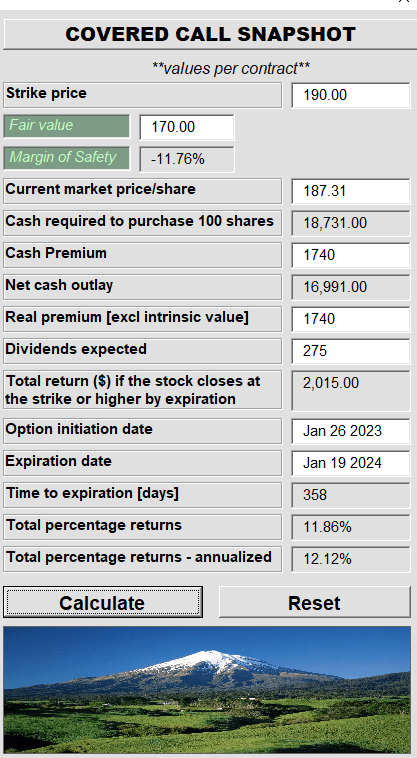
We have ignored the 269 cents between the current price and the strike in our calculations, but that would increase your returns slightly (by about 1.5%). The advantage here is that you are refusing to enter the game of whipsawing. Sure, the index could go higher, and you would have to decide once your shares are called away in 2024 whether you want to repeat the strategy at a different price point. But here is the thing, you are locking in a far higher upfront yield than the total returns RYLD has produced.
Global X – RYLD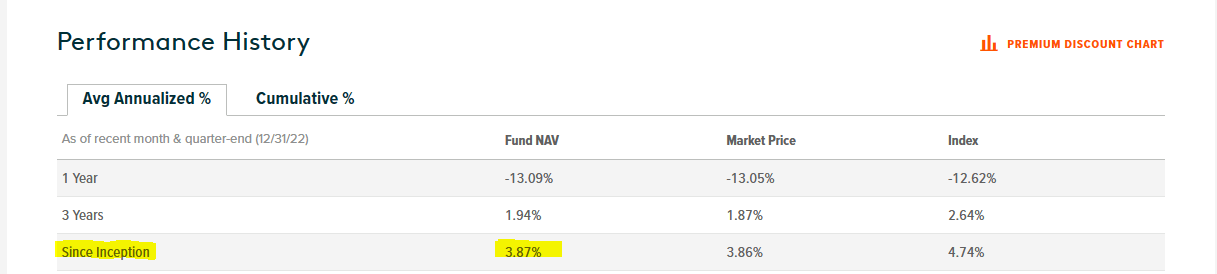
We also stand by our earlier prediction that RYLD will struggle to make more than 5% in total returns. So locking in that yield one year out looks like a good bet. We will check back on this in due course and see which yield did better.
Please note that this is not financial advice. It may seem like it, sound like it, but surprisingly, it is not. Investors are expected to do their own due diligence and consult with a professional who knows their objectives and constraints.
Be the first to comment