

Adrian Vidal/iStock via Getty Images
Covered Call ETFs such as the investment vehicles from Global X have become extremely popular over the past several years. When a fund is generating double-digit yields, investors generally take notice. Global X has 3 main Covered-Call ETFs as part of its income-focused strategies, which include The Global X Nasdaq 100 Covered Call ETF (QYLD), The Global X S&P 500 Covered Call ETF (XYLD), and The Global X Russell 2000 Covered Call ETF (BATS:RYLD). All 3 ETFs are generating yields in the double-digits, and after my 2 recent articles, I wanted to see which fund has been the best investment.
I am a current shareholder of QYLD, XYLD, and RYLD, with QYLD being my largest position among the three. The Covered-Call income strategy has resonated with me as I sell covered calls on specific investments to generate additional income. While I am a fan of selling covered calls and investing in the Global X products, there has to be a winner among the three investments. As you can see from the title, RYLD has performed better than both XYLD and QYLD in the period I selected. In this article, I will outline my analysis and explain why I like RYLD as a future income investment. This is a data-driven approach by the numbers, so if you like math, you will find the next sections interesting.
Global X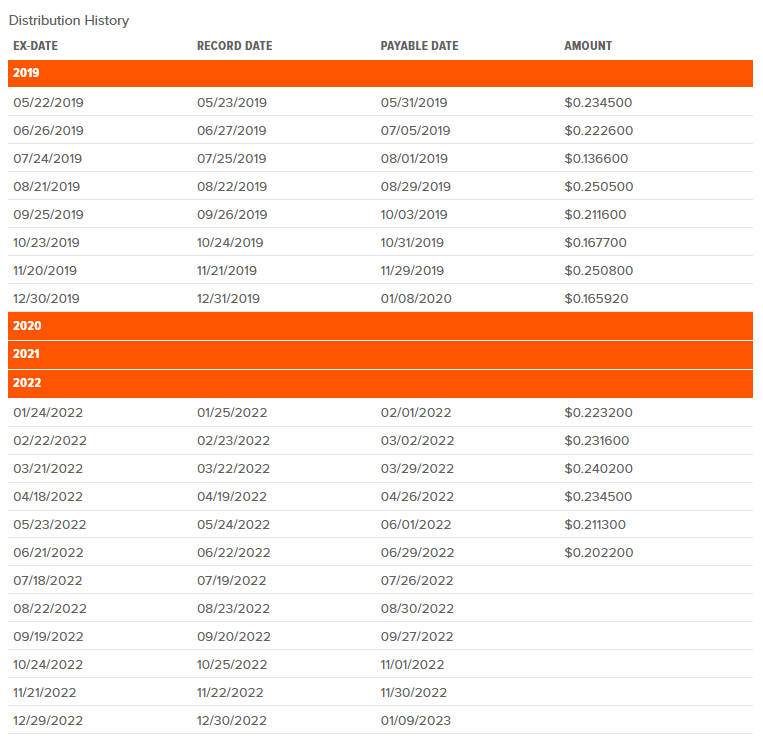
RYLD takes gold while XYLD takes silver and QYLD is stuck with bronze
For my side-by-side comparison, I will assume 100 shares were purchased on 1/4/21, and all of the income has been taken as distributions and not reinvested. I will show the following metrics in the analysis:
- Initial investment
- Current investment
- Profit or loss
- Initial Investment ROI
- Distributions Collected
- Investment distribution yield since 1/4/21
- Total profit
- Total ROI
To start out, I took the share price of each fund on 1/4/21 and multiplied it by 100 shares for my starting amount (QYLD $22.69 * 100), (RYLD $22.37 * 100), and (XYLD $46.16 * 100). Next, I went to the Global X page and looked at the distribution from every month since January of 2021 and calculated the monthly distribution income. Here are the results.
QYLD takes 3rd place:
| Initial Investment 1/4/21 | |||||||
| Ticker | Share Price | Shares | Initial Investment | ||||
| QYLD | $22.69 | 100 | $2,269.00 | ||||
| Year | Ticker | Share Price on Payable Date | Shares | Current Investment | Distribution per share | Monthly Distribution | |
| 2021 | Jan | QYLD | $22.90 | 100.00 | $2,290.00 | $0.23 | $22.88 |
| 2021 | Feb | QYLD | $22.67 | 100.00 | $2,267.00 | $0.23 | $23.33 |
| 2021 | Mar | QYLD | $22.41 | 100.00 | $2,241.00 | $0.22 | $22.39 |
| 2021 | Apr | QYLD | $22.60 | 100.00 | $2,260.00 | $0.23 | $22.83 |
| 2021 | May | QYLD | $22.25 | 100.00 | $2,225.00 | $0.22 | $22.07 |
| 2021 | Jun | QYLD | $22.44 | 100.00 | $2,244.00 | $0.19 | $19.39 |
| 2021 | Jul | QYLD | $22.43 | 100.00 | $2,243.00 | $0.22 | $22.30 |
| 2021 | Aug | QYLD | $23.02 | 100.00 | $2,302.00 | $0.19 | $18.79 |
| 2021 | Sep | QYLD | $22.14 | 100.00 | $2,214.00 | $0.19 | $19.02 |
| 2021 | Oct | QYLD | $22.74 | 100.00 | $2,274.00 | $0.20 | $19.66 |
| 2021 | Nov | QYLD | $22.15 | 100.00 | $2,215.00 | $0.22 | $22.46 |
| 2021 | Dec | QYLD | $21.85 | 100.00 | $2,185.00 | $0.50 | $49.94 |
| 2022 | Jan | QYLD | $20.87 | 100.00 | $2,087.00 | $0.20 | $20.30 |
| 2022 | Feb | QYLD | $20.16 | 100.00 | $2,016.00 | $0.20 | $20.20 |
| 2022 | Mar | QYLD | $21.04 | 100.00 | $2,104.00 | $0.21 | $20.97 |
| 2022 | Apr | QYLD | $19.50 | 100.00 | $1,950.00 | $0.21 | $20.51 |
| 2022 | May | QYLD | $18.67 | 100.00 | $1,867.00 | $0.18 | $17.85 |
| 2022 | June | QYLD | $17.37 | 100.00 | $1,737.00 | $384.89 | |
An initial investment of 100 shares of QYLD would have cost $2,269 on 1/4/21. Since then, QYLD has declined from $22.69 to $17.37. The initial investment has declined by -$532, which exceeds the $384.89 of distributions QYLD has paid over the past 17 months.
XYLD takes 2nd place:
If you had purchased 100 shares of XYLD on 1/4/21, it would have cost $4,616. Since the purchase date, XYLD has declined to $4,2.40, leaving investors with a -$376 return over the past 17 months. XYLD has offset the loss of capital by generating $698.50 in distributions over this period, leaving investors with a net gain.
| Initial Investment 1/4/21 | |||||||
| Ticker | Share Price | Shares | Initial Investment | ||||
| XYLD | $46.16 | 100 | $4,616.00 | ||||
| Year | Ticker | Share Price on Payable Date | Shares | Current Investment | Distribution per share | Monthly Distribution | |
| 2021 | Jan | XYLD | $46.24 | 100.00 | $4,624.00 | $0.48 | $47.63 |
| 2021 | Feb | XYLD | $46.73 | 100.00 | $4,673.00 | $0.36 | $35.96 |
| 2021 | Mar | XYLD | $47.69 | 100.00 | $4,769.00 | $0.42 | $41.98 |
| 2021 | Apr | XYLD | $47.89 | 100.00 | $4,789.00 | $0.36 | $36.11 |
| 2021 | May | XYLD | $48.47 | 100.00 | $4,847.00 | $0.33 | $33.34 |
| 2021 | Jun | XYLD | $49.08 | 100.00 | $4,908.00 | $0.39 | $38.65 |
| 2021 | Jul | XYLD | $48.79 | 100.00 | $4,879.00 | $0.34 | $33.65 |
| 2021 | Aug | XYLD | $49.80 | 100.00 | $4,980.00 | $0.37 | $37.28 |
| 2021 | Sep | XYLD | $48.84 | 100.00 | $4,884.00 | $0.37 | $37.00 |
| 2021 | Oct | XYLD | $50.32 | 100.00 | $5,032.00 | $0.35 | $34.51 |
| 2021 | Nov | XYLD | $48.74 | 100.00 | $4,874.00 | $0.36 | $36.46 |
| 2021 | Dec | XYLD | $50.72 | 100.00 | $5,072.00 | $0.46 | $45.77 |
| 2022 | Jan | XYLD | $48.30 | 100.00 | $4,830.00 | $0.48 | $48.08 |
| 2022 | Feb | XYLD | $47.84 | 100.00 | $4,784.00 | $0.48 | $48.35 |
| 2022 | Mar | XYLD | $49.70 | 100.00 | $4,970.00 | $0.50 | $50.14 |
| 2022 | Apr | XYLD | $47.11 | 100.00 | $4,711.00 | $0.49 | $49.47 |
| 2022 | May | XYLD | $44.44 | 100.00 | $4,444.00 | $0.44 | $44.11 |
| 2022 | Jun | XYLD | $42.40 | 100.00 | $4,240.00 | $698.50 | |
RYLD takes 1st and still holds the crown:
RYLD is not my largest position of these 3 funds, but by the numbers, it should be. 100 shares of RYLD on 1/4/21 would have cost roughly the same amount as QYLD as shares of RYLD traded at $22.37. The 100-share investment would have cost $2,237, which generated a -$210 capital return over the previous 7 months, but it generated $415.51 in distributions.
| Initial Investment 1/4/21 | |||||||
| Ticker | Share Price | Shares | Initial Investment | ||||
| RYLD | $22.37 | 100 | $2,237.00 | ||||
| Year | Month | Ticker | Share Price on Payable Date | Shares | Current Investment | Distribution per share | Monthly Distribution |
| 2021 | January | RYLD | $22.64 | 100.00 | $2,264.00 | $0.23 | $22.72 |
| 2021 | February | RYLD | $23.63 | 100.00 | $2,363.00 | $0.24 | $24.01 |
| 2021 | March | RYLD | $23.99 | 100.00 | $2,399.00 | $0.24 | $24.46 |
| 2021 | April | RYLD | $24.97 | 100.00 | $2,497.00 | $0.25 | $24.93 |
| 2021 | May | RYLD | $25.22 | 100.00 | $2,522.00 | $0.25 | $24.84 |
| 2021 | June | RYLD | $25.57 | 100.00 | $2,557.00 | $0.25 | $24.75 |
| 2021 | July | RYLD | $24.83 | 100.00 | $2,483.00 | $0.25 | $24.58 |
| 2021 | August | RYLD | $25.26 | 100.00 | $2,526.00 | $0.25 | $25.10 |
| 2021 | September | RYLD | $25.00 | 100.00 | $2,500.00 | $0.25 | $25.19 |
| 2021 | October | RYLD | $25.20 | 100.00 | $2,520.00 | $0.25 | $24.74 |
| 2021 | November | RYLD | $23.73 | 100.00 | $2,373.00 | $0.25 | $25.45 |
| 2021 | December | RYLD | $24.18 | 100.00 | $2,418.00 | $0.31 | $30.66 |
| 2022 | January | RYLD | $22.98 | 100.00 | $2,298.00 | $0.22 | $22.32 |
| 2022 | February | RYLD | $23.26 | 100.00 | $2,326.00 | $0.23 | $23.16 |
| 2022 | March | RYLD | $24.06 | 100.00 | $2,406.00 | $0.24 | $24.02 |
| 2022 | April | RYLD | $22.37 | 100.00 | $2,237.00 | $0.23 | $23.45 |
| 2022 | May | RYLD | $22.12 | 100.00 | $2,212.00 | $0.21 | $21.13 |
| 2022 | June | RYLD | $20.27 | 100.00 | $2,027.00 | $415.51 | |
The results:
|
Total ROI and Statistics for RYLD, XYLD, and QYLD |
|||
|
RYLD |
XYLD |
QYLD |
|
|
Initial Investment |
$2,237.00 |
$4,616.00 |
$2,269.00 |
|
Current Investment |
$2,027.00 |
$4,240.00 |
$1,737.00 |
|
Profit |
-$210.00 |
-$376.00 |
-$532.00 |
|
Initial Investment ROI |
-9.39% |
-8.15% |
-23.45% |
|
Current Distributions Paid |
$415.51 |
$698.50 |
$384.89 |
|
Yield on Investment |
18.57% |
15.13% |
16.96% |
|
Total Profit |
$205.51 |
$322.50 |
-$147.11 |
|
Total ROI |
9.19% |
6.99% |
-6.48% |
Since the starting investment amount was different for these three funds, I am basing the results on a percentage basis. When I compare income investments such as RYLD, XYLD, and QYLD, I want to see how the following categories stack up:
- downside protection for invested capital
- what the initial investment ROI was
- how much the distributions amounted to
- what the yield on my initial investment was
- total profit/ROI once the distributions were factored in.
XYLD was the best investment when it came to protecting an investor’s downside. The initial investment of 100 shares declined by -8.15%, while RYLD was behind it with a -9.39% return. QYLD has been horrific as -23.45% of an investor’s capital has been erased since 1/4/21, which is almost triple the amount of XYLD.
By the initial investments ROI metric XYLD would be the preferred investment among these Covered-Call ETFs, but this single metric doesn’t tell the whole story. Since these investments are specifically designed to generate large amounts of income, the distributions paid need to be factored into the equation. All 3 ETFs have generated 17 monthly distributions since 1/4/17, with XYLD producing $698.50 in income, RYLD with $415.51, and QYLD with $384.89. From a yield on initial investment perspective, RYLD has generated 18.57% of its initial investment in distributions, while QYLD generated 16.96%, and XYLD generated 15.13%. While XYLD protected the initial capital better, RYLD and QYLD produced more income on a percentage basis, and RYLD took the win in this category.
You can’t solely judge one of these ETFs on how much the initial investment is up or down or by the percentage of distributions they generated. Since these are still income-producing assets, I feel the best way to look at these investments is from an overall methodology by combining the losses/profits and the distributions to find the total investment ROI. QYLD has been the worst investment of the group, as when you net out the distributions from the losses, an investor still ends up with a -$147.11 loss for a -6.48% overall return. XYLD jumps into the green on the total ROI as its $698.50 nets out the -$376 of losses creating a total return of $322.50 or a total ROI of 6.99%. RYLD has retained the crown since the last time I compared these 3 ETFs. RYLD has generated $415.51 in distributions which left investors with a $205.51 profit after the -$210 in losses were netted out. RYLD’s total ROI was 9.19% on the initial investment of 100 shares. Investors would have been better off with RYLD than XYLD or QYLD as it had the largest yield on investment and the largest total ROI.
RYLD hit the public markets in April of 2019, has established a long track record of income, and dismantled the bear thesis
RYLD went public on 4/17/19 for $25 per share. Since then, RYLD has paid 37 consecutive distributions without missing a single month. RYLD has established a long track record of distribution income from its Covered-Call strategy to investors. Since May of 2019, RYLD has paid $8.23 per share in distributions, which is an investment yield of 32.91% on its initial $25 share price. Shares of RYLD have declined by -14.84% as they are now trading at $21.29, losing -$3.71 in value. Investors of RYLD have still generated an 18.65% ROI since its initial $25 share price as the -$3.71 of lost capital appreciation has been offset by the $8.23 of distributions.
| Initial Investment 4/17/19 | ||||||||
| Ticker | Share Price | Shares | Initial Investment | |||||
| RYLD | $25.00 | 100 | $2,500.00 | |||||
| Ticker | Share Price on Payable Date | Shares | Current Investment | Distribution per share | Monthly Distribution | |||
| 2019 | May | RYLD | $24.04 | 100.00 | $2,404.00 | $0.23 | $23.45 | |
| 2019 | June | RYLD | $25.64 | 100.00 | $2,564.00 | $0.22 | $22.26 | |
| 2019 | July | RYLD | $25.64 | 100.00 | $2,564.00 | $0.14 | $13.66 | |
| 2019 | August | RYLD | $24.89 | 100.00 | $2,489.00 | $0.25 | $25.05 | |
| 2019 | September | RYLD | $24.28 | 100.00 | $2,428.00 | $0.21 | $21.16 | |
| 2019 | October | RYLD | $25.22 | 100.00 | $2,522.00 | $0.17 | $16.77 | |
| 2019 | November | RYLD | $25.45 | 100.00 | $2,545.00 | $0.25 | $25.08 | |
| 2019 | December | RYLD | $25.57 | 100.00 | $2,557.00 | $0.17 | $16.59 | |
| 2020 | January | RYLD | $24.94 | 100.00 | $2,494.00 | $0.20 | $19.58 | |
| 2020 | February | RYLD | $22.84 | 100.00 | $2,284.00 | $0.24 | $23.87 | |
| 2020 | March | RYLD | $17.10 | 100.00 | $1,710.00 | $0.16 | $15.85 | |
| 2020 | April | RYLD | $18.05 | 100.00 | $1,805.00 | $0.18 | $17.60 | |
| 2020 | May | RYLD | $19.43 | 100.00 | $1,943.00 | $0.19 | $18.70 | |
| 2020 | June | RYLD | $19.45 | 100.00 | $1,945.00 | $0.19 | $19.21 | |
| 2020 | July | RYLD | $20.25 | 100.00 | $2,025.00 | $0.20 | $20.21 | |
| 2020 | August | RYLD | $20.82 | 100.00 | $2,082.00 | $0.21 | $20.78 | |
| 2020 | September | RYLD | $20.64 | 100.00 | $2,064.00 | $0.21 | $20.90 | |
| 2020 | October | RYLD | $20.94 | 100.00 | $2,094.00 | $0.21 | $21.37 | |
| 2020 | November | RYLD | $22.50 | 100.00 | $2,250.00 | $0.22 | $22.18 | |
| 2020 | December | RYLD | $23.13 | 100.00 | $2,313.00 | $0.23 | $22.83 | |
| 2021 | January | RYLD | $22.64 | 100.00 | $2,264.00 | $0.23 | $22.72 | |
| 2021 | February | RYLD | $23.63 | 100.00 | $2,363.00 | $0.24 | $24.01 | |
| 2021 | March | RYLD | $23.99 | 100.00 | $2,399.00 | $0.24 | $24.46 | |
| 2021 | April | RYLD | $24.97 | 100.00 | $2,497.00 | $0.25 | $24.93 | |
| 2021 | May | RYLD | $25.22 | 100.00 | $2,522.00 | $0.25 | $24.84 | |
| 2021 | June | RYLD | $25.57 | 100.00 | $2,557.00 | $0.25 | $24.75 | |
| 2021 | July | RYLD | $24.83 | 100.00 | $2,483.00 | $0.25 | $24.58 | |
| 2021 | August | RYLD | $25.26 | 100.00 | $2,526.00 | $0.25 | $25.10 | |
| 2021 | September | RYLD | $25.00 | 100.00 | $2,500.00 | $0.25 | $25.19 | |
| 2021 | October | RYLD | $25.20 | 100.00 | $2,520.00 | $0.25 | $24.74 | |
| 2021 | November | RYLD | $23.73 | 100.00 | $2,373.00 | $0.25 | $25.45 | |
| 2021 | December | RYLD | $24.18 | 100.00 | $2,418.00 | $0.31 | $30.66 | |
| 2022 | January | RYLD | $22.98 | 100.00 | $2,298.00 | $0.22 | $22.32 | |
| 2022 | February | RYLD | $23.26 | 100.00 | $2,326.00 | $0.23 | $23.16 | |
| 2022 | March | RYLD | $24.06 | 100.00 | $2,406.00 | $0.24 | $24.02 | |
| 2022 | April | RYLD | $22.37 | 100.00 | $2,237.00 | $0.23 | $23.45 | |
| 2022 | May | RYLD | $22.12 | 100.00 | $2,212.00 | $0.21 | $21.13 | |
| 2022 | June | RYLD | $21.29 | 100.00 | $2,129.00 | |||
The first half of 2022 hasn’t been great for investors as all the major indices have declined. When I look at RYLD in 2022, it hasn’t been the best investment, but it fared better than its respective index, the Russell 2000, the Nasdaq, and the S&P 500. Unless you went heavy into energy, there haven’t been many places to avoid the decline in equities. RYLD has provided monthly income in 2022 while protecting an investor’s downside. In 2022 RYLD has declined by -17.33%, while the SPDR S&P 500 Trust ETF (SPY) declined by -21.63%, the Vanguard Russell 2000 ETF (VTWO) declined by -25.22%, and the Invesco QQQ ETF (QQQ) declined by -30.13%.
Similar to my remarks about QYLD and XYLD, RYLD has protected investor’s downside better than the ETFs that track their respective indexes. The 3 major bear comments I have seen about RYLD and the other Covered-Call ETFs have been:
- They won’t generate significant income in a downturn
- They will fall further than the index funds that track their respective indexes on a % basis
- The trade-off of capital appreciation for income doesn’t make sense
RYLD has debunked these theories. First, RYLD has generated $1.14 per share of income over the first 5 distributions in 2022. RYLD started the year trading at $24.52 and so far has generated 4.65% of its starting share value in distributions in the first 5 months of 2022, which places it on track to deliver double-digit yields for investors who invested in RYLD at the beginning of the year. The argument about not creating significant income in a downturn has been disproven. The next argument about RYLD falling further than its respective indexes has also been debunked, which is illustrated by the chart below. Not only has RYLD fallen less than VTWO, but it’s also done better than SPY and QQQ. The 3rd bearish point that I often hear is that trading capital appreciation for income doesn’t make sense. Down markets are a perfect time to disprove this. In addition to declining less than the major indices and the ETFs that track them, RYLD has paid its investor’s monthly income throughout 2022. When the monthly distributions are factored in, RYLD is down roughly -12.68% on the year as 4.65% has currently been returned through distributions. Income investors have different investment needs than investors looking for appreciation, and in a downturn, monthly capital that can be relied upon can make a large difference.
Seeking Alpha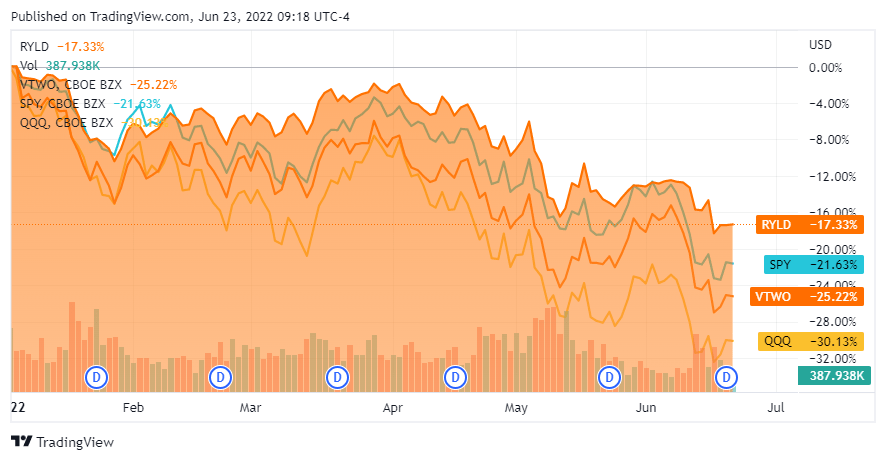
Conclusion
I should be investing more in RYLD than QYLD. While I am bullish on QYLD, RYLD, and XYLD, the numbers indicate that RYLD has been and still is the best investment of the three. Since the beginning of 2021, RYLD has had the largest total return on investment and the largest yield on investment. Currently, RYLD has a distribution yield of 12.16% and a 12-month trailing yield of 15.07%. The bearish comments that are often discussed have been disproven in 2022, and the mechanics of the Global X Covered Call ETFs work well in harsh investing environments. I will be allocating more capital toward RYLD in the future, and I would suggest that income investors look at RYLD as its double-digit yields hold up in good and bad times.
Be the first to comment