

Dilok Klaisataporn/iStock via Getty Images
Investment Thesis
This year, the Invesco S&P 500 Pure Value ETF (NYSEARCA:RPV) has been one of the best-performing large-cap value ETFs, outperforming the S&P 500 Index by nearly 17% YTD. Reasons include its high growth potential, low valuation, and exposure to high-interest-rate-friendly industries like insurance and oil and gas. This article will compare RPV’s strategy and fundamentals with a more popular broad-based value ETF and make the case that as long as inflation remains a problem, RPV is poised to succeed.
ETF Overview
Strategy and Performance
RPV tracks the S&P 500 Pure Value Index, representing S&P 500 stocks with the strongest value characteristics. S&P Dow Jones Indices scores and weights stocks based on three ratios: book value to price, earnings to price, and sales to price. Ratios are calculated on a trailing basis, which may be problematic when recent results aren’t reliable, like in 2020.
RPV is more expensive than most value ETFs, with an expense ratio of 0.35%. Turnover ratios are also somewhat elevated, averaging about 45% per year from 2017 to 2021. However, since the strategy is sound, the fees are worth it, and RPV’s performance since its inception back that up. Consider returns compared with the Vanguard Value ETF (VTV), the SPDR Portfolio S&P 500 Value ETF (SPYV), and the iShares Russell 1000 Value ETF (IWD).
Portfolio Visualizer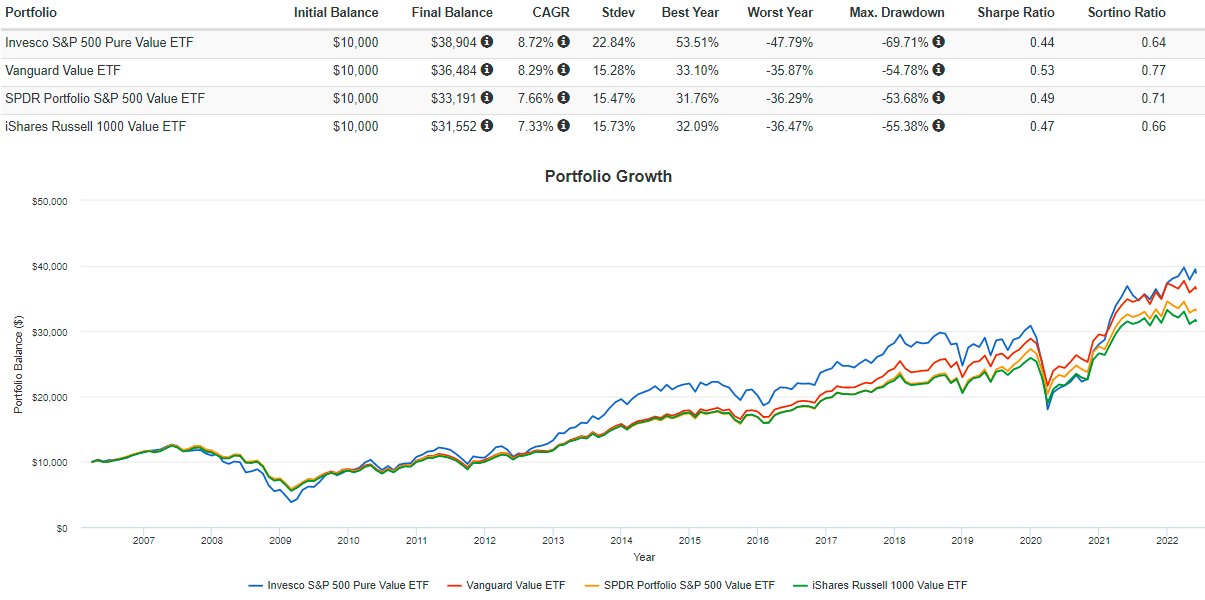
RPV’s annualized returns were 8.72%, or 0.43% better than VTV, its closest competitor. However, annualized volatility was substantially higher, unique for a value fund, and not a great feature for investors with short time horizons. Investors nearing retirement would find it difficult to stomach its 69.71% drawdown during the Great Financial Crisis or the 41.55% drawdown in Q1 2020. These figures were much worse than what other value ETFs and even the SPDR S&P 500 ETF (SPY) experienced.
Still, RPV has bounced back relatively quickly, and its rolling returns show how on average, RPV was the better choice for all roll periods listed (1,3,5,7,10, and 15 years). These results form the basis for my recommendation that those who can handle some excess volatility and not panic will be rewarded.
Portfolio Visualizer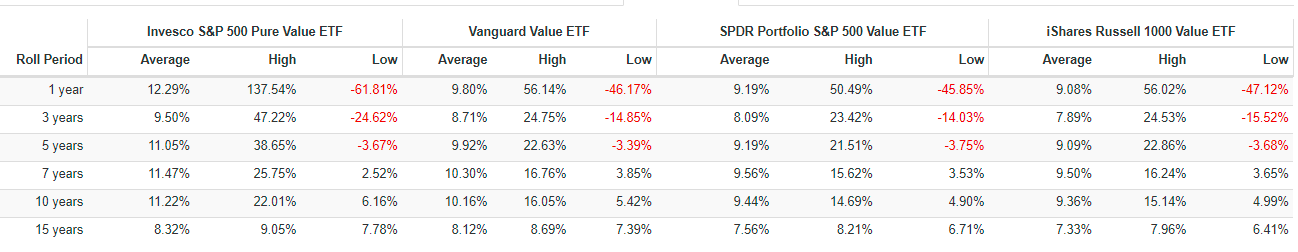
Sector Exposures and Top Ten Holdings
RPV is significantly overweight Financials at the moment, but except for Real Estate, it’s reasonably diversified across the GICS sectors. RPV also has the most exposure to Energy and Materials, meaning it’s likely to have some better protection against high inflation.
Morningstar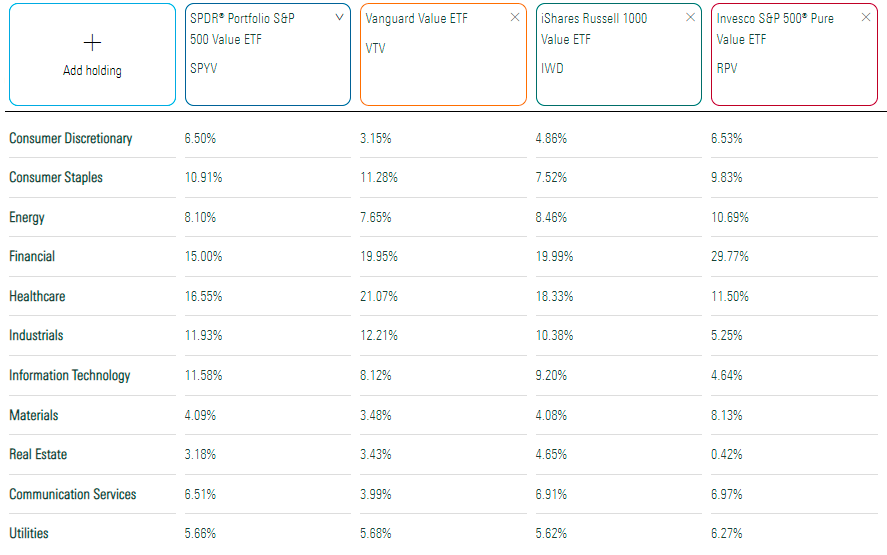
RPV’s top ten holdings include Marathon Petroleum (MPC), Valero Energy (VLO), and Berkshire Hathaway (BRK.B). Except for Berkshire, very few mega-cap companies are included. There are 120 holdings in total, representing 20% of the S&P 500, and the weighted-average market capitalization size of $59 billion is relatively small for a large-cap ETF.
Invesco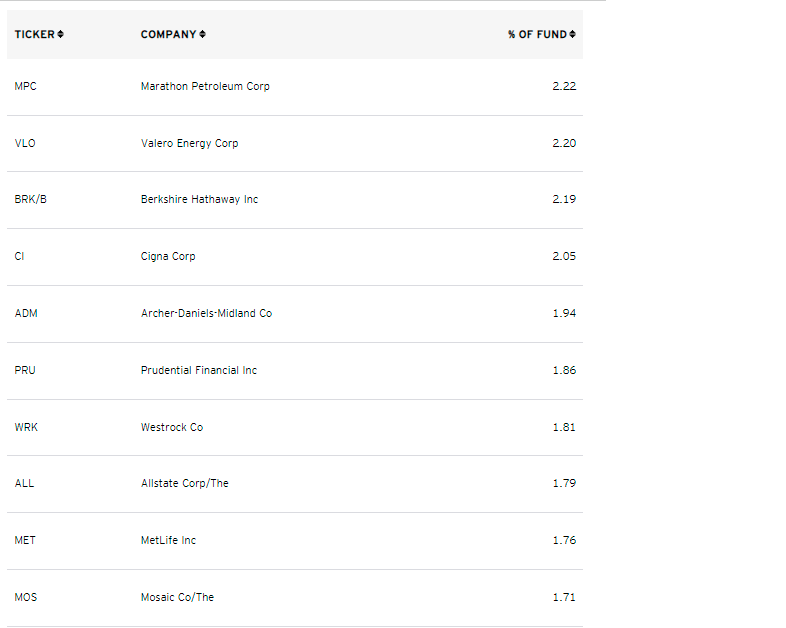
RPV Analysis
Heavy on Insurance: Most Likely, That’s A Good Thing
Within the Financials sector, RPV is overweight Life & Health Insurance (8.09%) and Property & Casualty Insurance (6.51%). RPV has nearly 20% exposure to insurance industries, which are usually quite volatile and highly sensitive to interest changes. To illustrate, I’ve simulated returns back to 2004 for these companies, showing how a hypothetical portfolio would have lost 73.37% during the Great Financial Crisis from June 2007 to February 2009.
Portfolio Visualizer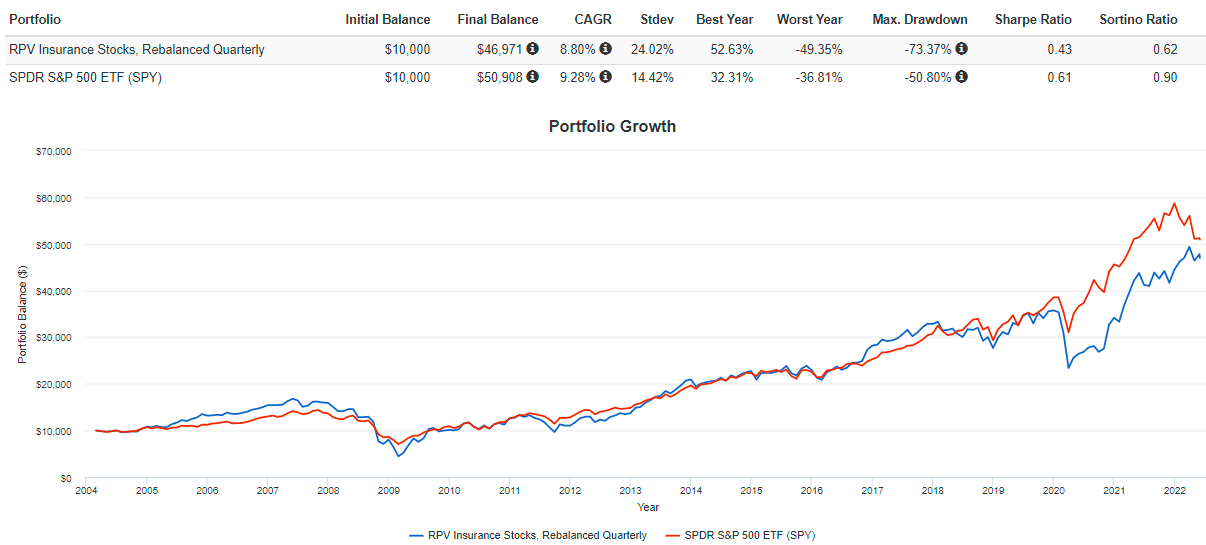
Most times, insurance stocks perform well in rising rate environments. I divided the results above into six-month periods and compared them with six-month changes in ten-year treasury yields. The table below highlights how this hypothetical insurance portfolio performed against the S&P 500 when yields changed substantially.
The Sunday Investor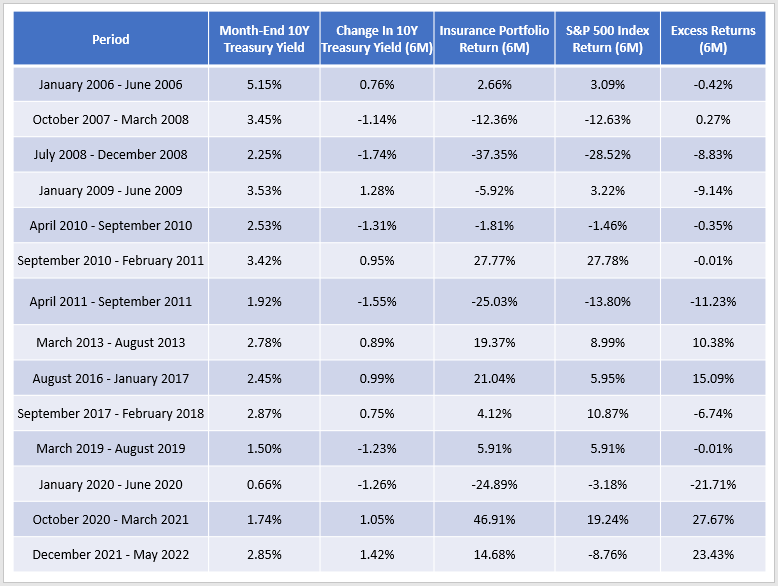
In the 2000s, there were four periods where yields changed more than one percent in six months. All were around the Great Recession, and for the period ending December 2008, the insurance portfolio lost 37.35% compared to 28.52% for the S&P 500. The portfolio fell a further 5.92% over the next six months, even as the S&P 500 notched a small gain and yields recovered to 3.53%.
Since then, the insurance portfolio became particularly sensitive to changes in treasury yields, resulting in return differences of 10% or more in six separate six-month periods. Interestingly, the portfolio outperformed all four times when yields increased and underperformed the two times they decreased. With yields expected to increase for the remainder of the year as the Federal Reserve attempts to gain control of inflation, RPV’s high allocation to these stocks makes sense. A risk is if the rate increases cause weakness in the economy and the Fed has to backtrack, but I don’t think that’s a concern in the near term.
Comparison With VTV
VTV is one of the better large-cap value ETFs available, and it’s also a popular choice because it’s so well-diversified. With about 350 holdings stretched across 113 unique GICS industries, Pharmaceuticals (7.29%) and Diversified Banks (5.33%) are the only two industries with weights above 5%. This level of diversification, plus the fact that VTV has nearly matched RPV’s returns since its inception, makes it an excellent alternative. Let’s see how the two ETFs compare.
The Sunday Investor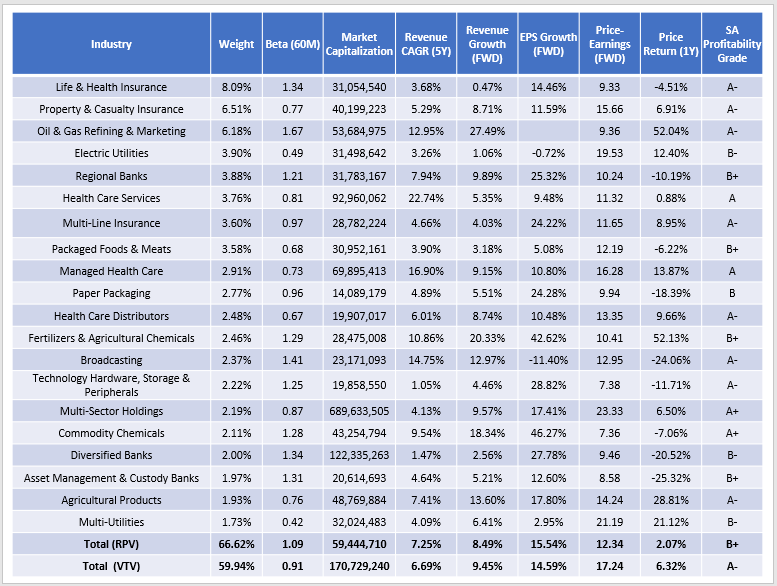
In my view, it’s a matter of how much you value diversification and low volatility over valuation. As mentioned previously, if you are looking to minimize potential losses because you think a recession is looming, RPV isn’t the right product. Its current five-year beta of 1.09 indicates it’s likely to perform worse than the market under these circumstances, consistent with how the ETF has performed historically.
However, its growth and valuation combination is solid. Estimated EPS growth for RPV is 15.54% compared to 14.59%, and most of that growth is coming from Financials sector stocks because increased interest rates will result in more substantial margins. The high allocations to oil industries also offer superior protection from inflation, which I believe will take at least a couple more quarters to get under control. Also, RPV’s forward price-earnings ratio of 12.34 is five points less than VTV’s and is the fourth cheapest on this metric in the large-cap value category. The three cheaper ones are:
- iShares Edge MSCI USA Value Factor ETF (VLUE)
- Invesco Russell Top 200 Pure Value ETF (SPVM)
- Invesco S&P 500 Enhanced Value ETF (SPVU)
It’s not surprising to see “pure” and “enhanced” value ETFs as the cheapest, but they’ve also been top performers lately. Over the last year, RPV, SPVM, and SPVU were the second-, third-, and fourth-best-performing large-cap value ETFs out of the 31 I track. Until there are signs that interest rate increases will pause or retreat, RPV should continue to do well.
Investment Recommendation
RPV is most appropriate for value investors not nearing retirement age who are willing and able to accept higher volatility. It substantially overweights insurance stocks which tend to perform better as long-term yields rise, and its Energy holdings offer some inflation protection every portfolio needs these days. RPV’s estimated growth and current valuation remain attractive, so I will be maintaining my buy rating today. Still, the critical point to remember is that RPV tends to bounce back strongly after substantial drawdowns. Even if you feel today’s price is too high, you can always place it on your buy list if the market corrects further. Thank you for reading, and I look forward to any questions in the comments section.
Be the first to comment