

cagkansayin/iStock via Getty Images
Investment Thesis
Some investors grow frustrated with the overlap so-called value ETFs have with their blended and growth counterparts. Sometimes, you don’t need to add another core ETF to your portfolio and just want to allocate capital most efficiently based on your market outlook. If this rings true, and you believe the rotation favoring value stocks will continue, consider putting the Invesco S&P 500 Pure Value ETF (NYSEARCA:RPV) on your watchlist.
RPV has 122 holdings, and it’s been on a tear over the last six months. From September to February, it was the best-performing large-cap value ETF, gaining 7.60% against an average of 0.99% for its 30 peers, and has added an extra 5.15% so far in March. And it has all the hallmarks of a true value fund, including a forward price-earnings ratio of 13.32, a trailing price-cash ratio of 10.89, and a trailing price-sales ratio of 1.40. In my view, RPV still has some runway left, and I’m rating it a buy today for those wanting to take a “pure” approach to value investing.
ETF Overview
Strategy and Fund Basics
RPV tracks the S&P 500 Pure Value Index, representing only the portion of the S&P 500 Index with the strongest value characteristics. There’s no overlap with the S&P 500 Pure Growth Index, so it’s an excellent way to go “all-in” on value to get the most bang for your buck. Fees are relatively high at 0.35%, but the impact will be minimal if you treat it as a short-term tactical play.
S&P Dow Jones Indices scores and weights value stocks based on three traditional and straightforward ratios: book value to price, earnings to price, and sales to price. All ratios are on a trailing basis, but I’ve supplemented this analysis with forward-looking metrics like forward price-earnings ratios and EPS revision trends. I feel this is necessary with changing market conditions. Before taking a closer look at RPV’s current makeup, here are some of the fund’s key statistics for easy referencing later.
- Current Price: $86.99
- Assets Under Management: $3.02 billion
- Shares Outstanding: 43.88 million
- Expense Ratio: 0.35%
- Launch Date: March 1, 2006
- Trailing Dividend Yield: 1.60%
- Five-Year Dividend CAGR: 7.56%
- Ten-Year Dividend CAGR: 11.92%
- Five-Year Beta: 1.12
- Number of Securities: 122
- Portfolio Turnover: 46% (44%, 46%, 37%, 46% From 2017-2020)
- Assets in Top Ten: 18.77%
- 30-Day Median Bid-Ask Spread: 0.04%
- Tracked Index: S&P 500 Pure Value Index
Sector Exposures and Top Ten Holdings
The table below highlights sector exposures for RPV and two other S&P 500 Value ETFs: the SPDR Portfolio S&P 500 Value ETF (SPYV) and the iShares S&P 500 Value ETF (IVE). SPYV and IVE track the same Index, but SPYV has a lower expense ratio (0.04% vs. 0.18%).
Morningstar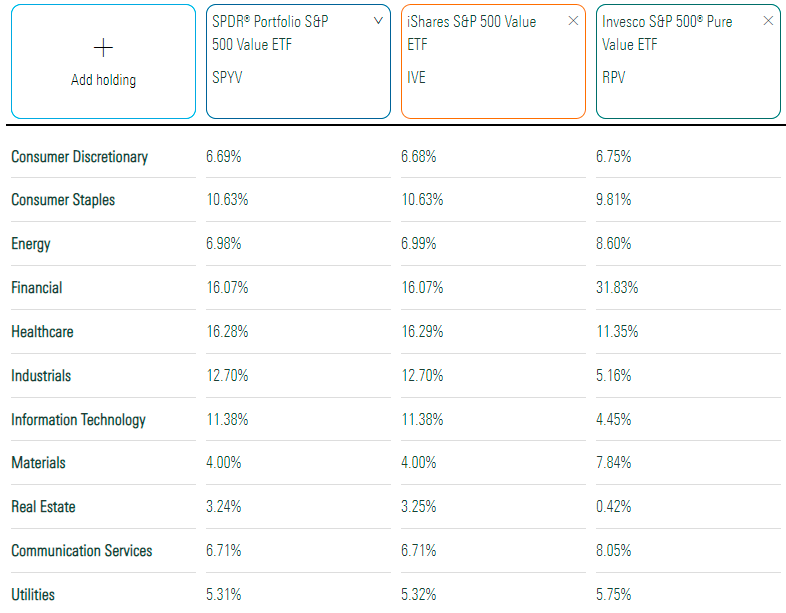
The biggest difference is that RPV overweights Financials by 16% and underweights Health Care by 5%, Industrials by 7.50%, and Technology by 7%. RPV favors Regional Banks and Insurance at the industry level but has less exposure to Pharmaceuticals, Biotechnology, Semiconductors, and Health care equipment. There’s also an interesting dynamic among Energy stocks. RPV overweights Oil & Gas Refining & Marketing stocks like Marathon Petroleum (MPC) and Valero Energy (VLO), but underweight oil majors like Exxon Mobil (XOM) and Chevron (CVX). These changes should give the ETF an extra growth boost should inflation continue to run hot.
I’ve listed the top ten holdings below, showing that it’s not concentrated, with the total being only 18.77%. Berkshire Hathaway (BRK.B) has a weighting of 2.37%, about a percentage point less than its weight in the S&P 500 Value Index. Other names include Prudential Financial (PRU), Archer-Daniels-Midland (ADM), and MetLife (MET).
Invesco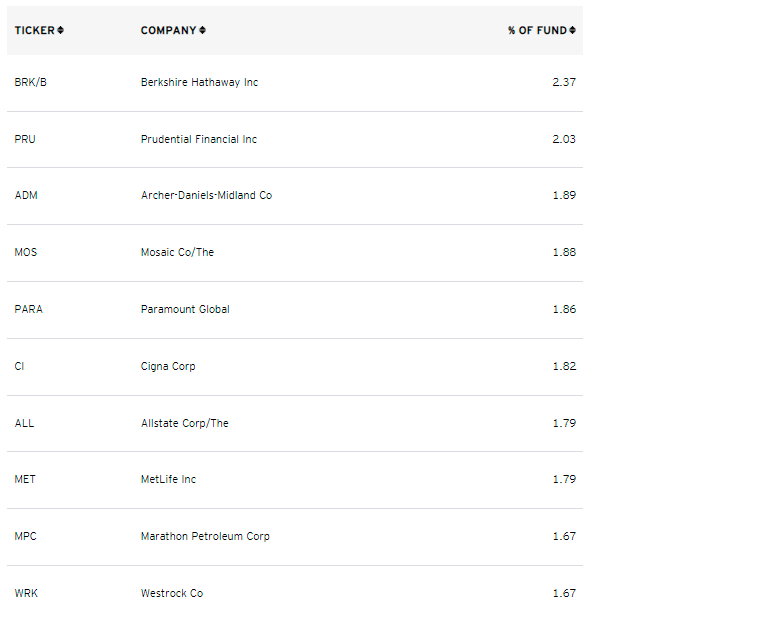
Historical Performance
Pure value ETFs have been among the worst performers over the last decade. Among 72 large-cap ETFs with at least a ten-year history through February, RPV sits in 58th place. It ranked 19th out of 21 among large-cap value ETFs in the last five years. However, it ranked fourth out of 16 ETFs with sufficient history during the previous ten years. The pure value approach works best as we extend our look-back to include periods where both growth and value were favored. Of course, if you’re confident that growth stocks will regain their strength shortly, it’s unlikely any of the value ETFs listed below are suitable.
Author
I’ve listed these alternatives for two reasons. First, it’s likely you already own one of the value ETFs listed above, and it’s helpful to know your options and how each performed over various periods. Second, it provides evidence of changing market conditions, meaning what worked in the past won’t necessarily work in the future. RPV has been the best performer over the last three and six months and the third-best performer over the last year. Only two other ETFs, SPVM and SPVU, which also take a pure value approach, did better, but they’ve all been poor performers over the last five years.
In my view, it’s crucial to recognize this changing environment. Otherwise, you might not even consider investing in a value ETF after seeing this graph:
Portfolio Visualizer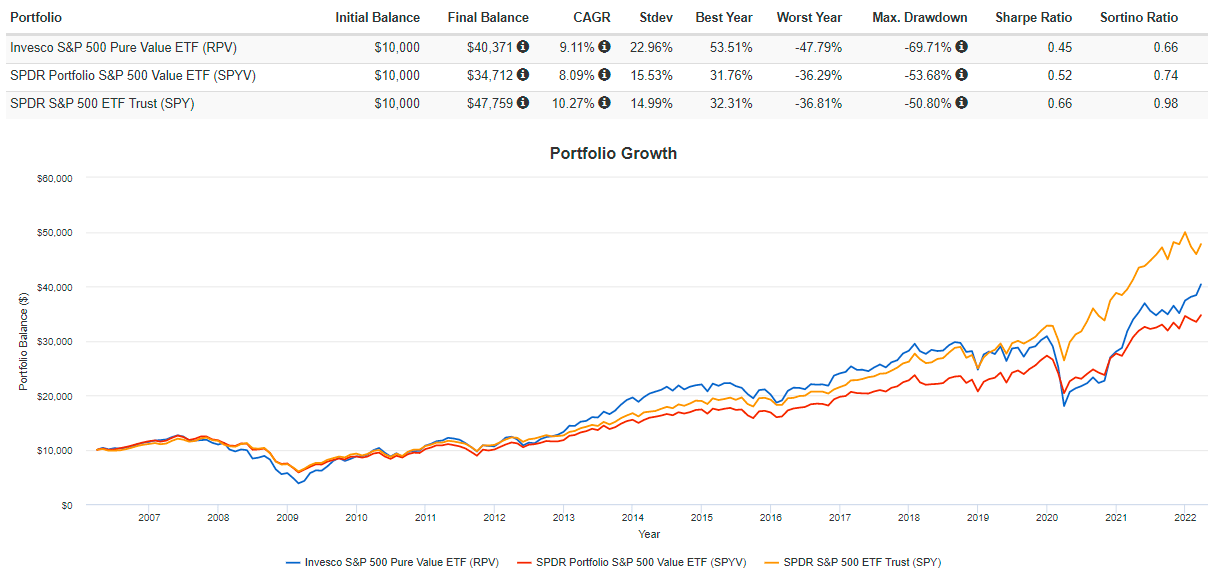
RPV not only has the worst long-term performance against SPYV and the SPDR S&P 500 ETF (SPY), but it’s also the most volatile. Volatility is a valid criticism of RPV, and I’ll address that soon, but you can still see the pockets of opportunity investors had in the early 2010s.
ETF Analysis
Recall how RPV favors the Financials sector, but bank stocks aren’t the driver. Insurance stocks across four industries (life and health, property and casualty, multi-line, and reinsurance) total 19.93% of the ETF. I’ve compiled a table of selected fundamental metrics for RPV’s top 20 industries to understand better how the fund is constructed. A comparison is made with SPYV to highlight the value of eliminating stocks with blend and growth features.
Author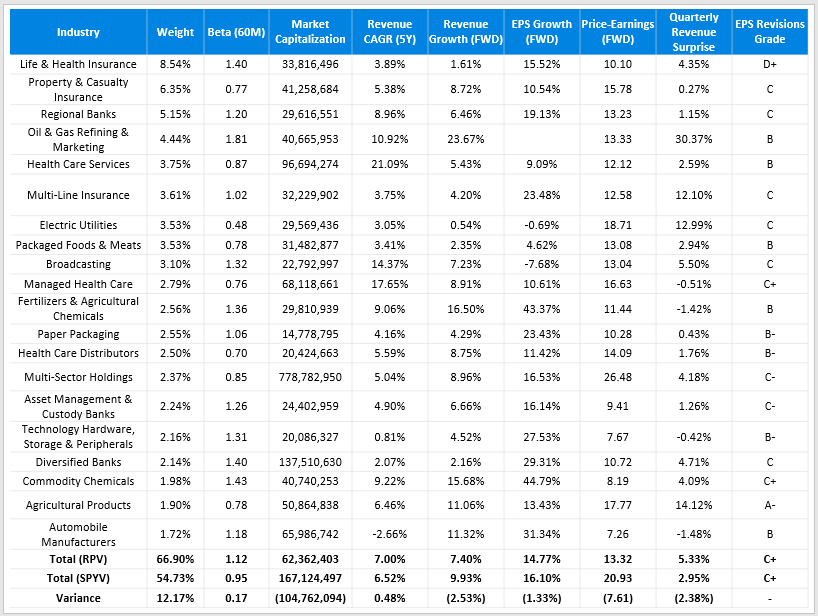
Let’s start with RPV’s shortcomings.
1. RPV’s weighted average market capitalization of $62 billion is substantially smaller than SPYV’s, so it favors the more overlooked S&P 500 stocks. While this makes sense given the relationship between value and price, it may be too aggressive of a move. I’ve normalized Seeking Alpha’s Profitability Grades on a scale of one to ten, and RPV’s score is 8.16 vs. 8.88 for SPYV. Both are still strong and much better than the 5.41 the SPDR S&P 600 Small Cap Value ETF (SLYV) offers. Still, I place a lot of importance on high profitability in times of uncertainty, believing that these stocks will be the first to recover should things go south.
2. Linked to the lower market capitalization is RPV’s higher five-year beta of 1.12. Again, it’s intuitive since smaller-sized stocks tend to be more volatile and less influence the broader market indices. However, it’s relevant for those wanting to control portfolio risk. RPV won’t be as effective at reducing risk as, say, high-dividend ETFs, which tend to have betas in the 0.85 to 0.95 range.
3. I’ve framed RPV’s pure value approach positively thus far, but some may consider it a negative, given its 12.17% more concentrated in its top 20 industries. Indeed, a 32% exposure to Financials stocks is aggressive, so RPV may be more appropriate as a “satellite” holding than a core one.
Next, let’s go over some of RPV’s positive features, which I believe outweigh the negatives.
1. The five-year revenue growth rate for RPV is stronger than SPYV (7.00% vs. 6.52%). Not shown in the table above, but RPV’s five-year total return based on current weightings is only 49.61% compared to 97.54% for SPYV. In other words, RPV’s holdings have not benefited from their stronger sales growth, suggesting the potential for a big value opportunity. In addition, analysts expect this growth to continue for the next year but have loftier expectations for SPYV. Given how RPV had a much better recent quarter as measured by the revenue surprise figures (5.33% vs. 2.95%), I think it’s wise to stick with stocks with modest expectations that are over-delivering.
2. RPV’s forward EPS growth rate of 14.77% is only slightly below the 16.10% for SPYV. It’s one figure that likely surprises pure value investors. Still, it’s crucial because part of the consideration should be figuring out the likely performance should your market outlook turn out wrong. In RPV’s case, you need to consider the possibility that growth will outpace value again despite the predictions of ETF providers like Vanguard. This growth suggests it will still perform well in such a scenario, so it looks well-covered on both the value and growth sides despite the ETF’s name.
3. Finally, RPV’s price discount on forward earnings relative to SPYV (13.32x vs. 20.93x) is enormous, and only 6% of the 800+ U.S. Equity ETFs I track have a lower valuation. However, they lean toward the riskier side in terms of their five-year betas for the most part. One exception is the Invesco S&P 500 Enhanced Value ETF (SPVU), so if you like what RPV offers, consider doing some due diligence on that ETF.
Investment Recommendation
RPV is an efficient way to allocate capital to stocks with only the strongest value characteristics, which generally means those with the lowest valuations. Market participants have favored this feature in 2022, and I think it will continue. However, RPV is unique because it contains not only low P/E stocks but has a 14.77% EPS growth rate to back it up. No one can guarantee the 2022 trend will continue, so I consider it an excellent hedge. However, potential issues arise for long-term holders, including:
- a high 0.35% expense ratio, which will erase 5.95% of your gains over ten years, assuming an 8% return
- a high concentration, which won’t always be favorable each year as the Index reconstitutes
- the potential for sales and EPS growth rates to decline, causing significant underperformance in risk-on environments.
Still, the benefits outweigh these risks, especially in the short term. I’m rating RPV as a buy and plan to monitor the fund through the year as market conditions further evolve.
Be the first to comment