

sefa ozel
Company Information
Cummins
(CMI) is a specialized construction machinery and heavy trucks company founded in 1919 headquartered in Columbus, Indiana. Most recently in April 2022 it acquired Jacobs Vehicle Systems, a quality braking system company founded in 1961 with 60+ years of experience which should bring growth opportunities to Cummins.
3M
(MMM) is a diversified industrial conglomerate that was founded in 1902 and headquartered in St Paul, Minnesota. I operates in 4 segments:
-safety and industrial
-transportation and electronics
-healthcare
-consumer products
It just completed a Dec 2021 merger with Neogen as a food safety unit that is tax efficient to shareholders. Here is a bit of information on that merger here, which was a tax free reverse Morris trust action which at this time is not a problem. However, legal battles over PFAS chemical spilling and ear plugs provided to the military that may have caused deafness to continue to plague 3M. The legal suits still continue and with it splitting in 2 in the future with a spin out its healthcare unit weigh heavily on this blue chip company.
Deere & Co.
(DE) is a farm and heavy construction machinery company founded 1837 in Moline Illinois. John Deere, the man and founder, was a blacksmith and invented the first steel plow and the rest is history.
Everyone most likely knows the name along with the green and yellow colors for its very popular products, lawn equipment, tractors and more.
Dividend, Yield and Growth Rates
The chart below uses the following abbreviations:
2022/3 Div$ = Known yearly dividend in US dollars $.
Pr/Sh = Price per share
Div yrs = Number of years paying a rising dividend
2022 D Yld = Dividend yield using known yearly dividend and price shown
5yr D GR = 5 year dividend growth rate
C# = Chowder # obtained from adding dividend yield and 5yr DGR
2yr DGR = most recent 2 years of dividend growth
|
2022/3 |
Stock |
Company |
Dec 10th |
div |
2022 |
5yr |
C# |
2yr |
|
DIV $ |
Ticker |
Name |
Pr/Sh |
yrs |
D Yld |
D GR |
DGR |
|
|
6.28 |
(CMI) |
Cummins |
238.14 |
17 |
2.6% |
7 |
9.6 |
7.1 |
|
5.92 |
(MMM) |
3M |
125.76 |
64 |
4.7% |
6 |
10.7 |
0.7 |
|
4.8 |
(DE) |
Deere |
434.81 |
2 |
1.1% |
13 |
14.1 |
19.8 |
A recent article, I wrote about the C#, here, explains the criteria and yield desired to pass a screen for “buying” a stock.
-Cummins
Dividends are rising nicely and the 5yr DGR is 7% and the 2 year is just a bit more at 7.1%. With a yield of 2.6% it offers a C# of 9.6, which is acceptable to hold it. FAST graphs shows dividend Payout % = 38.2%.
-3M
There are 65 companies on the dividend Aristocrat list here, with 3M having 64 years with that designation. It also maintains a spot on the Dividend Champion list for the same reason. However, it is the weakest dividend payer in the chart above for 5 years and most assuredly for the last 2 years sitting at 0.7%. It raised the dividend 4c each of the last 2 years to achieve that.
The dividend yield is amazing at 4.7%, but sadly the reason is a falling price and headwinds in the business as previously mentioned. FAST graphs Dividend Payout % = 58.5%.
-Deere and Co.
In 2015 Deere froze the dividend for ~2 years and then raised it in 2018 and 2019 and then held it the same until 2021 where it got raised twice that year. This is very erratic, annoying for anyone that relies on dividend payments. However, on average it offers large raises when they happen and the 5yr DGR is 13 with the last 2 years being even more. The low yield of 1.1% is more tolerable with those nice raises. It just announced another raise to $1.20 for the next 2023 February payment. FAST graphs shows an excellent dividend Payout% = 18.7%.
Price Estimates
The chart that follows are from 4 analysts and use the following abbreviations:
M* = Morningstar Analyst premium from library source
VL = Value Line safety score ( 1 is the best and 5 the worst)
VL Mid Pt = 18 month out mid range price target / mid 2024.
YF PT = Yahoo Finance Price Target out usually 12 months.
SPGMI CFRA = TD Ameritrade broker analysis and price suggestion.
|
Stock |
Dec 10th |
M* |
M* |
M* |
VL |
VL |
YF |
SPGMI |
|
Ticker |
Pr/Sh |
FV |
Buy |
Sell |
Mid Pt |
PT |
CFRA |
|
|
CMI |
238.14 |
241 |
168.7 |
325.35 |
2 |
268 |
254.6 |
271 |
|
MMM |
125.76 |
183 |
109.8 |
283.65 |
1 |
150 |
128.71 |
122 |
|
DE |
434.81 |
354 |
247.8 |
477.9 |
2 |
493 |
453.13 |
460 |
Above chart price analysis:
-Cummins is sitting at fair value by M* and perhaps a bit under if you use the other analyst projections.
-3M is struggling and all analysts show it should be at the current price for some time even though fair value might be a bit higher.
-Deere is not a buy for value, and close to a sell price. The lovely and recent dividend raises do cast some nice allure for owning it.
FAST Graphs
“FG” is a paid subscriber service that I belong to from Chuck Carnevale, a long time writer and contributor on SA. It shows in one picture graph statistics and numbers that help visualize price, dividend attractiveness and much more.
The following colors/ lines on the chart represent the following”
Black line = price
White line = dividend
Orange = Graham average of usually 15 P/E “price/earnings” for most stocks.
Blue = Normal P/E
Dashed or dotted lines are estimates only.
Green Area represents earnings.
Statistics by year are noted for high and low prices at the top of each chart and for earnings and dividends at the bottom of it. The % shown is for the change from year to year for earnings.
I am showing a 7 year chart for each company representing the last 5 actual known years and 2 years of estimates (dotted lines).
Cummins
“FG” confirms the price is sitting on the orange fair value line. The facts on the right side of the graph show the blended P/E at the price shown is 14.6 and the normal blue line P/E is 14.46. Again very close to fair value.
Cummins FASTgraph Dec 14th (FASTGraphs Chuck Carnevale)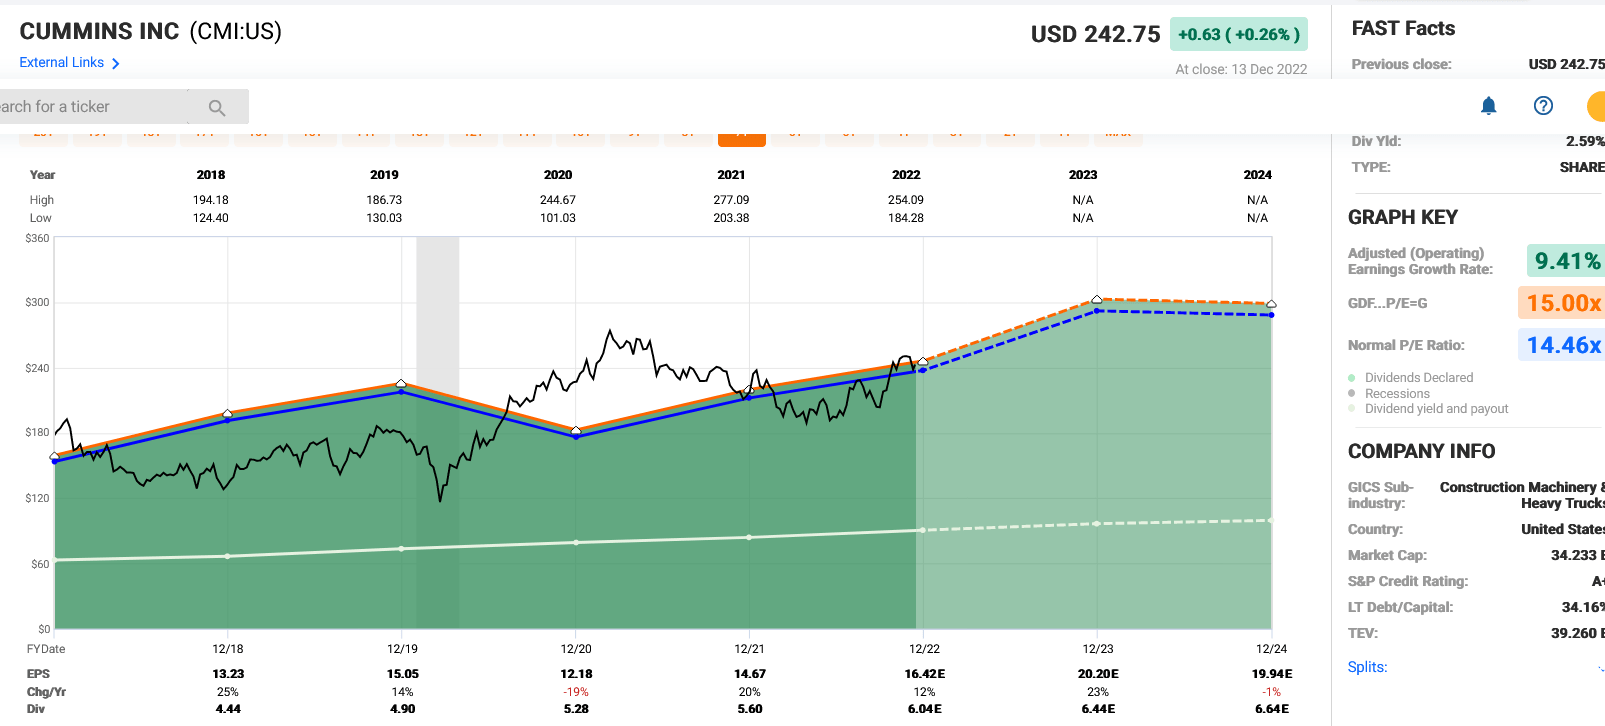
The estimates also show some nice earnings growth for 2023.
3M
The Graham normal orange line in this chart shows a P/E of 13.82x and the blended P/E is 12.36.
3M normal P/E, the blue line, is much higher and it is undervalued now in that regard. However, the key here is to look at earnings for 2022 and the future.
3M FASTGraphs Dec 14th 2022 (FASTGraphs Chuck Carnevale)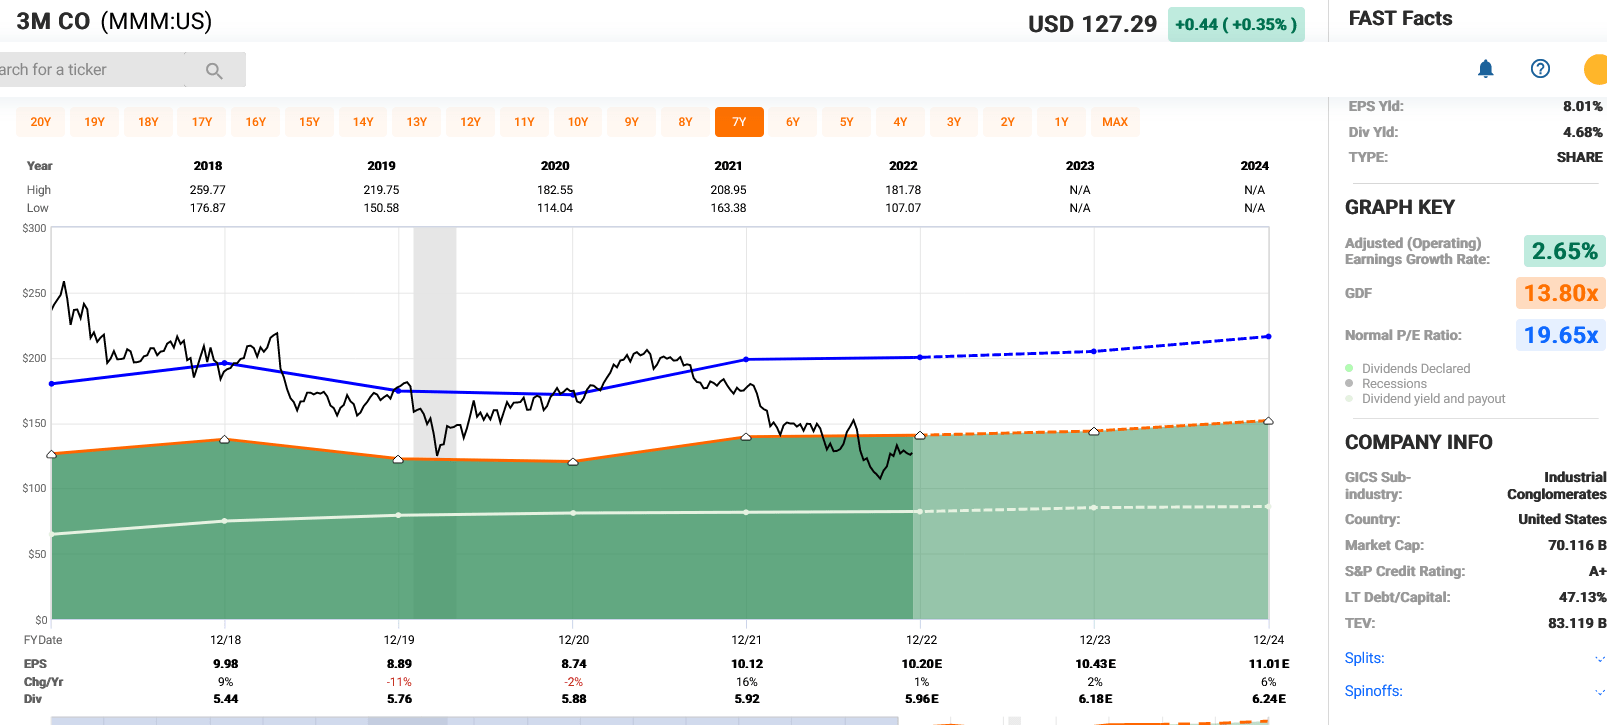
It is evident that the -11% in earnings took the stock down in 2019. The 16% rise in 2021 was helpful to counter it, but tail winds are bringing it down again to the low of the current cycle. The 1% earnings for 2022, 3% for 2023 and 5% for 2024 will probably not propel the price upwards for some time without a nice tailwind from somewhere. It, from what I have mentioned above, has a lot of headwinds with the lawsuits.
Deere
Deere FASTgraph dec 14th (FASTGraphs Chuck Carnevale )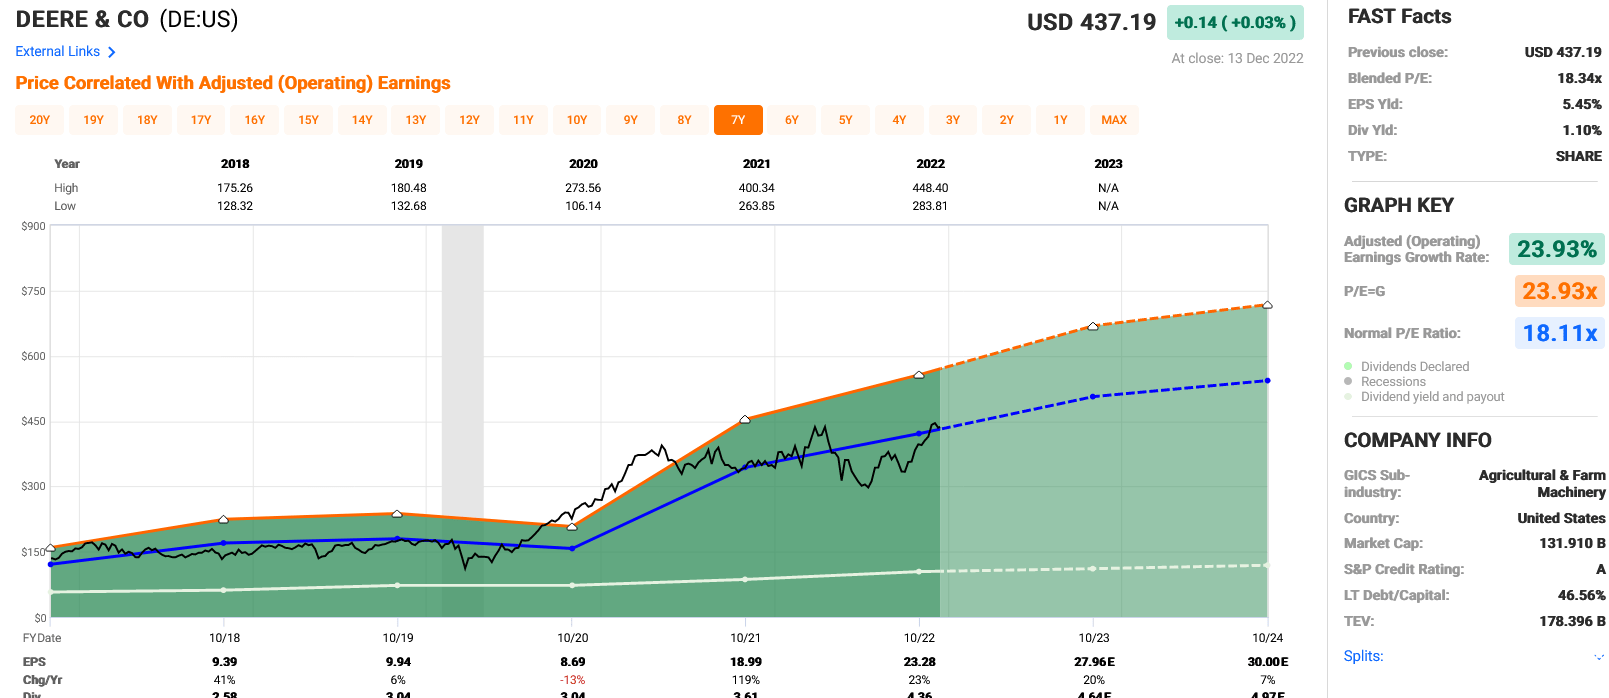
The chart shows it trading at or near its normal P/E of 18.11 and close to the blended current P/E of 18.28. It does seem to follow the normal P/E unless it has huge earnings growth like the 119% in 2021. The chart is upward and still attractive.
Summary Conclusion
Industrials are notorious for being cyclical for price and earnings.
3M is definitely on the down end of the down cycle and I believe it will probably go sideways for some years. No hurry to own it again.
Cummins is in the middle of a cycle and doing great with rising earnings estimates. It’s a long hold for me.
Deere has rising earnings and the price is hitting highs. I watch and hope for another nice dip to perhaps own it.
RIG is moving up nicely too and the following chart shows its performance along with FMP “Funds Macro Portfolio” at Macro Trading Factory.
Performance comparison RIG vs FMP (Macro Teller at The Macro Trading Factory service SA)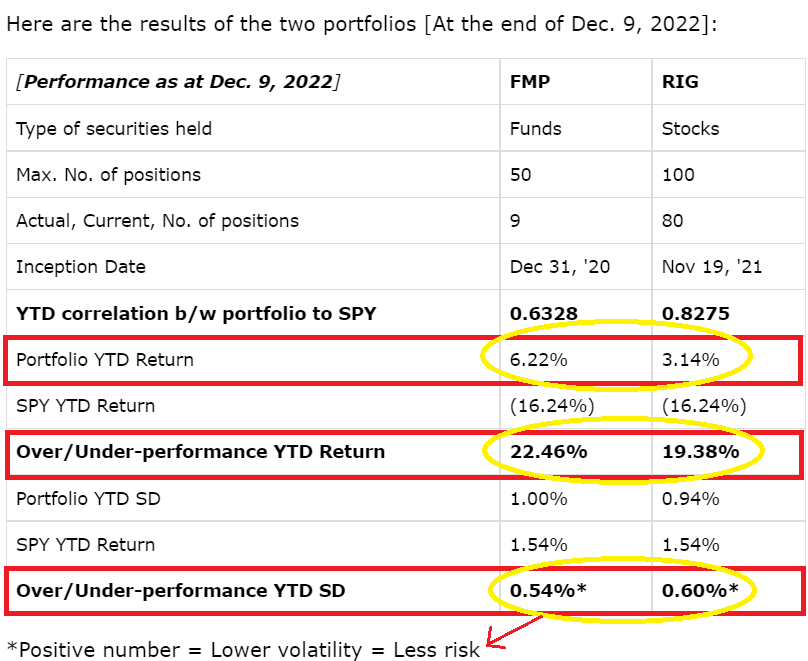
Happy Investing to All!
Be the first to comment