

johan63/iStock via Getty Images
By Rob Isbitts
Are we making investing too complicated?
I’ve written 3 books, hundreds (maybe a thousand) articles, been a guest on countless podcasts and logged over 100,000, all about a single, broad topic: how to put oneself in the best possible position to be a successful investor. And, while success is defined by each investor individually, and I am out of the business of providing personalized advice (after 27 years in that role), the mission is still the same: find better, more accurate and reliable ways to do two things:
1. Avoid big loss (again, every investor ultimately defines this on their own)
2. Make as much as possible
3. Thing #1 above is always more important than thing #2
This career-long journey has given me the privilege of consuming endless volumes of market analysis. From reports on the macro environment, to analysis of market history, current trends, economic forecasts, Fed-watching, fundamental stock analysis, quantitative analysis, and my 1st and favorite love, technical analysis (as noted here before, my late father taught me to chart at age 16…4 decades later, here I am).
All of that time, all of that effort, thousands of hours of conversations with other investors, from professional to newbies, and what have I learned? Not everything, but enough to draw some heavy, deep-rooted conclusions and convictions about what makes for successful investing.
And all I keep coming back to is this: maybe, just maybe, we are making all of this too complicated. Because with every year that passes, one investment trend gets more and more of my attention. What is it? Simplicity!
Simplicity prevents ignorance…and big mistakes
Dad was an engineer. I am an engineer too, but not the type with a formal engineering degree. I am a self-appointed “portfolio engineer.” Piecing together a portfolio of ETFs, for example, so that they work in sync like a successful unit in a team sport…that’s my passion.
And for many investors I have encountered here on Seeking Alpha the past few months, the greatest pleasure is this: there are a lot of other portfolio engineers here! That is wonderful to realize. And, while most every investor I meet has their own take on what works, why it works, how it works, when it works, and why their way is best, the beauty is that we can all rally around one thing: we want to make money and not lose big along the way.
And, while some investors look at losses of 25-50% or more and say, “it is OK because it always comes back, and I’ll by more since the market is on sale,” that’s not my belief system. The fact that my father grew up as a poor kid in New York City during the Great Depression, and I was a middle-class fellow myself, is probably where the “risk-management” process I built comes from.
Bottom-line: simplicity is great, but assuming that “it always comes back” might be somewhere between arrogant and ignorant. Even if “it does come back” next time, the fact remains: you took a heck of a lot of risk!
Some will play that game as either a true belief system or simply to sound brave and confident on social media. Me? I’ll stay closer to the exit door at all times, so as not to drink too much from the proverbial punch bowl.
Today’s market: the golden era for being “tactical”
There was a time when I was a “strategic asset allocator,” and holding investments for years at a time was par for the course. In my opinion, while that is still a primary goal, investors who are realistic in this historic set of market circumstances are bound to be the big winners over the next several years. Because, as was the case earlier this century, there is strong potential for a “lost decade” in the stock market. In other words, 10 years of net zero returns. Net zero is a great for carbon emissions. But in stock market investing, it is a retirement game-changer. I fear that a decent segment of today’s retired and near-retired population is still playing by the rules of the past decade. The game has changed. Boy, has it changed!
That means that while investors can choose to trust the traditional “buy and hold” thing, and count on the S&P 500 Index or a 60/40 mix of stocks plus regular rebalancing to get them to and through their own retirement vision, there is one thing standing in their way: a level of risk in that decision that we have not truly had to deal with for a long time.
ROAR: a different, simple way to confront this investment era head-on
Meet the ROAR Score (ModernIncomeInvestor.com (Sungarden Investment Publishing))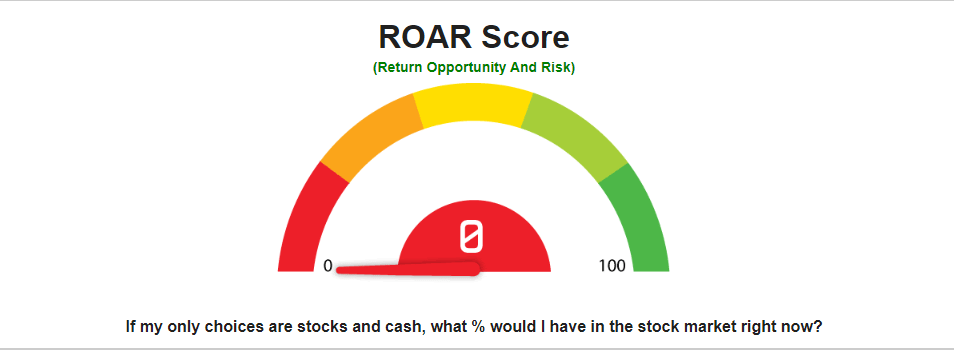
I created the ROAR Score after I sold my investment advisory practice in 2020, and retired…for about 3 minutes! Pivoting to investment research and publishing, and with investing my own money suddenly much more important, I did not abandon all of that “peripheral insight” that I listed above. In fact, I probably do more of it than in the past. The ROAR Score is a new name for what has been an evolution of the same analytical process since the 1990s.
But there is a huge difference. The bottom-line of all that work is to determine, when all is said and done, one thing:
How much offense should I be playing right now, and how much defense?
So, the ROAR Score is my bottom-line “NOW” indicator of the market’s reward/risk tradeoff. And using it can be as simple or complex as one wishes. For instance, I run one of my own accounts as a pure ROAR account: I allocate between one equity ETF and one cash-like ETF. That’s it.
There is another version (and account) which has a mix of 4 ETFs. At least one offense and one defense, and the other two are “wildcard positions,” to add flexibility.
And, there are more detailed versions of ROAR model portfolios, using 7 ETFs, or more. The number of ETFs and portfolio slots is not the key. What is critical is to properly balance offense and defense.
In a simple ROAR portfolio, that is a broad market equity ETF and a short-term bond ETF. The more positions I add, the more options I have to drill down and exploit that base view of the balance between offense and defense.
With that research-driven step completed, the portfolio decisions (what to buy and sell, and when) are then based on the ROAR method (in my case) and/or whatever additional decision mechanisms you use to choose from among the infinite number of investment allocation systems we have all read about. ROAR is a concept to boil the “point of attack” decision system down for the investor.
The details of which securities to consider, what each portfolio slot or “sleeve” will hold, and under what conditions, is ultimately up to the user/investor. This part is similar to what sports teams do when determining which of the players on their roster should be playing, and when. That’s why I named that part of the process a “Depth Chart.”
Sample Depth Charts
Here is what is looks like in concept. Pictured below are 3 different matrixes. Each represents a different universe of ETFs that an investor chooses to define their “investable universe” or watchlist of ETFs to consider.
3 different levels of depth charts (ModernIncomeInvestor.com (Sungarden Investment Publishing))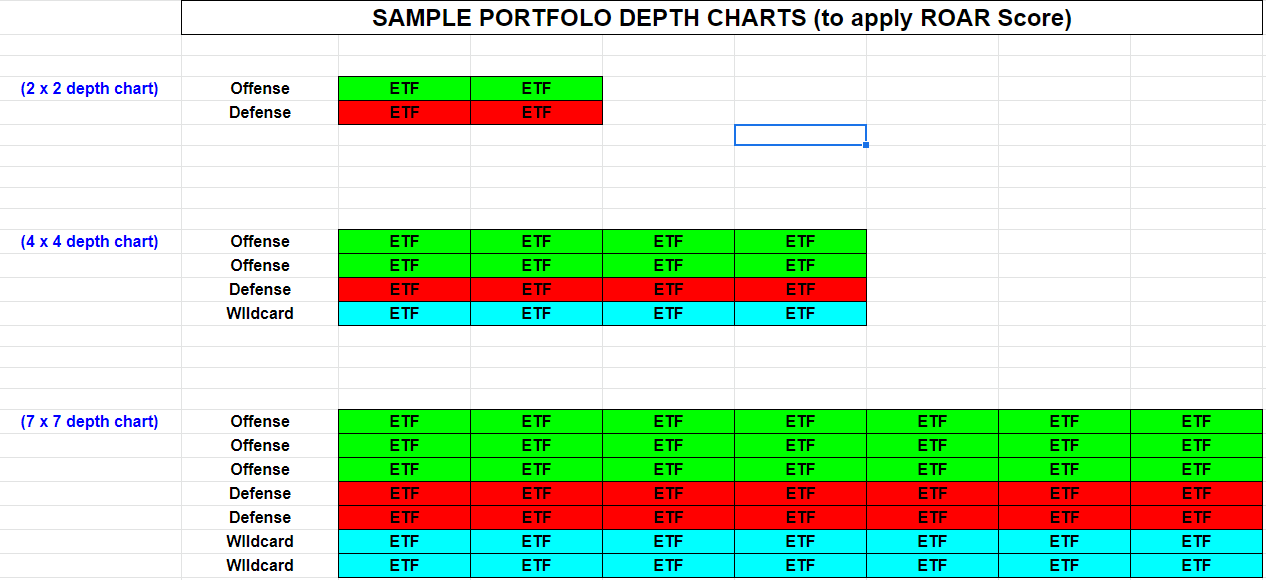
How ROAR performed in 2022: Not Bad
Here is the portfolio I tracked all year, using one of my own retirement accounts. The purple line is the portfolio performance, and the blue line is the most well-known US Bond Index.
ROAR 2×2 model during 2022 (Sungarden Investment Publishing)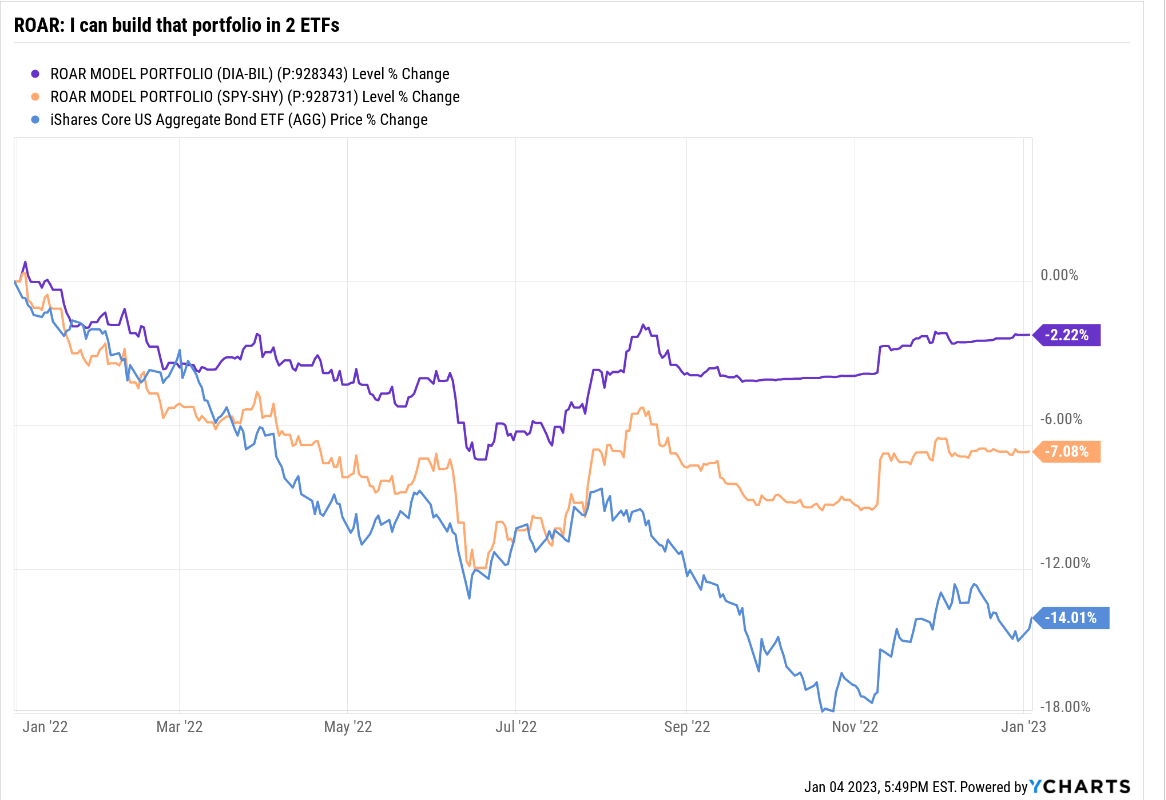
There should be 2 obvious questions about that chart above. First, what’s that orange line? This is an extra piece of insight I decided to squeeze into this discussion of ROAR, because it shows that ROAR is a great starting point, but that security selection with the offense and defense portions of the portfolio can still be significant sources of Alpha.
Both the purple line and orange line applied the ROAR Score throughout 2022. The difference is that the purple line used SPDR® Dow Jones Industrial Avrg ETF Tr (DIA) to play offense, and SPDR® Blmbg 1-3 Mth T-Bill ETF (BIL). At the start of the year, I included in my 4-ETF depth chart those 2 ETFs, as well as a backup for each of the offense and defense segments.
SPDR® S&P 500 ETF Trust (SPY) was the alternate offense ETF. For the alternate defense ETF, I was willing to use iShares 1-3 Year Treasury Bond ETF (SHY). Now, the strange thing about 2022, among many, was that the Dow outperformed the S&P 500 by a wider than usual margin. And, T-Bills retained their value all year, while the bond market was such a mess that even SHY, with its 1-3 Year US Treasury holdings, lost money.
So, the orange line was my “what if” analysis if I had decided during the year to move off of the DIA/BIL combination when applying and adjusting the ROAR Score throughout the year. Simply using another broad market ETF (SPY) and another “cash-alternative” ETF (SHY) would have cost me nearly 5% in total return! So, score one for the benefits of going beyond “mindless” asset allocation schemes, and drilling down to the security level, even in a simple, tactical 2-ETF model portfolio like this one.
The other question one might ask when looking at that performance chart is why I included the iShares Core US Aggregate Bond ETF (AGG). That’s just a reflection of my personal belief that investors should be looking for ways to generate Alpha and consistent returns without an over-reliance on bonds. I’ve written about my reasons for that in numerous articles, and in the comments sections of many of those articles in response to investor questions.
What does ROAR say now?
I showed you the application of ROAR above. In other words, whatever the ROAR Score was at any point during the year (I update it weekly), that was the amount invested in DIA. The rest of the model portfolio was invested in BIL. As noted above, I always gave myself the option of using SPY instead of DIA or SHY instead of BIL. But my supplemental analysis all year concluded that there was never a compelling reason to do that.
As we start 2023, not much has changed. DIA and BIL are still the “tools of choice” in this simplest of ROAR models (2 securities, 1 offense and 1 defense). And, the ROAR Score started 2023 right where it ended 2022. At 10%. That is, the current allocation is 10% DIA and 90% BIL.
In interest of full disclosure on this model and its 2022 path, here are the weekly ROAR Scores for all of last year, and the first score for 2023. This is exactly how we track it in-house, with the color coding. As you can see, ROAR started the year at 65, which would be its highest point of the year. It only approached that level twice more during the year, briefly in late March and again in late July. Since August 24, the ROAR Score has been in the “red zone.” That is, it has been between 20 and 0, such that DIA was no more than 20% during the last 4 months of 2022, and BIL was no less than 80% of the model portfolio during that time. For what it is worth, the S&P 500 closed on August 24 at 4,141, and closed the year more than 7% lower than that.
ROAR during 2022 and the start of 2023 (ModernIncomeInvestor.com (Sungarden Investment Publishing))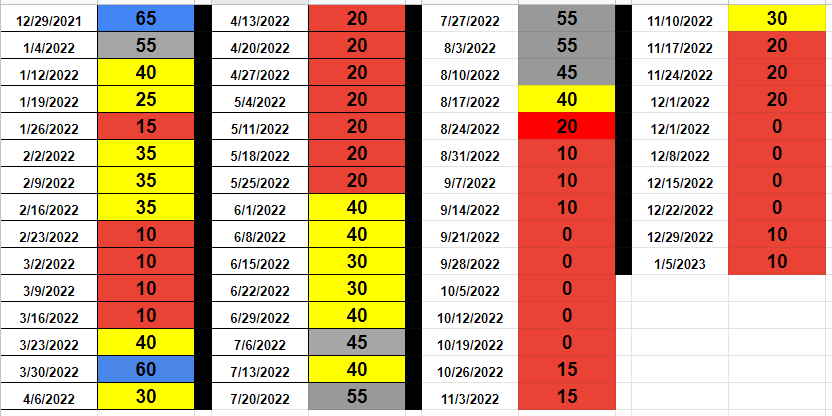
Still, while ROAR could easily be dismissed as just another “market timing” system, that’s not at all how I view it, or why I created it. It is an ongoing weighing of the evidence. Frankly, I never expected ROAR to spend a total of 9 weeks during the year at zero. In other words, 100% in BIL. But, the rules are the rules. And even if the market has screamed higher during that time, it would still be OK to me. Because again, the purpose of ROAR is to balance reward and risk of major loss.
ROAR = Reward Opportunity And Risk
Where simple meets sophisticated
Investing is not simple. But there are parts of that I think can be simplified. So, in 2023 and beyond, think about your own total investment process, strategy and goals, and try to figure out where to simplify, and where to “get your hands dirty” doing research and allocating assets. I know that the ROAR approach made my 2022 a lot less stressful than it could have been.
From here forward, I aim for it to guide me, and those who follow my ongoing research, in pursuit an investment experience that is low on drama and high on risk-management. The goal, as always: to achieve competitive, consistent results from year to year. It took me about 30 years of experience and process evolution to finally arrive at something I think is quite air-tight. The future will be the judge.
Be the first to comment