


See how the dividends are set to rise? We like dividend growth. That’s how you go from seeking alpha to finding alpha.
simonkr
Get ready for charts, images, and tables because they are better than words. The ratings and outlooks we highlight here come after Scott Kennedy’s weekly updates in the REIT Forum. Your continued feedback is greatly appreciated, so please leave a comment with suggestions.
New Residential (NRZ) is now trading under a new name and ticker: Rithm Capital (RITM).
I’ll update in our sheets when Google recognizes the new symbol. For the moment, I’m still showing them as NRZ until all formulas can work correctly with RITM. When that happens, I’ll update references for all future articles (but not retroactively). In this article, I’ll regularly use the old ticker.
We own shares of NRZ / RITM and shares of NRZ-D / RITM-D. Our positions in each share are greater than 5% of the total portfolio. That’s greater than 10% combined. I believe we’ve got the analysis right and I put my money where my mouth is.
Why are we talking about NRZ? It’s not just to make fun of the new name.
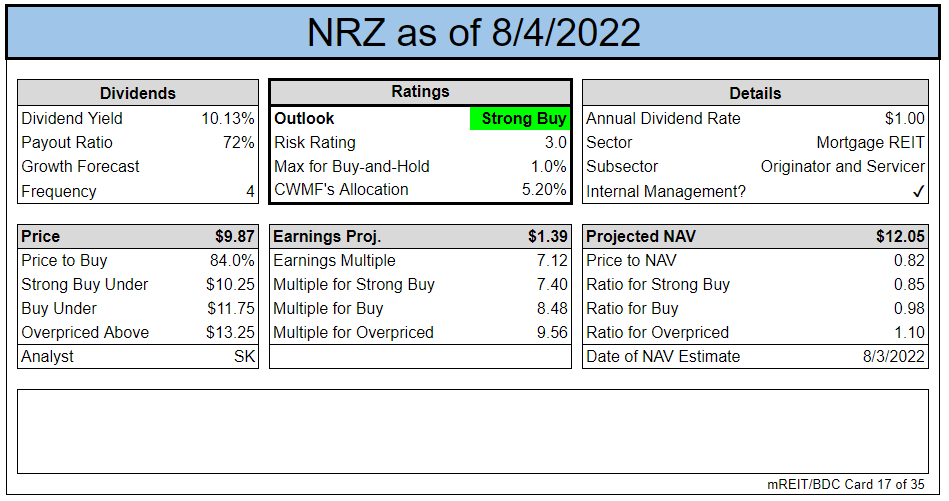
NRZ’s Q2 2022 book value came in at $12.28. That’s down 2.2% from Q1 2022. It was a slightly larger decrease than The REIT Forum’s projection of $12.50, but that’s still close. Remember that many mortgage REITs are reporting huge swings in book value. Being within 2% this quarter is great.
However, NRZ’s dip in book value per share was better than dips by most mortgage REITs. Remember that NRZ internalized management. As part of his update on earnings for NRZ/RITM, Scott Kennedy wrote:
So, while I correctly projected NRZ/RITM would very likely report one of the least severe BV decreases out of the 20 mREIT sector peers that I/we cover, the company slightly underperformed my expectations regarding this specific metric during the second quarter of 2022.
I would also point out this quarterly BV decrease includes NRZ’s/RITM’s recent termination fee of ($400) million paid to the company’s former external manager, Fortress Investment Group. Net of taxes, this negatively impacted BV by approximately ($0.70) per common share during the second quarter of 2022. When excluding this termination fee, NRZ/RITM would have reported a 3.3% increase in quarterly BV to approximately $12.98 per common share. When taking this into consideration, a pretty good quarter regarding NRZ’s/RITM’s BV fluctuation considering the modest-notable spread widening that continued to occur within agency MBS (which NRZ/RITM owns; contra-hedges) non-agency MBS, and residential whole loans.
Going over each income statement account/sub-portfolio, the majority of NRZ’s/RITM’s BV underperformance was spread amongst the gain-on-sale margins within the company’s originations sub-portfolio, valuation fluctuations within the company’s mortgage servicing rights (“MSR”) sub-portfolio, and valuation fluctuations within its agency MBS/non-agency MBS/residential whole loans sub-portfolios. Along with reconciling NRZ’s/RITM’s quarterly BV variance, let us discuss some metrics within some of these underlying sub-portfolios.
The full update is a couple of pages, but I wanted to share a few paragraphs here.
There were good reasons for internalizing management:
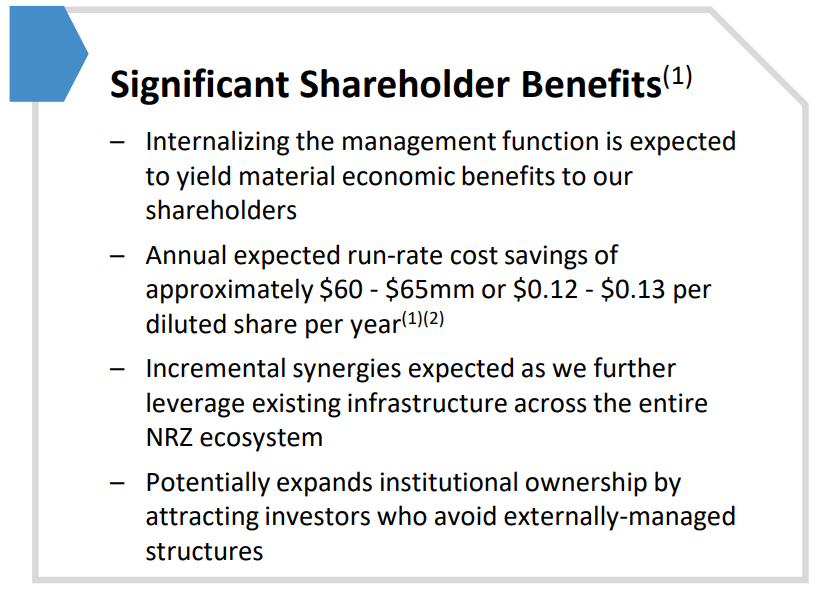
NRZ
Those are legitimate benefits. The savings represents about a 15% yield on the cost, which is a significant savings. Meanwhile, increasing institutional ownership could push the share price higher. Since this was reflected as an expense (rather than a buyout), the book value won’t be inflated. Investors should expect NRZ to carry one of the higher price-to-book ratios in the sector. Currently, they don’t. NRZ trades at one of the lower price-to-book ratios in the mortgage REIT sector today.
Shares rallied up to $11.00 on August 1st, 2022. That was just before the name change and the Q2 2022 earnings release. They dipped since then and are down to $9.87 as of today. Are investors that disappointed with the results? They were only slightly below our expectations. Book value came in about 1.75% below our projection. That could justify a dip of 1.75% quite easily, but not 10%. Maybe it’s just that the sector is dipping? MORT (a sector ETF) is down 3.39% from 7/31/2022. That’s just not as big as the dip in NRZ though.
How is NRZ protecting their book value so well while rates soar? The value of the MSRs (mortgage servicing rights) increased significantly:
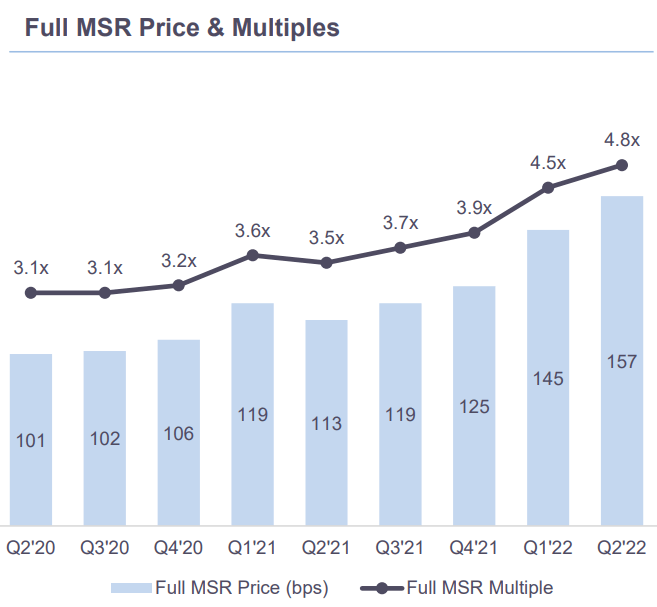
NRZ
They can value the MSR using the price relative to the outstanding balance of the loan (light blue bars) or as a multiple of the cash flow the MSR produces (dark blue line).
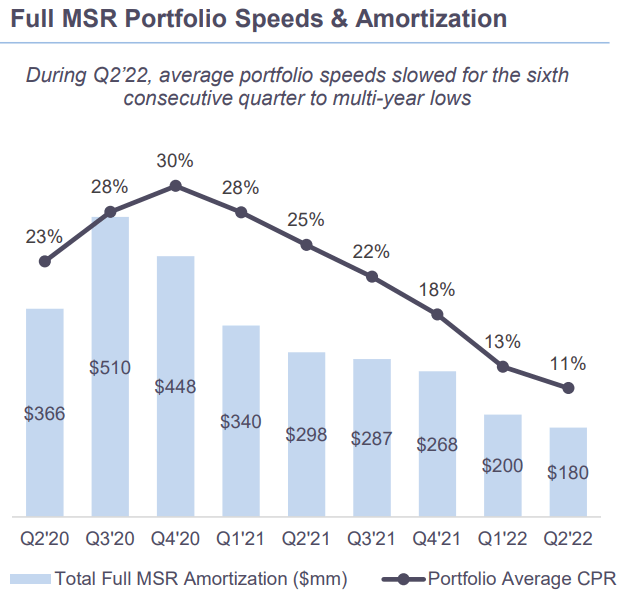
I like thinking about it in terms of the multiple. That gives us an idea for how many years the loan would stay outstanding to recover the value of the MSR. Since interest rates are higher, prepayments are down. Refinancing your home at this point isn’t a good idea. However, some people will still be moving. If they sell the old property, they have to close out the mortgage. Unless they have a big cash position, they will also need to take out a new mortgage. Consequently, prepayments can’t go to 0. However, they are down dramatically:
NRZ
When prepayments are running around 11%, it justifies a pretty high multiple for MSRs.
Are all MSRs created equal? No. You’d be willing to pay a higher multiple for an MSR tied to a mortgage with a 3% interest rate than one with a 6% interest rate. Why? Because the borrower with a 3% interest rate is unlikely to get an attractive opportunity to refinance in the next several years. However, it’s entirely possible that a borrower at 6% may get an opportunity to refinance at a better rate.
With NRZ trading down to $9.87, it’s offering investors an attractive risk/reward profile. We see NRZ covering their dividends much better than many peers. The REIT Forum estimated range for NRZ’s dividend in Q3 2022 is $.25 to $.30. The current quarterly rate is $25. So our estimate suggests the dividend would either be flat or be increased by as much as 20%. We give that estimated range a 90% probability, which is at the high end of our probabilities. What’s better than a 10% dividend yield? A 10% yield that is more likely to be increased than cut.
While NRZ carries a 10% dividend yield (well, 10.1%), it’s only paying out 8.3% on our estimated book value (estimate as of 7/29/2022). That’s pretty low. It isn’t the lowest in the sector, but it is clearly on the lower end of the scale. Remember that book value is what management is using to invest and generate the cash flow necessary to service that dividend. That makes the yield on book value a useful metric for a reality check. If you see that value at 15% or higher, you’re probably looking at a sucker yield.
Why Is NRZ Down So Much?
You want a thesis for why NRZ is down so much? It could be the new ticker causing some investors to sell. However, I’ve got a theory I like even better. If the share price was $.70 higher, it would’ve been much closer to the sector performance. The entire cost of internalizing management was expensed. Investors who forgot about this cost flowing through the statement could be surprised. Alternatively, they could even be looking at GAAP earnings. Since the cost was expensed, it tanked GAAP earnings:

NRZ
Investors who aren’t paying close attention to the stock could be thrown off. With shares suddenly dipping, that price is looking attractive.
NRZ has one of the larger discounts in the sector, but they’ve joined the ranks of the internally managed mortgage REITs. That should demand a premium valuation, especially given NRZ’s relatively strong history.
The REIT Forum
The rest of the charts in this article may be self-explanatory to some investors. However, if you’d like to know more about them, you’re encouraged to see our notes for the series.
Stock Table
We will close out the rest of the article with the tables and charts we provide for readers to help them track the sector for both common shares and preferred shares.
We’re including a quick table for the common shares that will be shown in our tables:
Let the images begin!
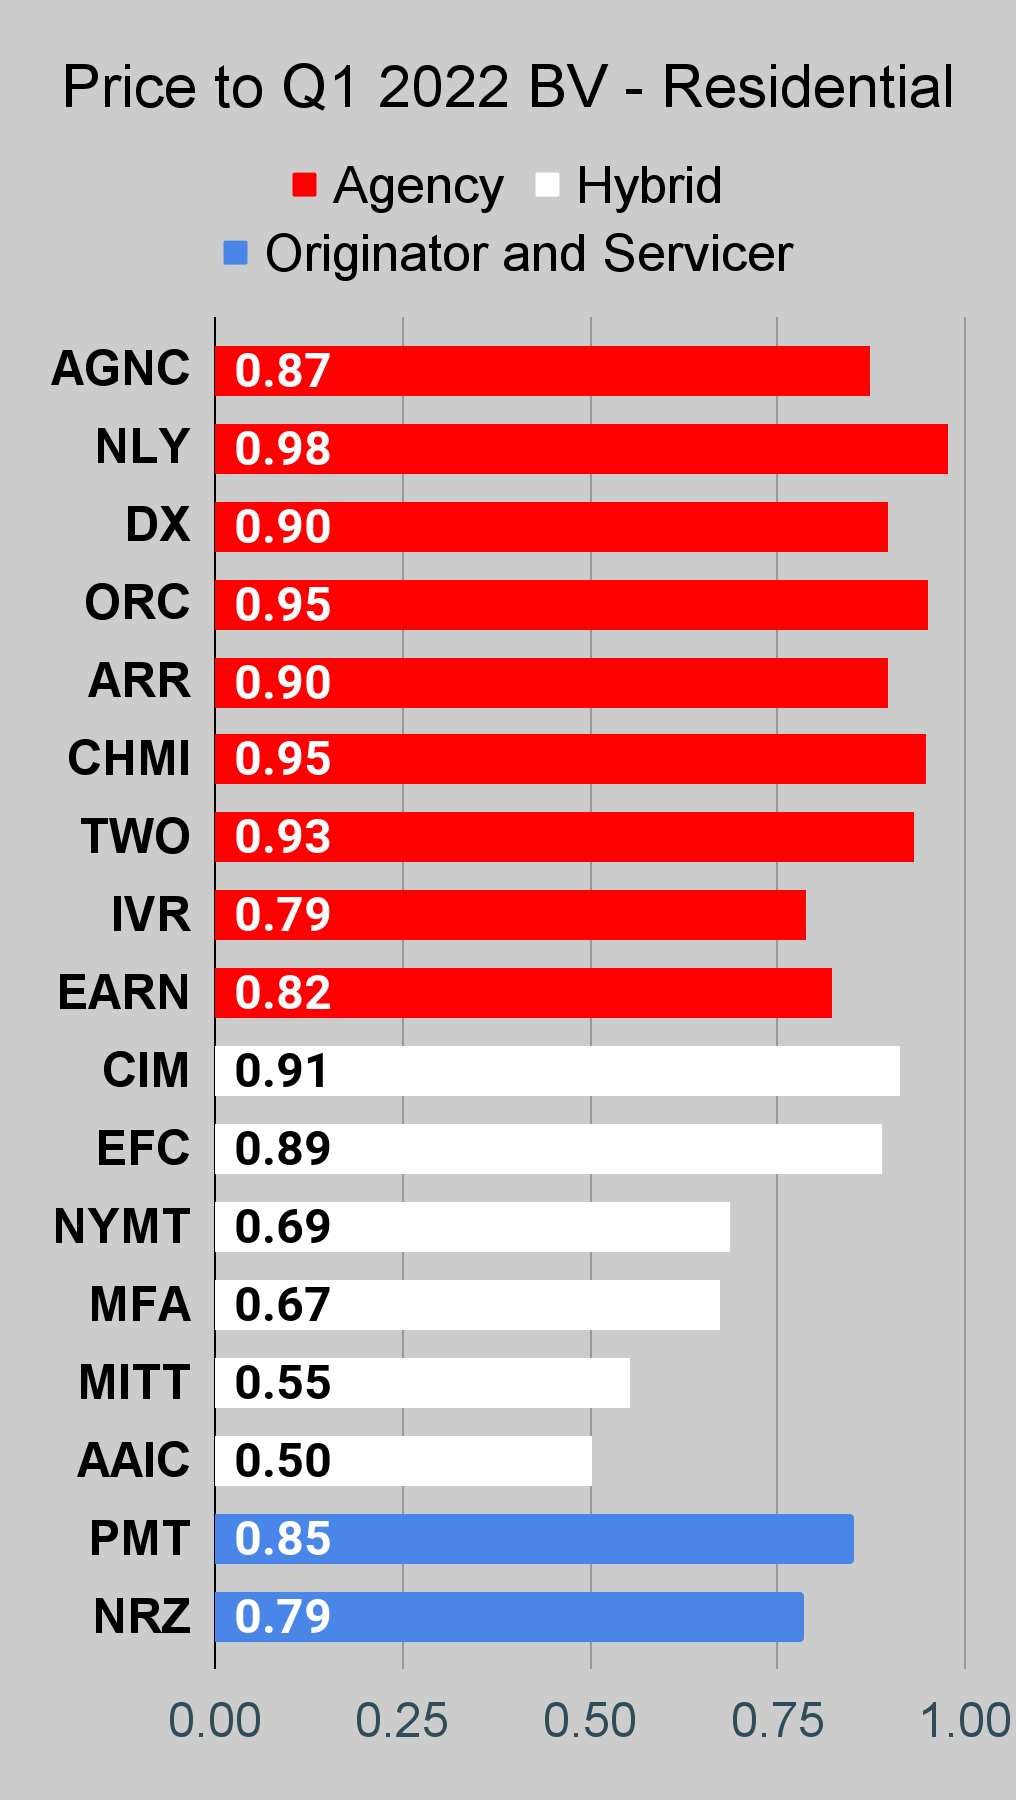
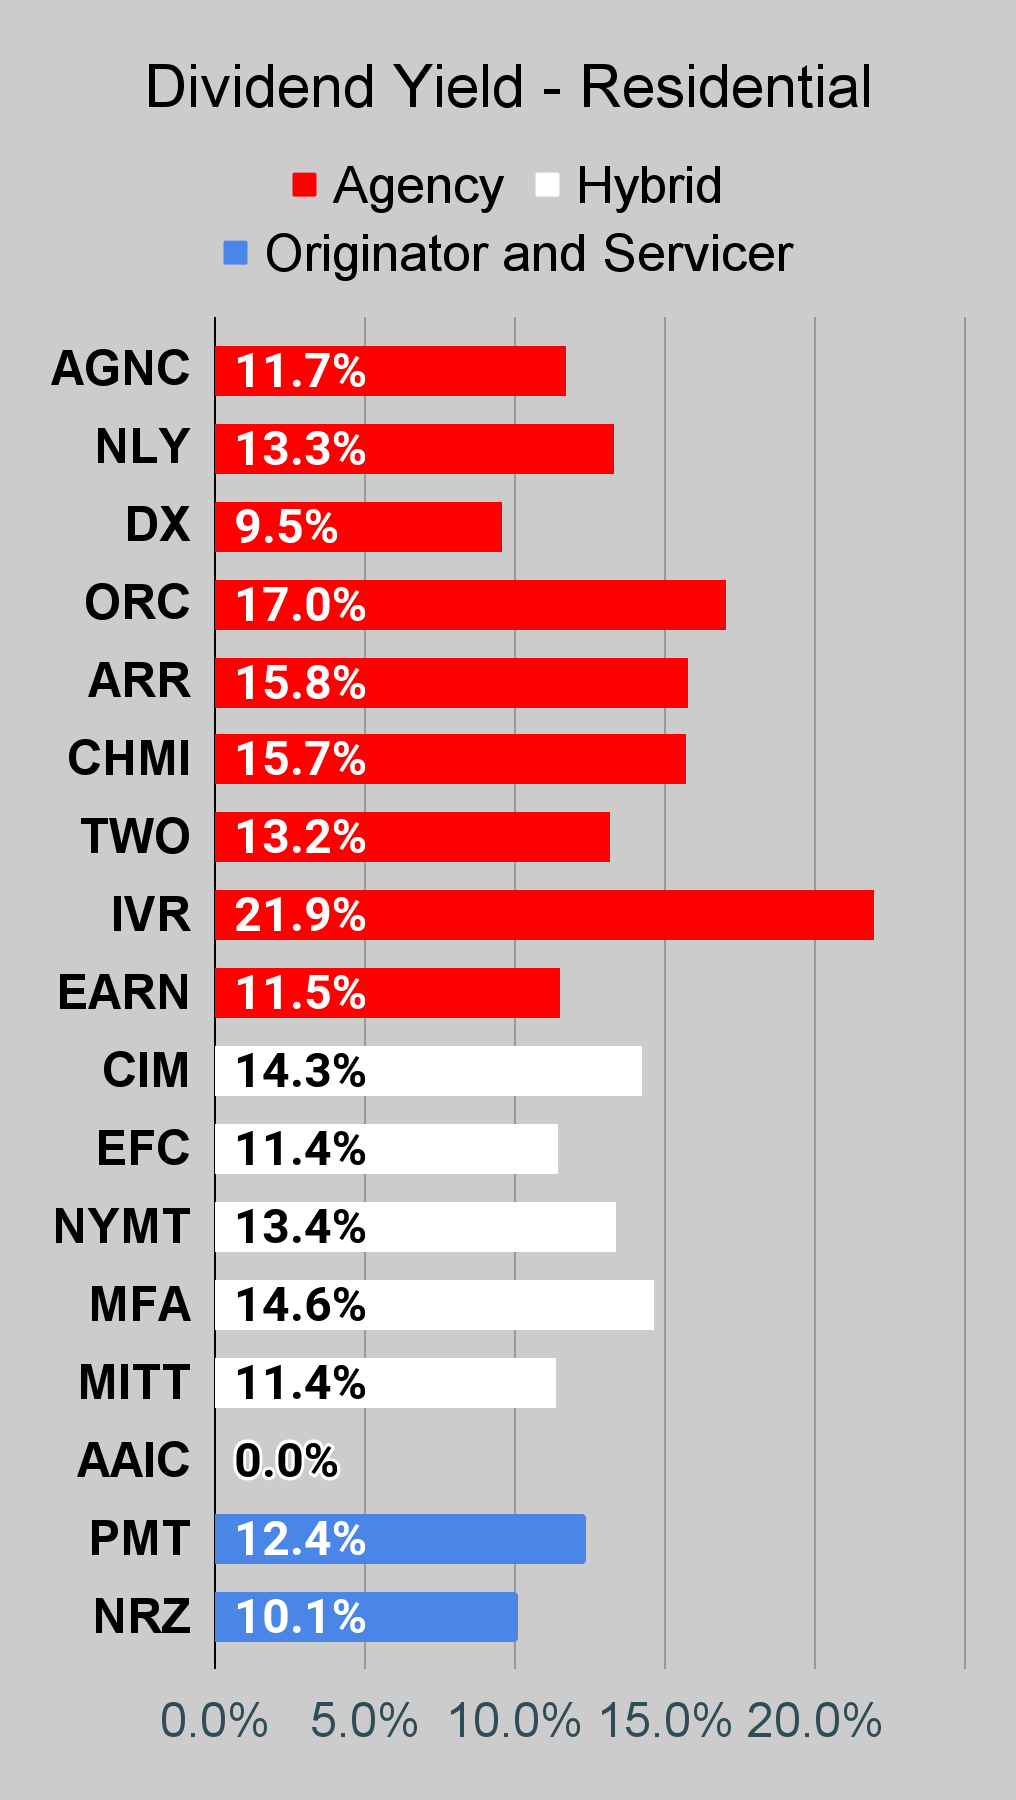
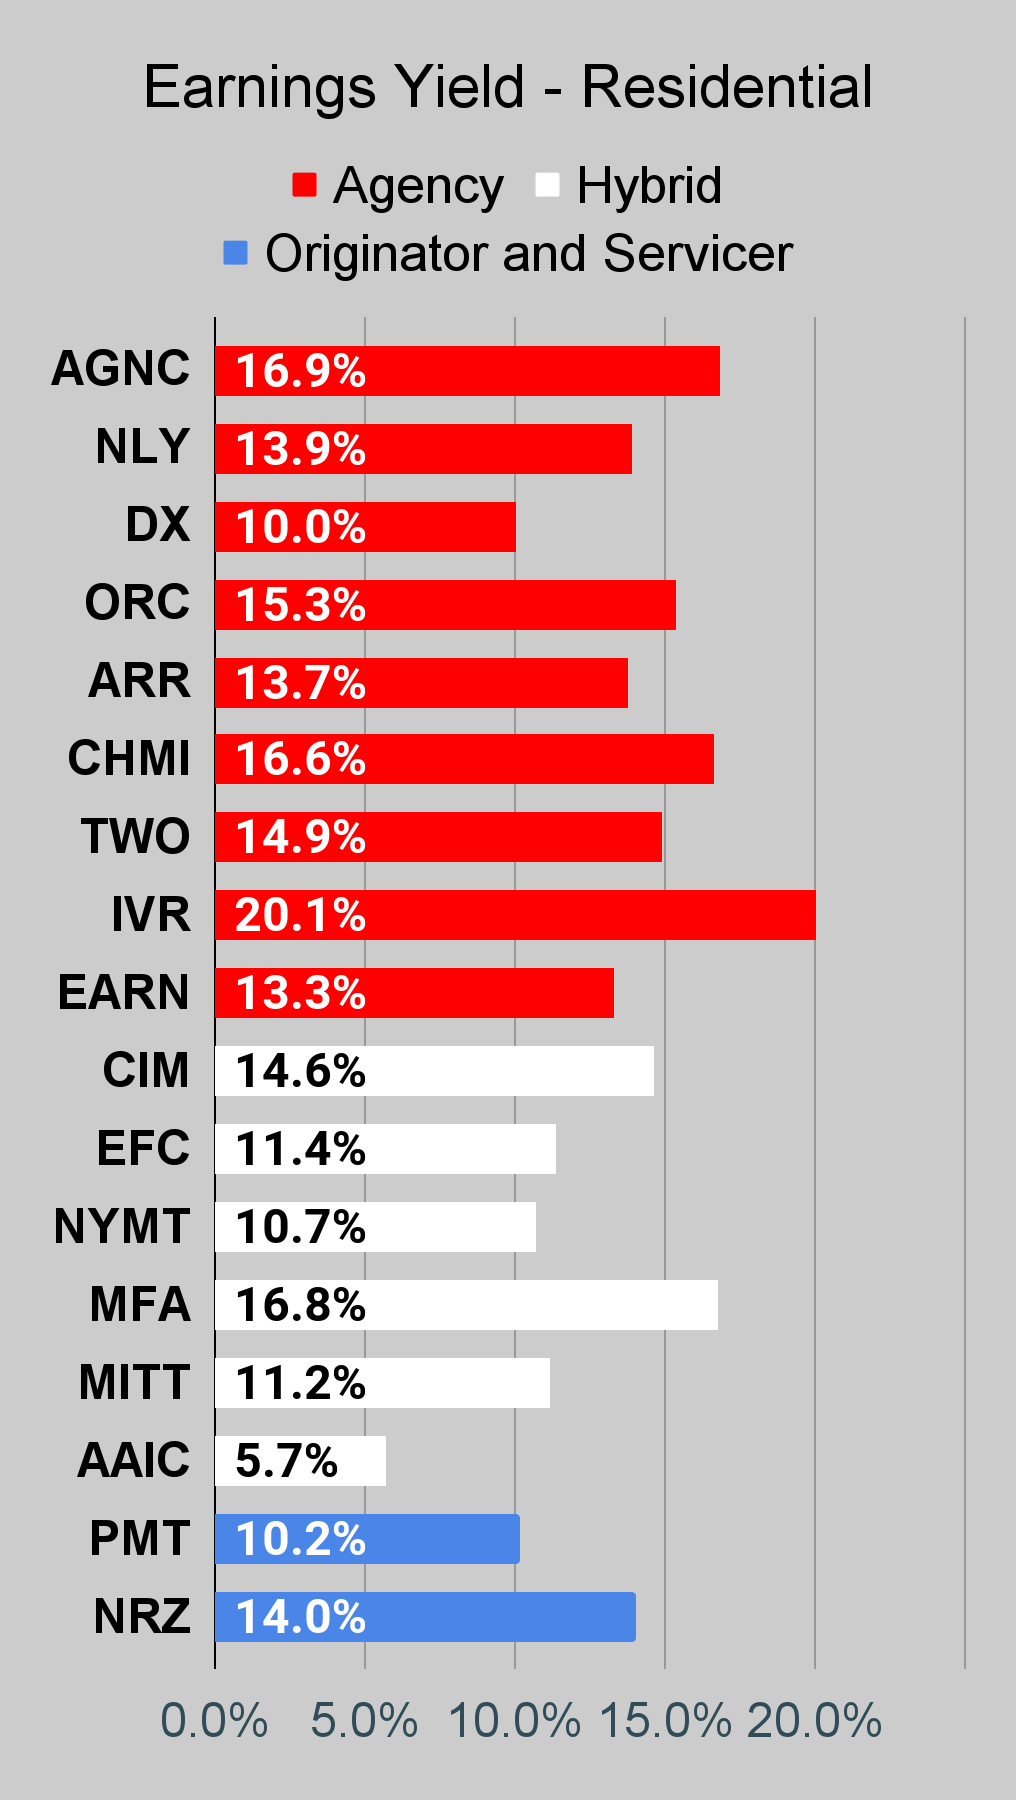
Residential Mortgage REIT Charts
Note: The chart for our public articles uses the book value per share from the latest earnings release. Current estimated book value per share is used in reaching our targets and trading decisions. It is available in our service, but those estimates are not included in the charts below.
Note: Q2 2022 earnings are underway. We will update the layout soon to include charts for Q2 2022 book values.
 The REIT Forum |
 The REIT Forum |
 The REIT Forum |
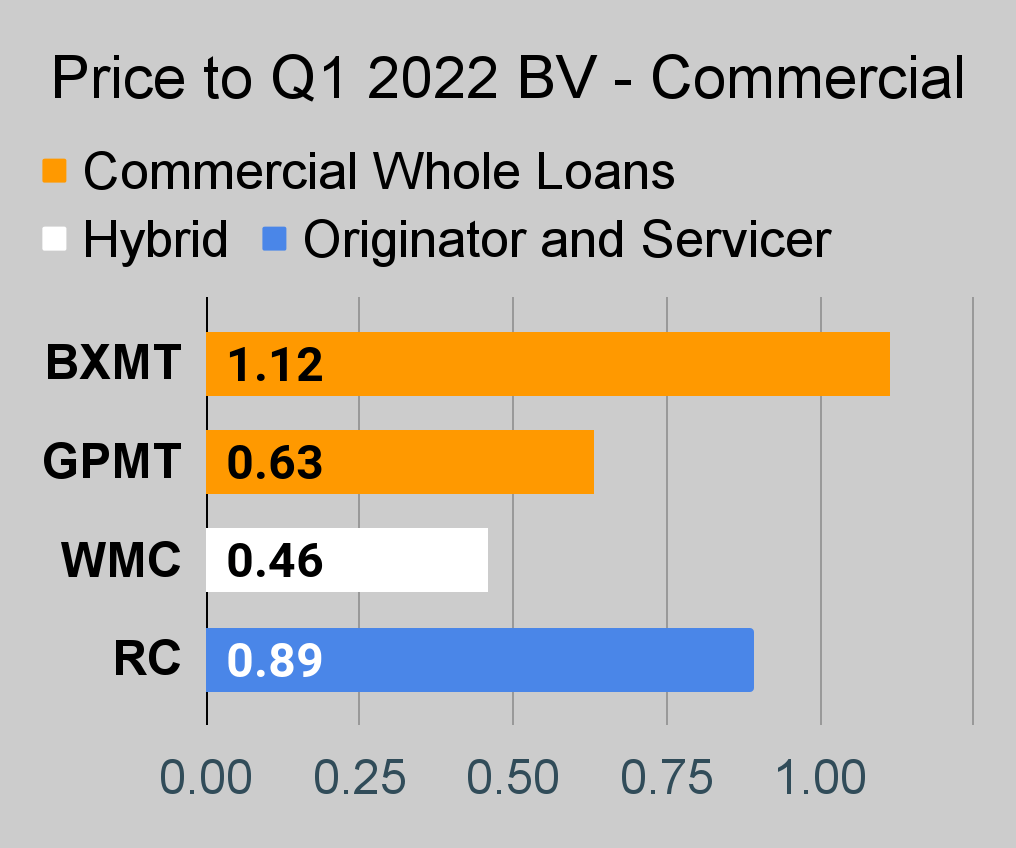
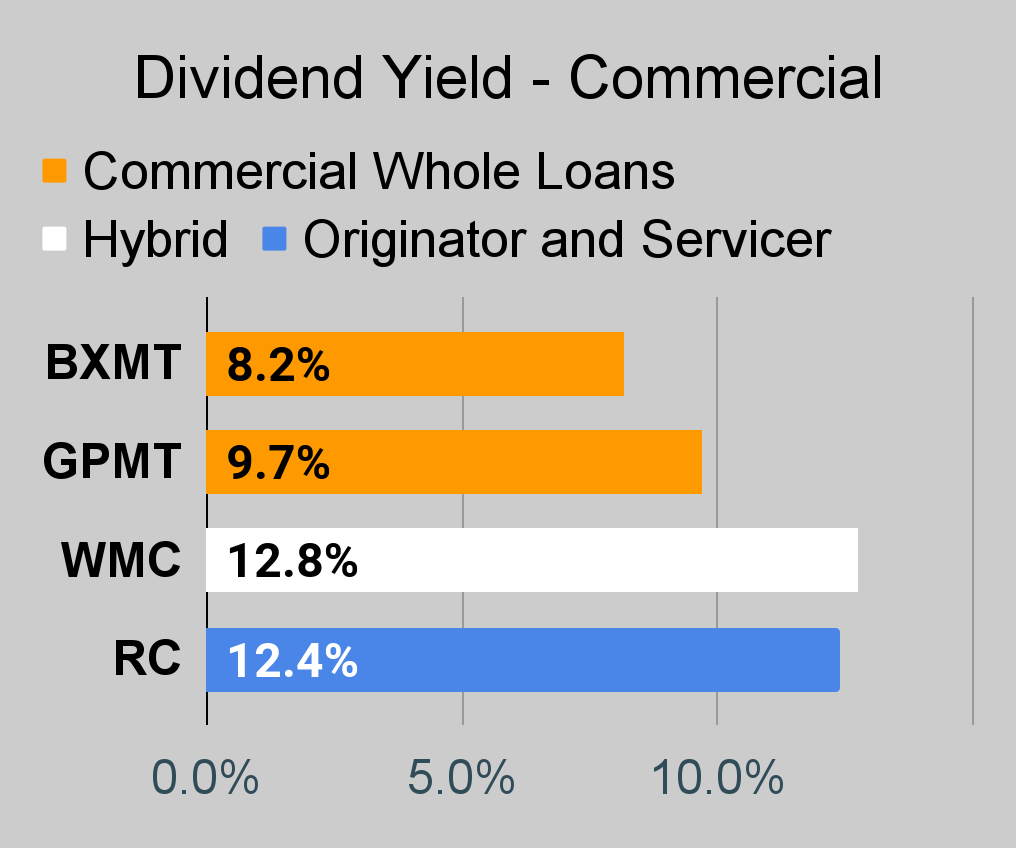
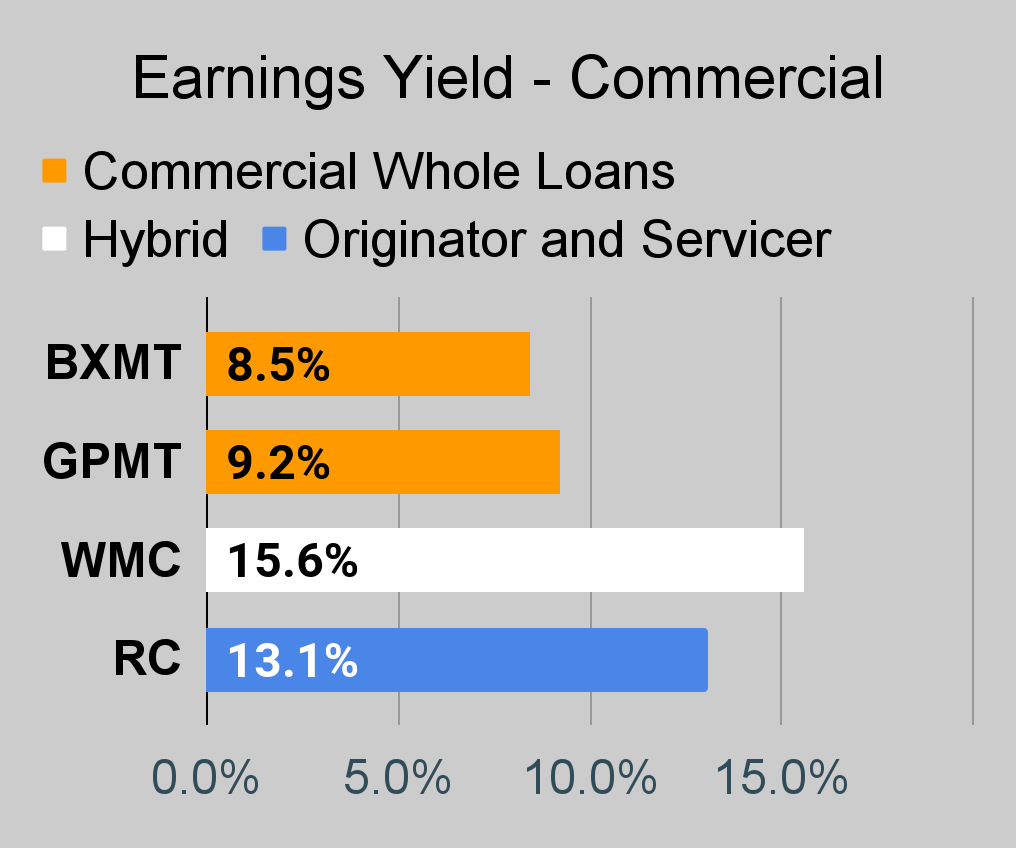
Commercial Mortgage REIT Charts
 The REIT Forum |
 The REIT Forum |
 The REIT Forum |
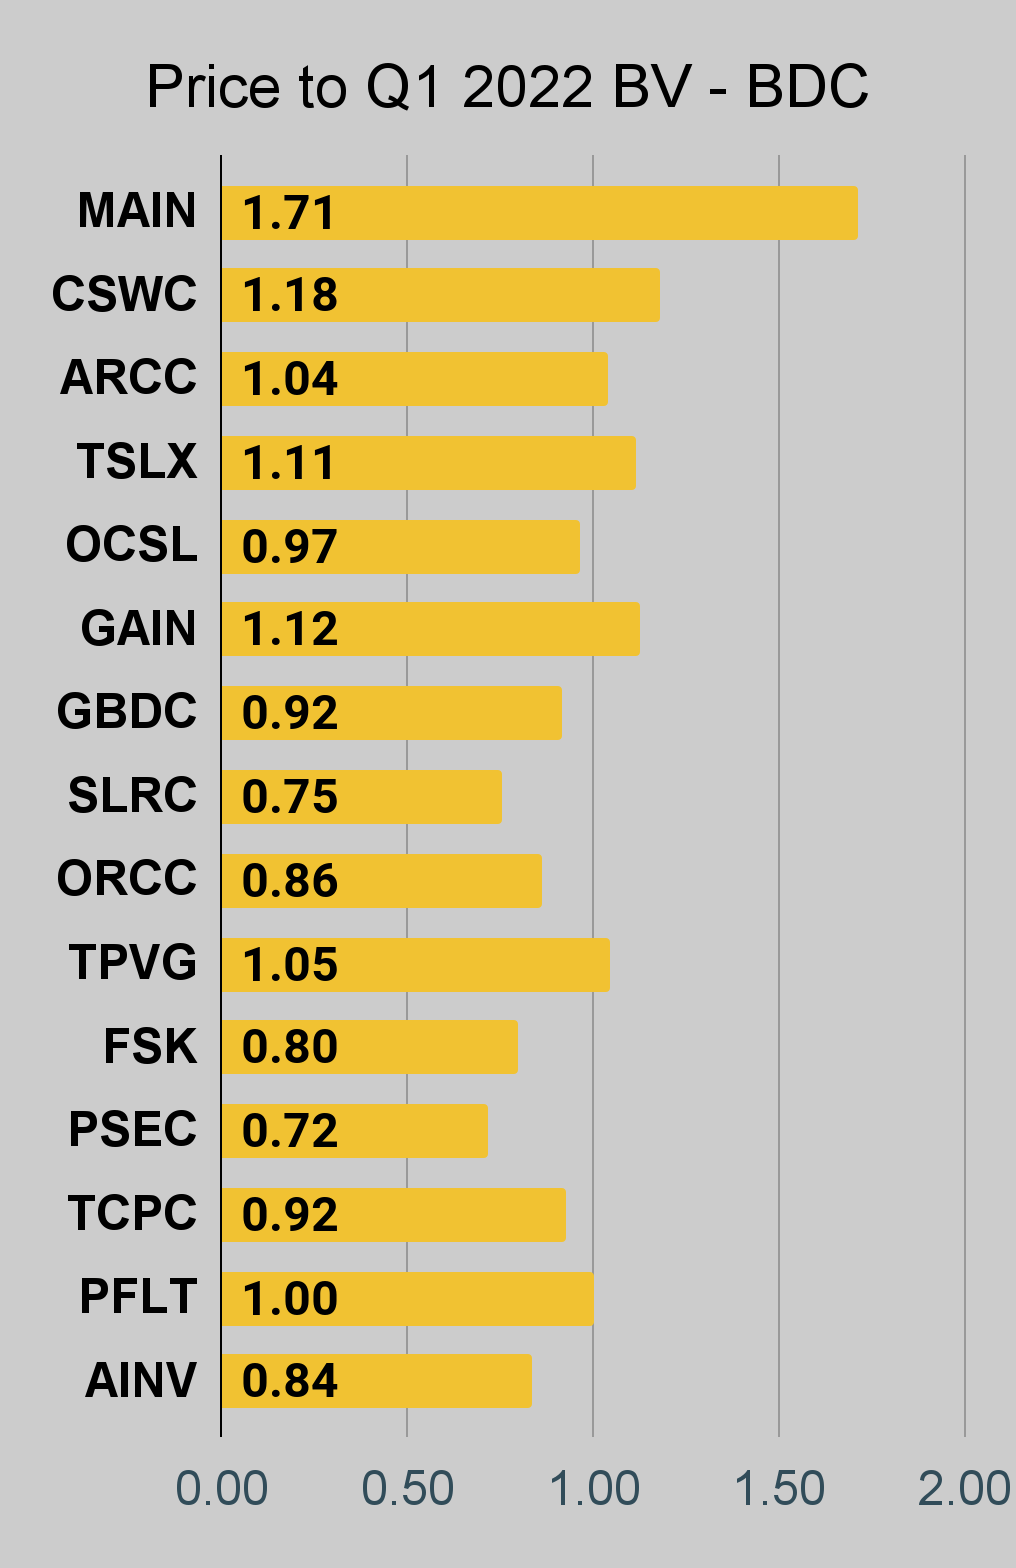
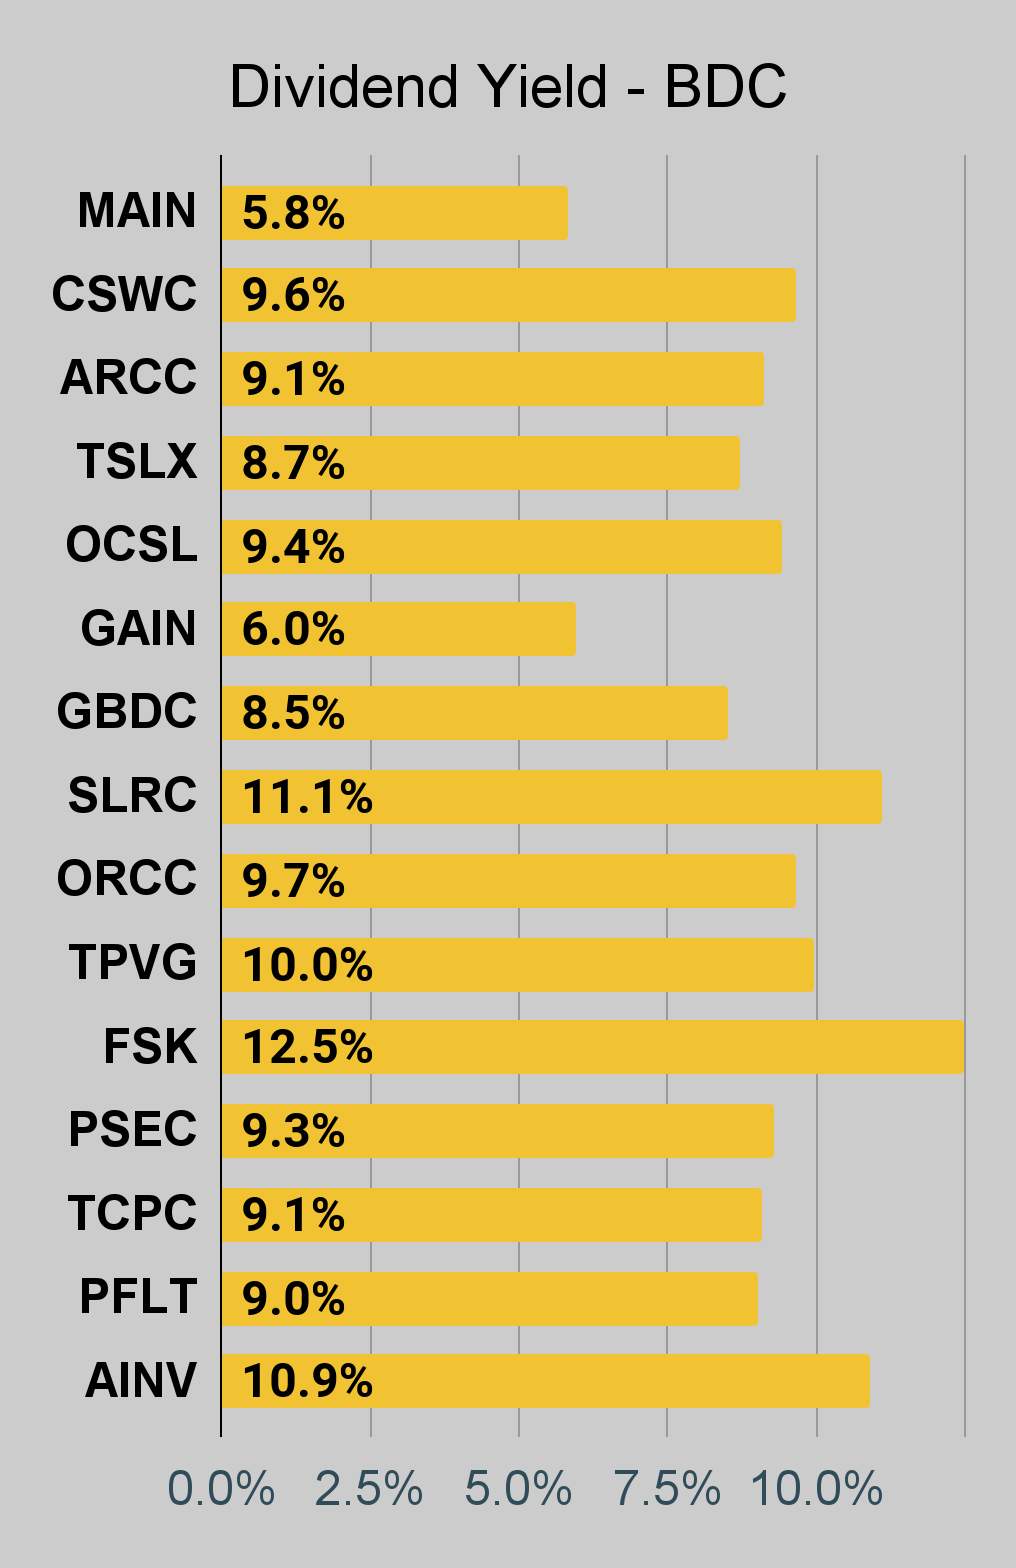
BDC Charts
 The REIT Forum |
 The REIT Forum |
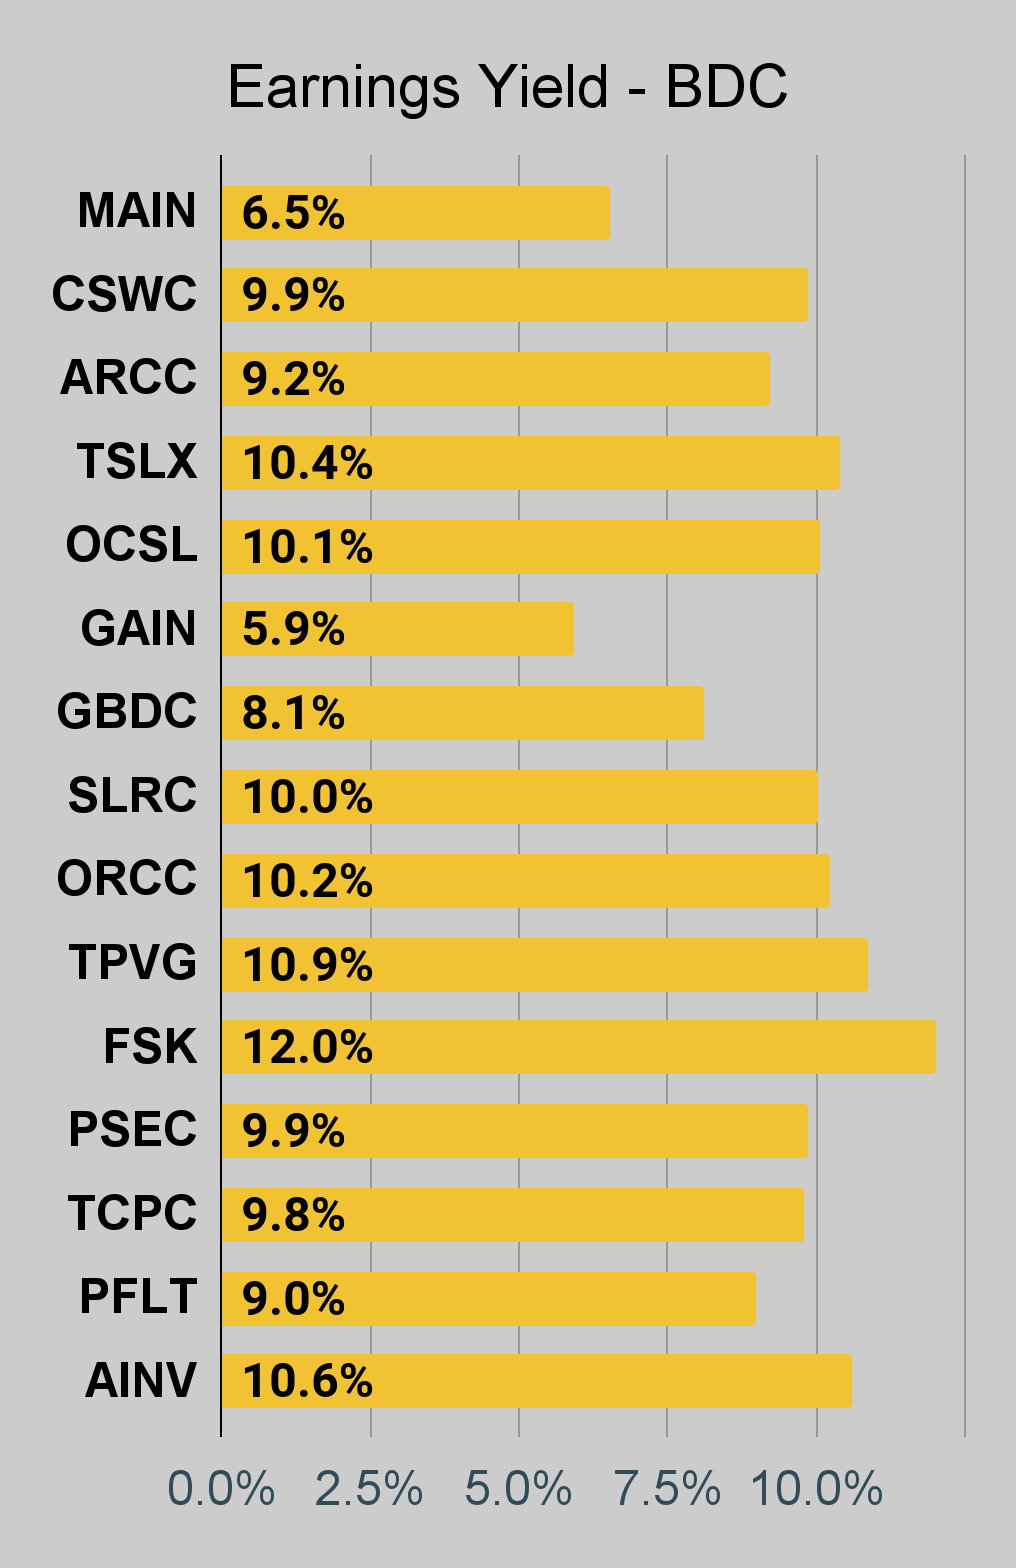 The REIT Forum |
Preferred Share Charts
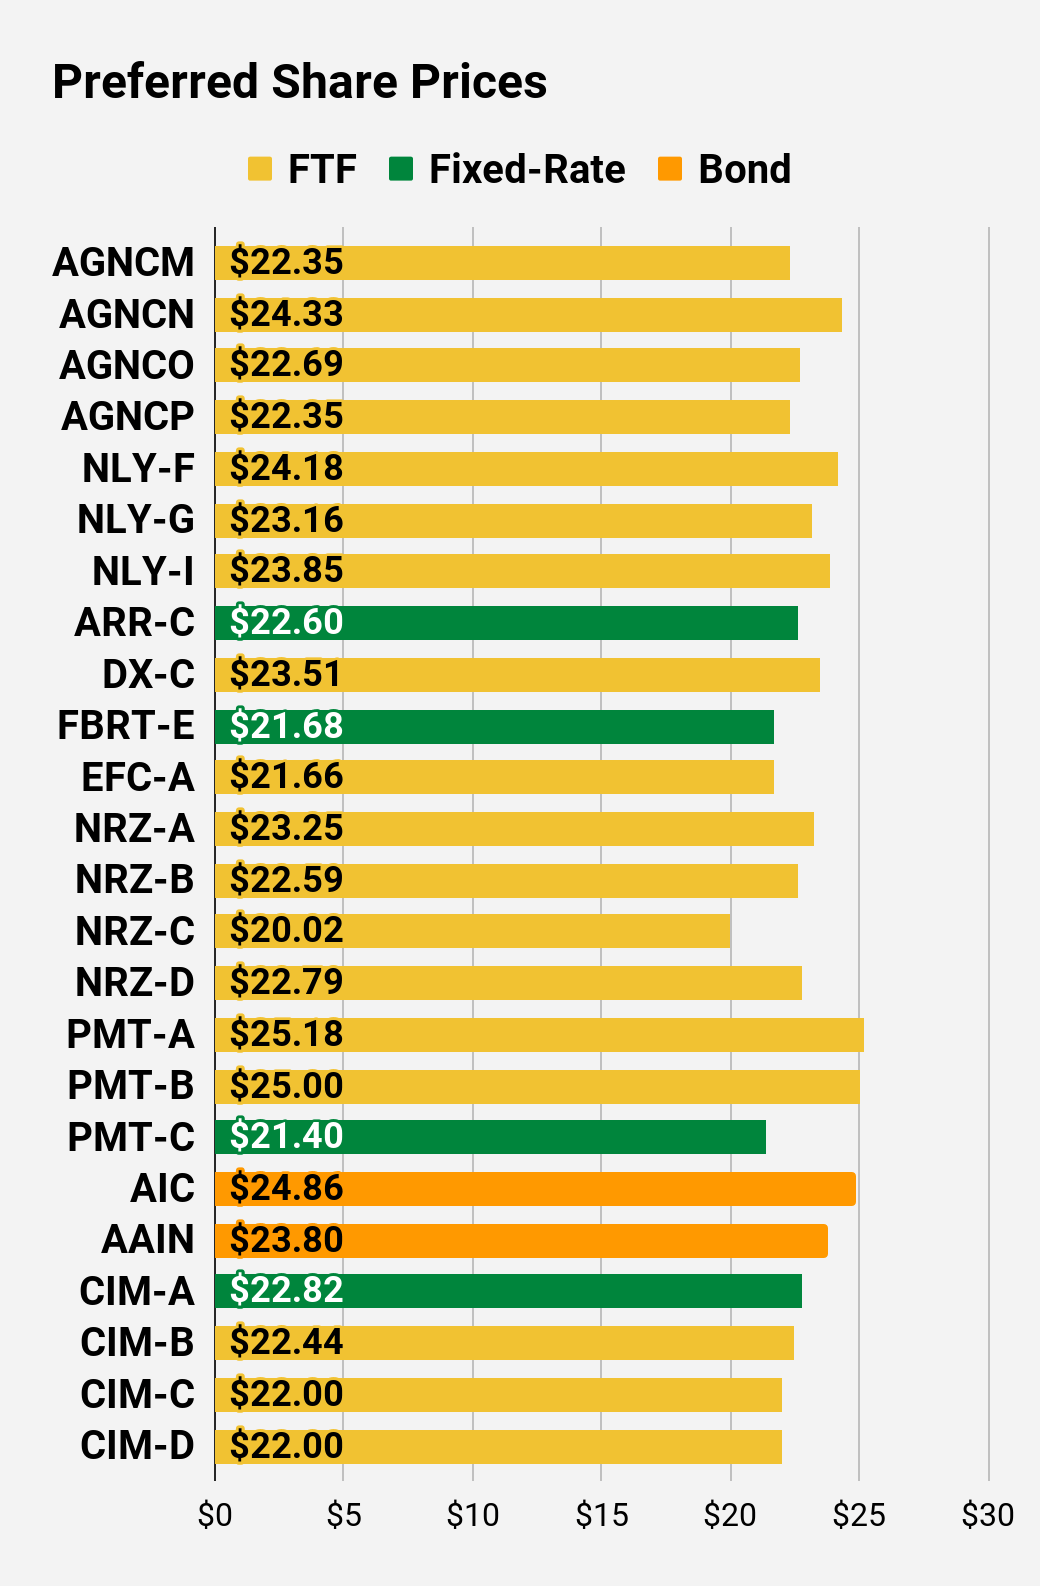 The REIT Forum |
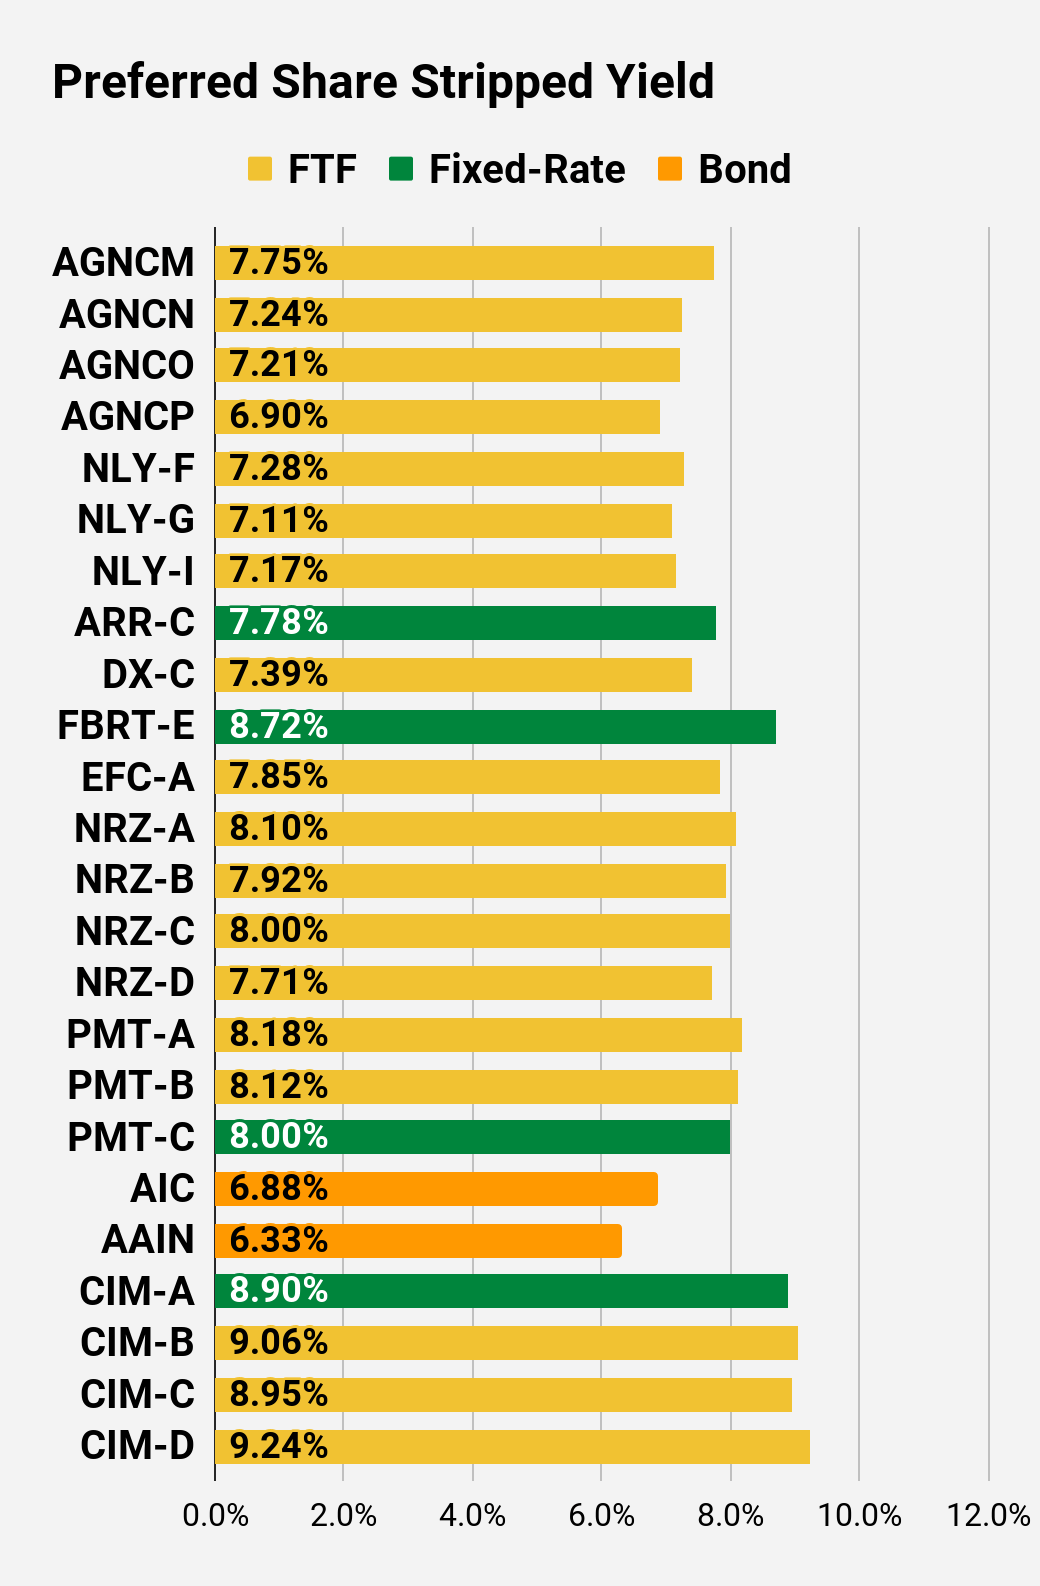 The REIT Forum |
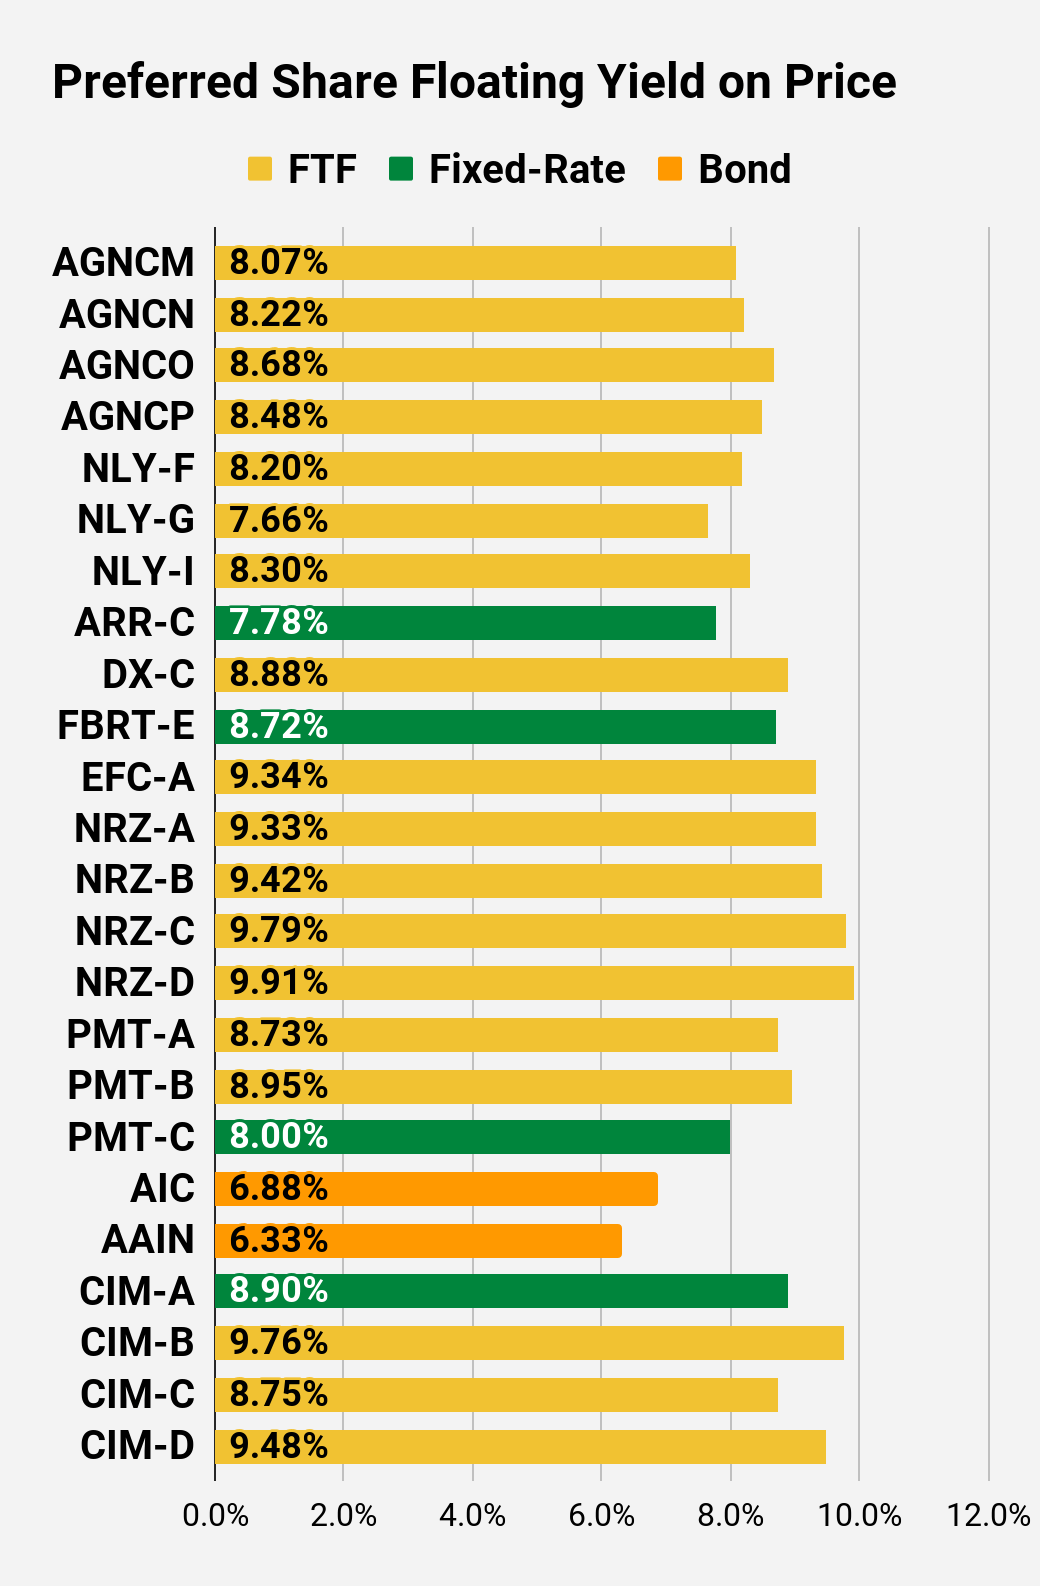 The REIT Forum |
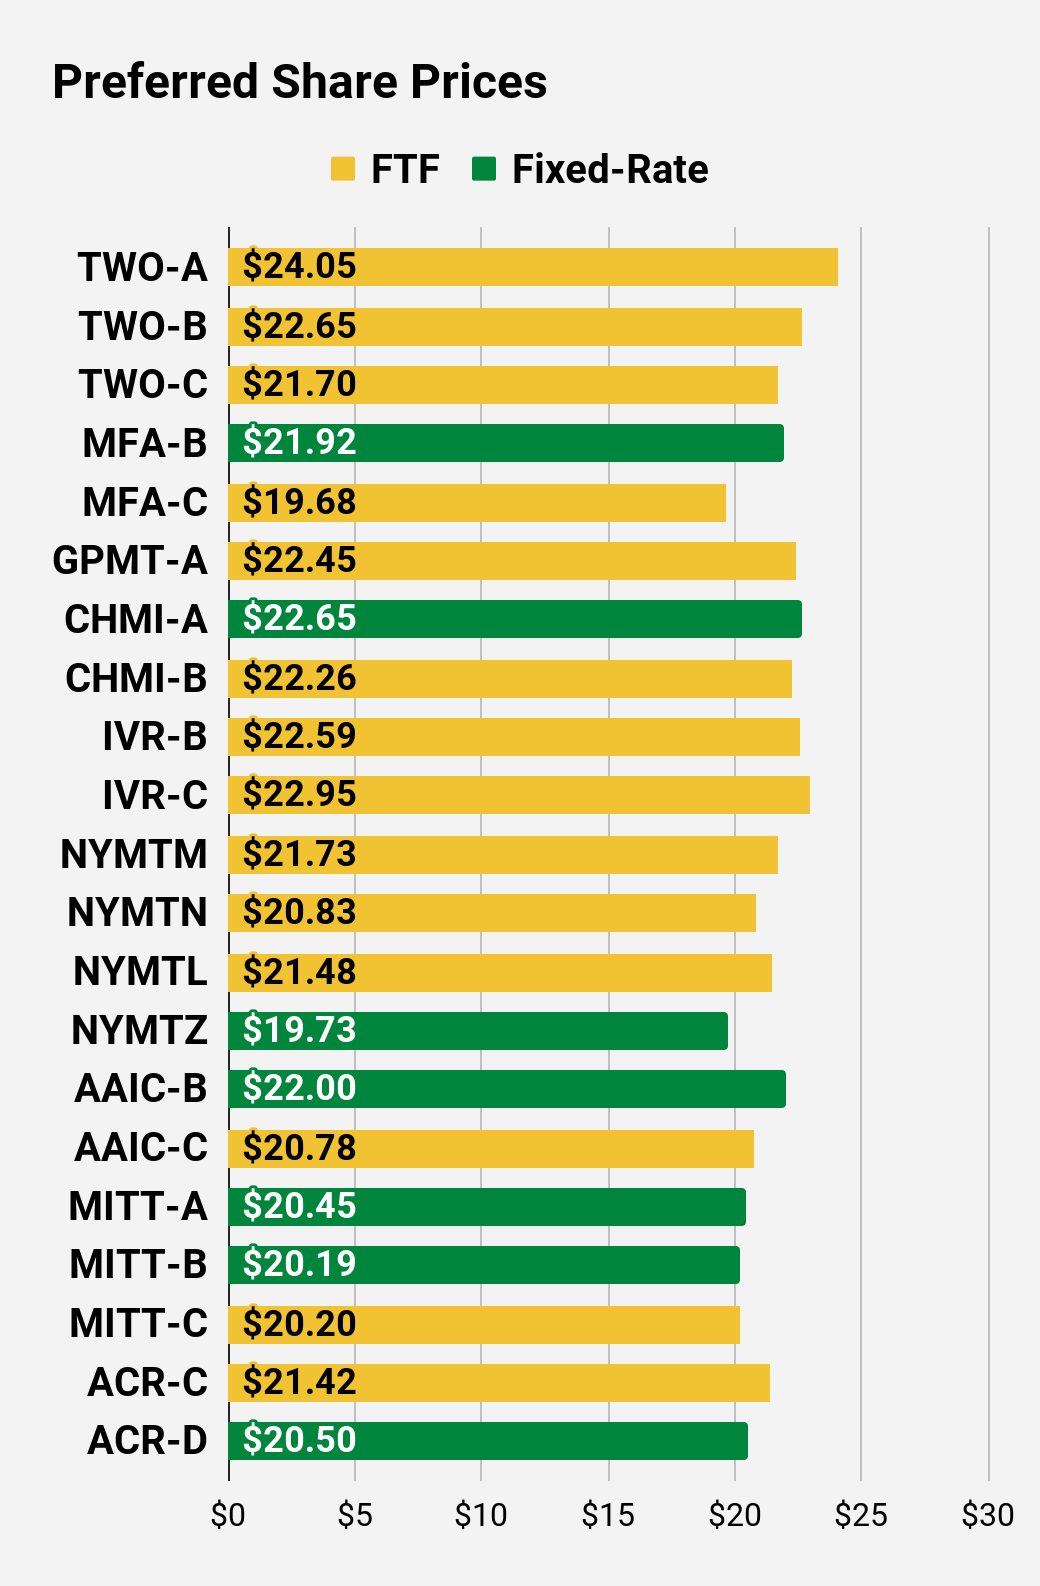 The REIT Forum |
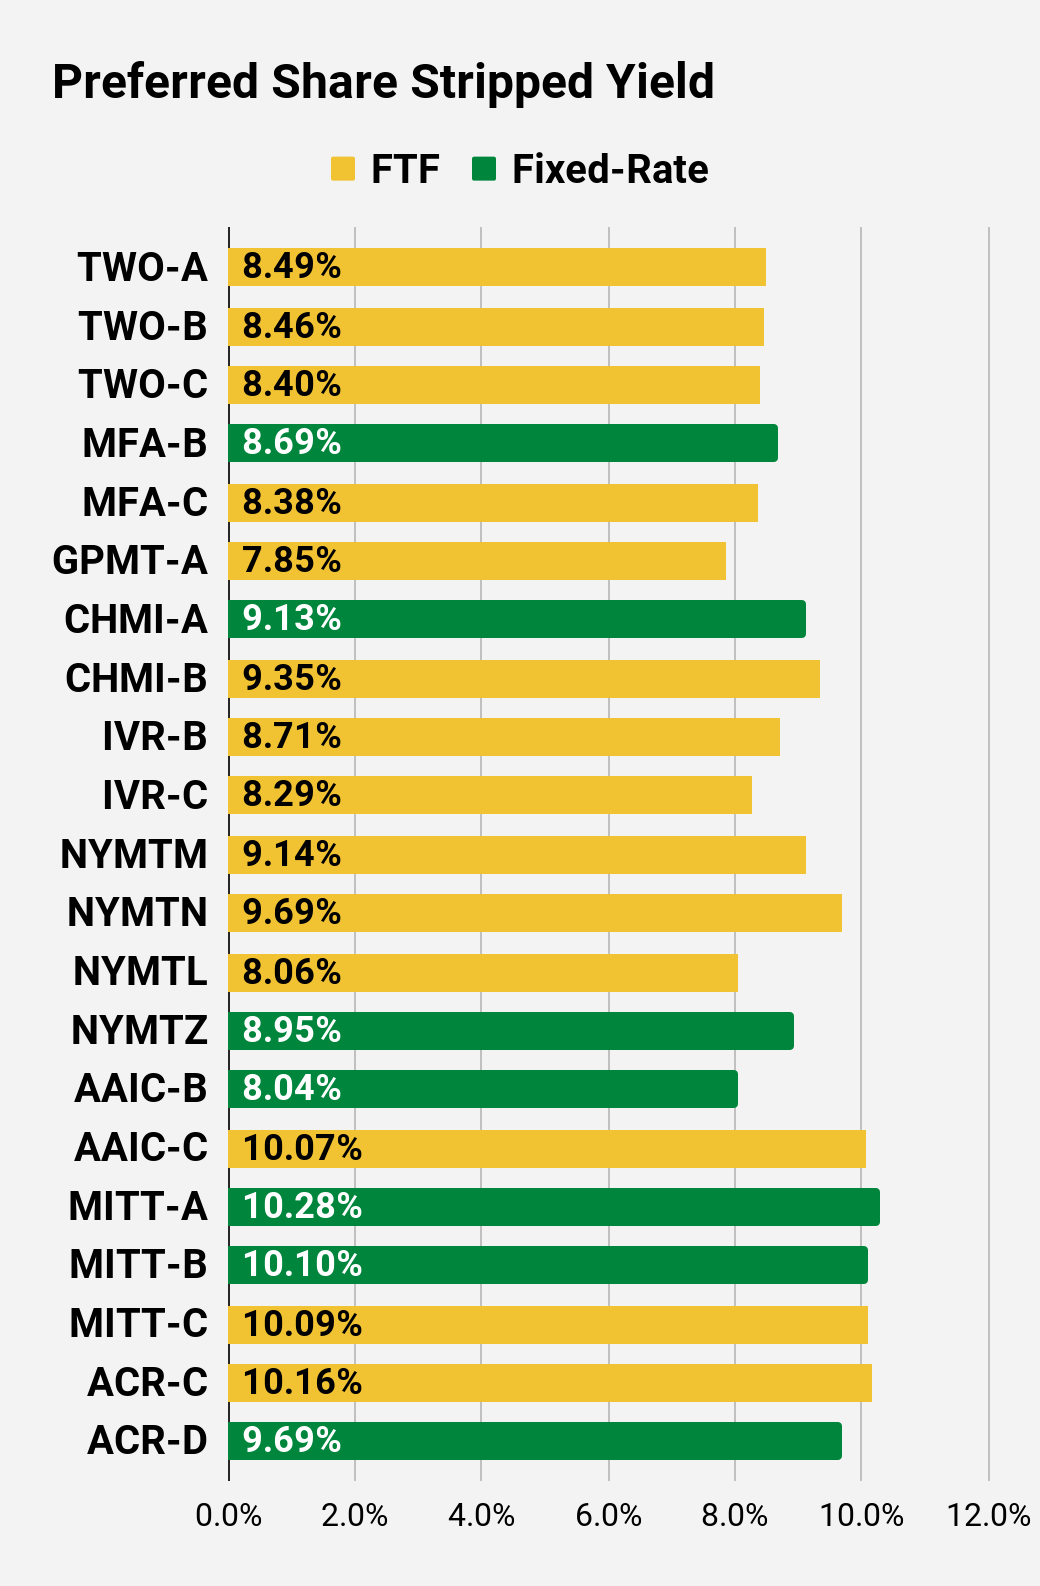 The REIT Forum |
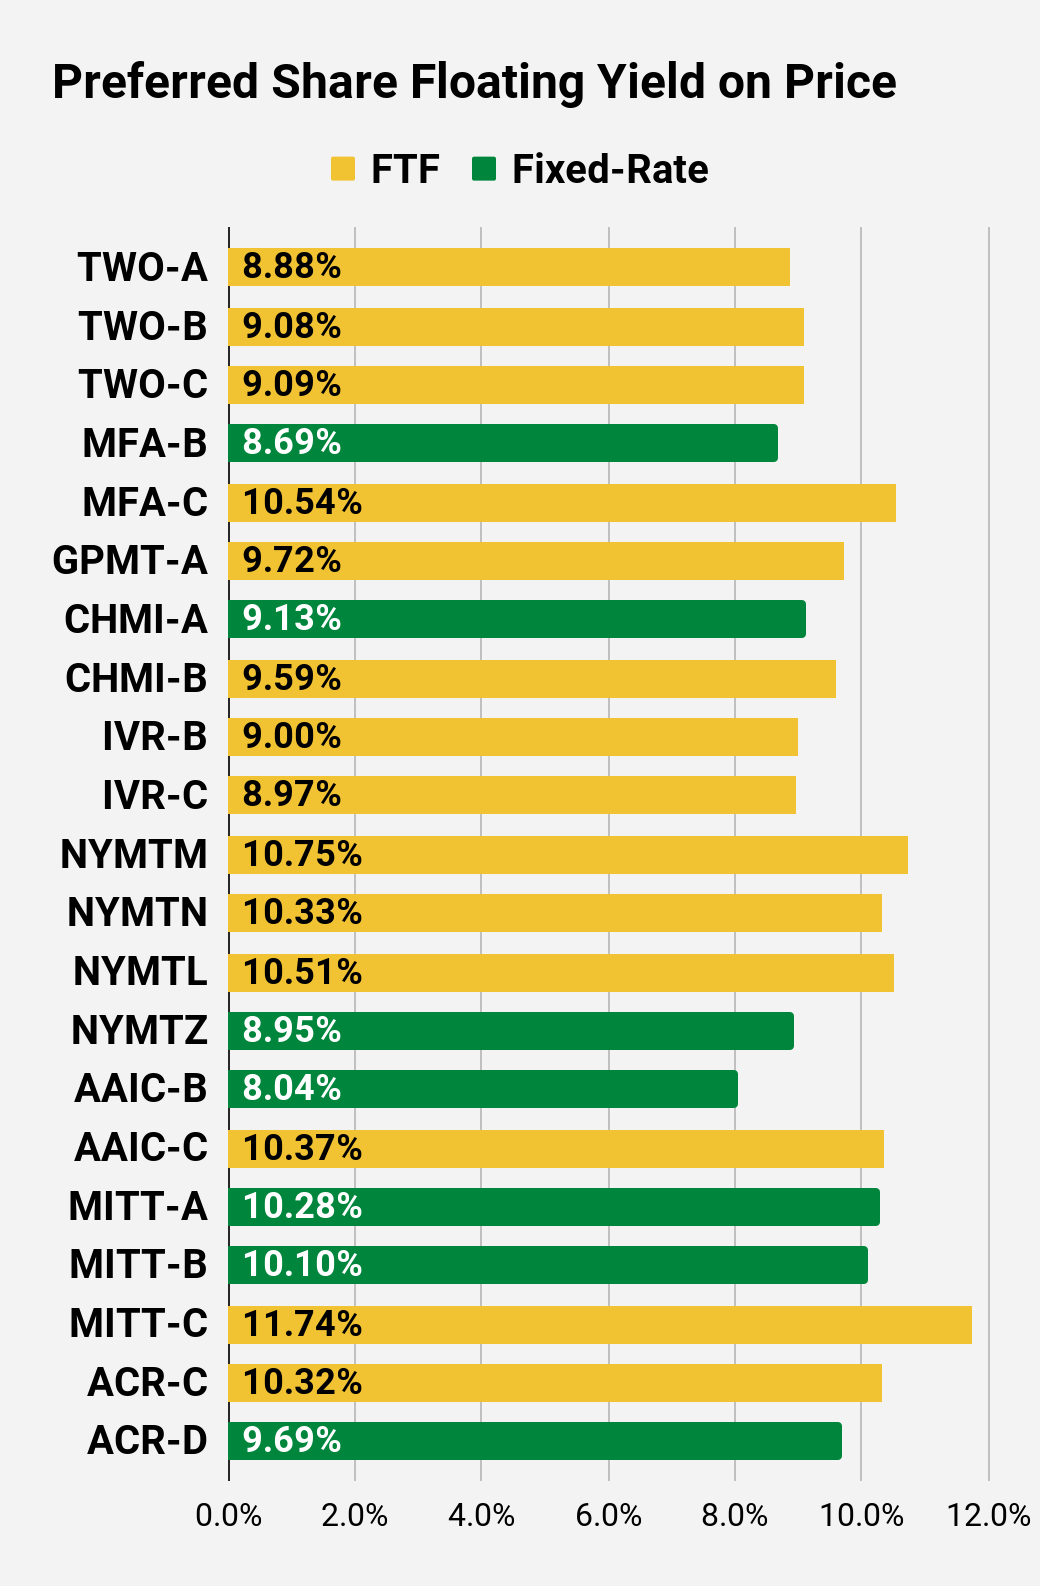 The REIT Forum |
Preferred Share Data
Beyond the charts, we’re also providing our readers with access to several other metrics for the preferred shares.
After testing out a series on preferred shares, we decided to try merging it into the series on common shares. After all, we are still talking about positions in mortgage REITs. We don’t have any desire to cover preferred shares without cumulative dividends, so any preferred shares you see in our column will have cumulative dividends. You can verify that by using Quantum Online. We’ve included the links in the table below.
To better organize the table, we needed to abbreviate column names as follows:
- Price = Recent Share Price – Shown in Charts
- BoF = Bond or FTF (Fixed-to-Floating)
- S-Yield = Stripped Yield – Shown in Charts
- Coupon = Initial Fixed-Rate Coupon
- FYoP = Floating Yield on Price – Shown in Charts
- NCD = Next Call Date (the soonest shares could be called)
- Note: For all FTF issues, the floating rate would start on NCD.
- WCC = Worst Cash to Call (lowest net cash return possible from a call)
- QO Link = Link to Quantum Online Page
Second Batch:
Strategy
Our goal is to maximize total returns. We achieve those most effectively by including “trading” strategies. We regularly trade positions in the mortgage REIT common shares and BDCs because:
- Prices are inefficient.
- Long-term, share prices generally revolve around book value.
- Short-term, price-to-book ratios can deviate materially.
- Book value isn’t the only step in analysis, but it is the cornerstone.
We also allocate to preferred shares and equity REITs. We encourage buy-and-hold investors to consider using more preferred shares and equity REITs.
Performance
We compare our performance against 4 ETFs that investors might use for exposure to our sectors:
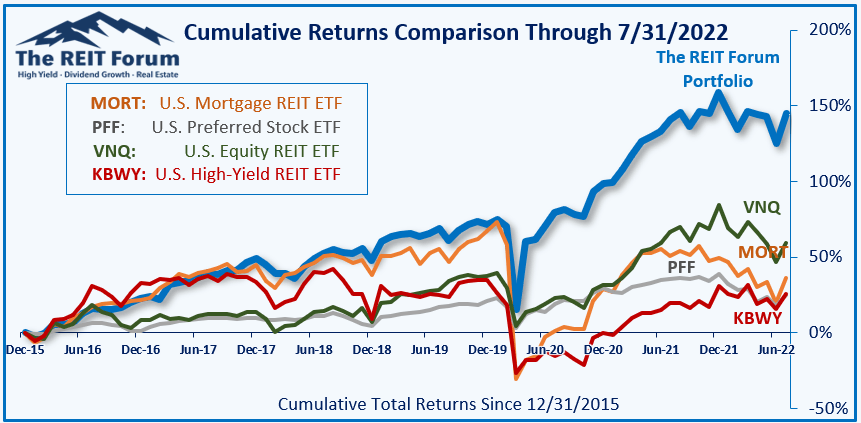
The REIT Forum
The 4 ETFs we use for comparison are:
|
Ticker |
Exposure |
|
One of the largest mortgage REIT ETFs |
|
|
One of the largest preferred share ETFs |
|
|
Largest equity REIT ETF |
|
|
The high-yield equity REIT ETF. Yes, it has been dreadful. |
When investors think it isn’t possible to earn solid returns in preferred shares or mortgage REITs, we politely disagree. The sector has plenty of opportunities, but investors still need to be wary of the risks. We can’t simply reach for yield and hope for the best. When it comes to common shares, we need to be even more vigilant to protect our principal by regularly watching prices and updating estimates for book value and price targets.
Ratings:
Be the first to comment