

Daniel Balakov
As we head into the end of the year, we have seen the market make some interesting swings but the volatility has dropped to some of the lowest levels seen this year.
The VIX index has always been a pretty reliable source of understanding which way the market is heading.
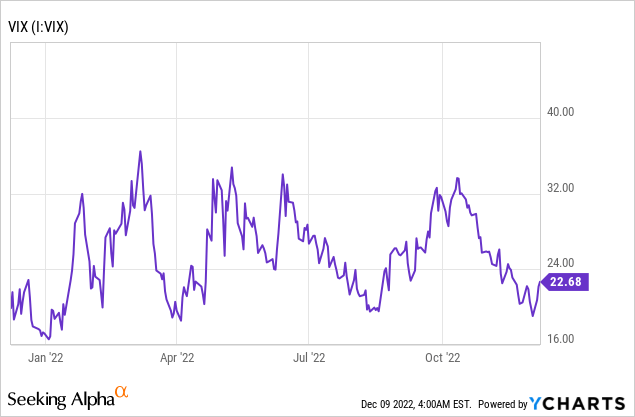
It’s no surprise that with volatility at a record low that it would coincide with the Federal Reserve indicating that interest-rate increases will start to moderate. It’s important that investors consider the recent increases are the most aggressive we have seen since 1980.
Background
For those who are interested in John and Jane’s full background, please click the following link here for the last time I published their full story. The details below are updated for 2022.
- This is a real portfolio with actual shares being traded.
- I am not a financial advisor and merely provide guidance based on a relationship that goes back several years.
- John retired in January 2018 and now only collects Social Security income as his regular source of income.
- Jane officially retired at the beginning of 2021, and she is collecting Social Security as her only regular source of income.
- John and Jane have decided to start taking draws from the Taxable Account and John’s Traditional IRA to the tune of $1,000/month each. These draws are currently covered in full by the dividends generated in each account.
- John and Jane have other investments outside of what I manage. These investments primarily consist of minimal-risk bonds and low-yield certificates.
- John and Jane have no debt and no monthly payments other than basic recurring bills such as water, power, property taxes, etc.
The reason why I started helping John and Jane with their retirement accounts is that I was infuriated by the fees they were being charged by their previous financial advisor. I do not charge John and Jane for anything that I do, and all I have asked of them is that they allow me to write about their portfolio anonymously in order to help spread knowledge and to make me a better investor in the process.
Generating a stable and growing dividend income is the primary focus of this portfolio, and capital appreciation is the least important characteristic. My primary goal was to give John and Jane as much certainty in their retirement as I possibly can because this has been a constant point of stress over the last decade.
Dividend Increases
Three companies paid increased dividends/distributions or a special dividend during the month of November in the Taxable Account.
Arbor Realty
ABR’s share price has been accelerating for years (with initial Covid lockdowns resulting in a major, but temporary, pullback) but it appears that the Federal Reserve’s position towards higher interest rates has made other investments more attractive. ABR’s Q3-2022 earnings jump significantly with rising net interest income explaining the rapid year-over-year earnings growth. In Q3-2021 the company generated $69.9 million of interest income compared to Q3-2022, which generated $99.3 million of interest income. ABR has also continued its recent trend of quarterly dividend increases which has been a pleasant trend in an industry that is notorious for large swings during times of uncertainty.
We reduced John and Jane’s holding by approximately 20% because this represented the highest cost portion of the ABR position. What we’re left with is an average share price is approximately half of the current stock price. There is no doubt that ABR continues to perform well, however, anyone who has read my articles before should understand that this is not a sleep well-at-night (SWAN) type of investment and therefore if you plan to invest it is important to accept the level of risk that comes with owning this type of investment. For reference, this position makes up just over 1.5% of John and Jane’s Taxable Account. We would consider adding more shares if we saw a drastic drop in share price (likely something closer to $11/share).
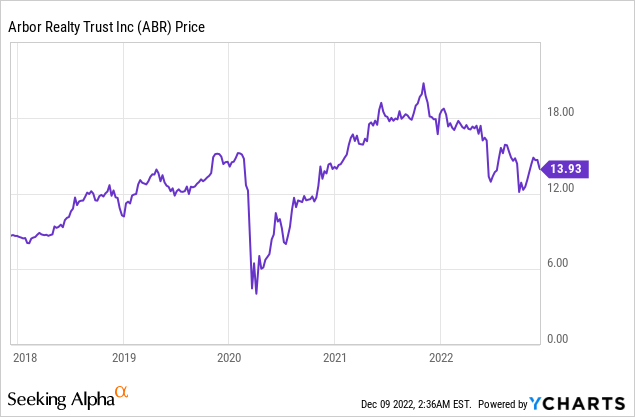
The dividend was increased from $.39/share per quarter to $.40/share per quarter. This represents an increase of 2.6% and a new full-year payout of $1.60/share compared with the previous $1.56/share. This results in a current yield of 11.46% based on the current share price of $13.93.
Energy Transfer
While many other companies are slashing full-year earnings estimates ET continues to buck the trend with its third FY-2022 positive earnings adjustment. In an update on November 1, ET has seen intrastate natural gas transportation natural gas volumes rise by 28% (and now sitting at all-time record) while interstate natural gas volumes jumped by 43%. As mentioned in the August Taxable Account update, we’ve increased the size of John and Jane’s position in ET during the months of April and May.
Distribution increases for the last four quarters (starting with the increase in February 2022) were 14.8%, 14.3%, 15%, and 15.2%, respectively. ET is rapidly growing the distribution back to previous levels of $.305/share per quarter prior to the dividend being cut in half in Q3-2020. The share price has managed to slowly climb back from record lows at the height of lockdowns and is in a much stronger position given the increased demand for its services.
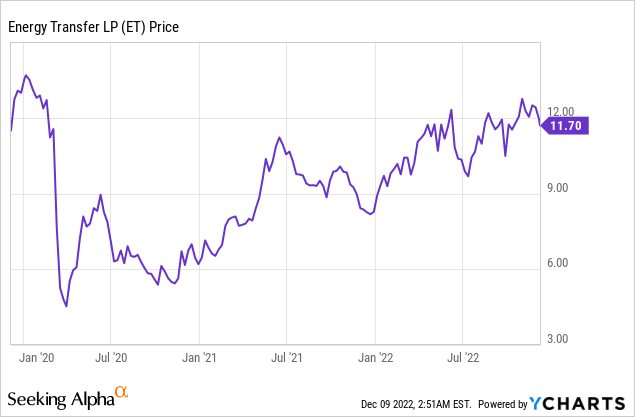
The dividend was increased from $.23/share per quarter to $.265/share per quarter. This represents an increase of 15.2% and a new full-year payout of $1.06/share compared with the previous $.92/share. This results in a current yield of 8.90% based on the current share price of $11.70.
Texas Instruments
We recently added more shares as the price yet again pulled back below $160/share (which pushes the dividend yield above 3%) and this is a very rare occurrence for a company that has seen its stock price grow six-fold over the last decade. Other than the initial phase of Covid lockdowns there have only been four occasions to buy shares where the dividend yield reached or exceeded 3%. For a company to grow its stock price six-fold over a decade while simultaneously growing its dividend at a 17% CAGR over the last five years is nothing less than outstanding. With talk of shifting more chip production to the United States, it would seem that TXN would only benefit from this initiative.
The dividend increase announcement also carried a hefty $15 billion share buyback announcement which was in addition to the $8.2 billion of share buybacks that remained available at the end of June.
We would look at adding to the existing position if the share price falls back into the $165/share range.
TXN – Dividend Yield (Seeking Alpha)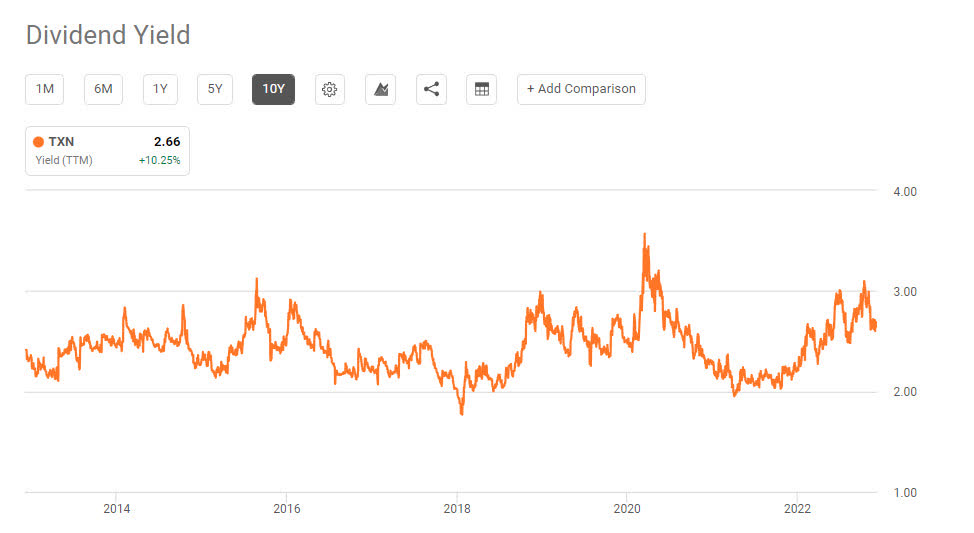
The dividend was increased from $1.15/share per quarter to $1.24/share per quarter. This represents an increase of 7.8% and a new full-year payout of $4.96/share compared with the previous $4.60/share. This results in a current yield of 2.85% based on the current share price of $176.36.
Positions
The Taxable Account currently consists of 43 unique positions at market close on December 8, 2022. There was only one sale that occurred during the month of November.
CLX – 2022-11 Sell Transaction (Charles Schwab)
For additional information on why we made this trade, I would encourage you to check out my most recent article which discusses the rationale for what we buy/sell.
The Retirees Dividend Portfolio – Account Transactions Through November 27
November Income Tracker – 2021 Vs. 2022
Prior to the special dividend from Old Republic International (ORI) it was estimated that the income generated in the Taxable Account would be less than what was generated in 2021. The Taxable Account is currently estimated to generate an average of $1,764.71/month of dividend income in 2022. This is now higher than the average monthly income of $1,680.56 generated in 2021 (John and Jane’s dividend income is approximately 5.0% ahead of 2021 performance). **Please note November 2021 income was previously reported higher than it was due to a copy-and-paste error. This has been updated for all corresponding tables and graphs.
A new item for readers to consider is the impact of draws on the Taxable Account which started in January in the amount of $1,000/month. The good news is that the portfolio generates more monthly income from dividends and distributions than John and Jane are looking to withdraw. The challenge for me is that I am used to running an account that is typically flush with excess cash that would allow greater ability to reinvest funds. Therefore, I will need to be more considerate of cash balances available at a given time. This also underscores the importance of the Cash Balance table in the images below that tracks the amount of cash on hand.
SNLH = Stocks No Longer Held – Dividends in this row represent the dividends collected on stocks that are no longer held in that portfolio. We still count the dividend income that comes from stocks no longer held in the portfolio, even though it is non-recurring. All images below come from Consistent Dividend Investor, LLC. (also referred to as CDI as the source below).
2022 – November – Taxable Dividend Breakdown (CDI)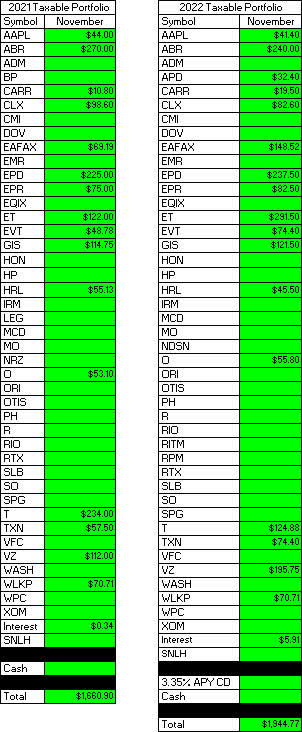
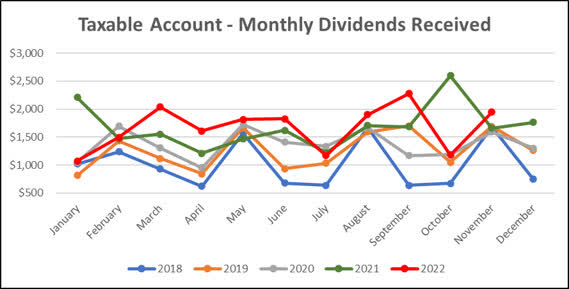
Here is a graphical illustration of the dividends received on a monthly basis. I have begun updating the chart to also reflect the dividends earned going back to January of 2018.
**Because of the large special dividend payouts that have been distorting the graphs below I have decided to remove the special dividend from the total for the graphs only. The special dividends will be reflected in all other tables.
2022 – November – Taxable Monthly Dividend Graph (CDI) 2022 – November – Taxable Monthly Dividend Line Graph (CDI)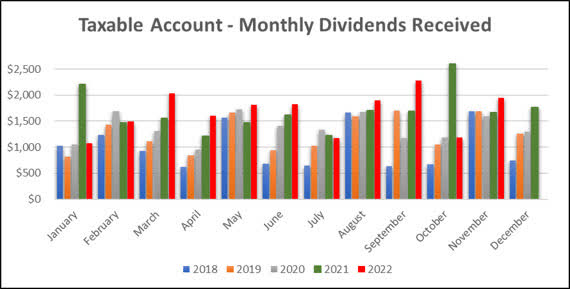
The table below represents all income generated in 2021 and collected/expected dividends in 2022.
2022 – November – Taxable Annual Estimate (CDI)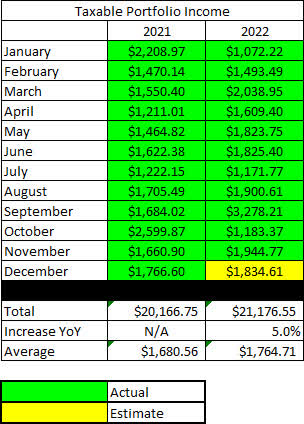
Below gives an extended look back at the dividend income generated when I first began writing these articles.
2022 – November – Taxable Dividend History (CDI)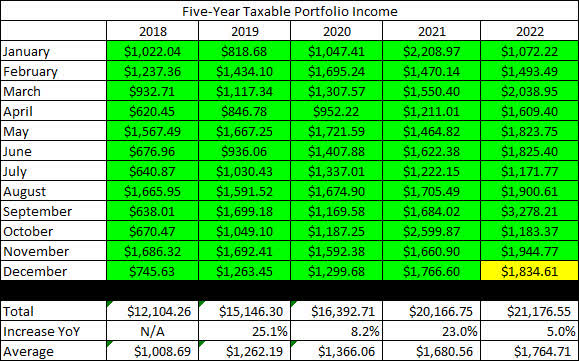
The Taxable Account balances below are from November 30, 2022, and all previous months are taken from the end-of-month statement provided by Charles Schwab.
2022 – November – Taxable Month End Balance (CDI)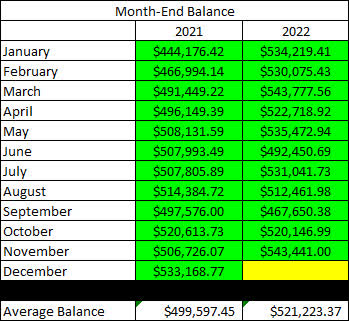
The next image is the only new table being added to the report for 2022. As mentioned previously, this is the first year that John and Jane will begin taking withdrawals from their Taxable Account (and also from John’s Traditional IRA). For this reason, I want to keep a record of these withdrawals because they will also have an impact on the account balance in the cash balance table (after this image).
2022 – November – Taxable Cash Balance (CDI)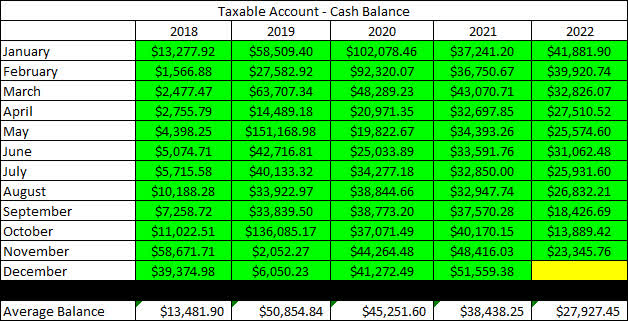
**It should be noted that the cash balance is reported as of September low by $20K which was the amount that was invested into the three-month CD. Although this is an investment comparable to cash I wanted to err on the side of conservative reporting.
There were large changes in cash at the end of 2019 and then again in 2020 (this was from the purchase of a physical asset and the sale of another) which explains why the balance fluctuated so much during this time. A lot of cash was deployed in March and April of 2020 as the pandemic caused share prices to plummet. John and Jane no longer qualify to make contributions to their Traditional or Roth IRAs, so there will also not be any funds taken from the Taxable Account to cover these contributions (which is what they typically did in the past).
The next image provides a history of the unrealized gain/loss at the end of each month going back to the beginning in January of 2018.
2022 – November – Taxable Unrealized Gain-Loss (CDI)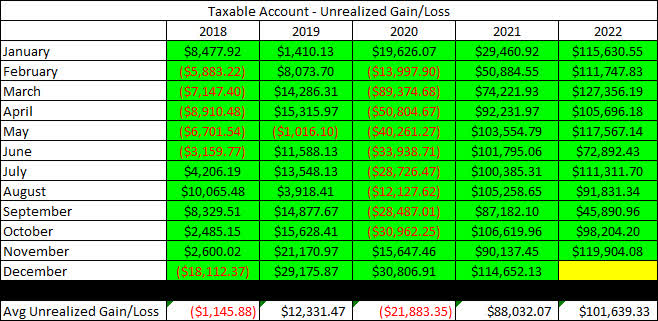
The main reason for including this is to help readers understand that the key to this strategy is to accept the risk, and I personally find that this table is an excellent representation of the volatility in the account. It is important to remember that tolerance for risk can vary significantly, but John and Jane are okay with additional risk because they are focused on generating income from these stocks.
In an effort to be transparent about John and Jane’s Taxable Account, I like to include an unrealized Gain/Loss summary. The numbers used are based on the closing prices from December 8th, 2022.
2022 – November – Taxable Gain-Loss Update (CDI)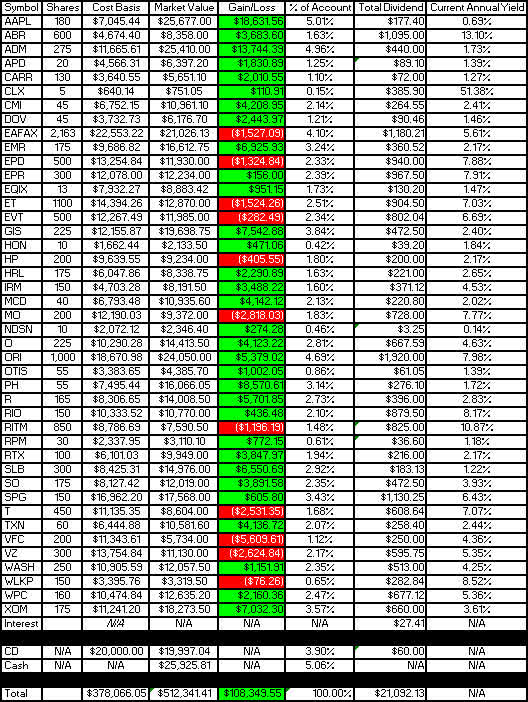
When reading the yield column, it is important to understand that the dividend yield is dependent on whether or not we have received a full year of income (this is the only way to keep it mostly accurate without requiring a lot of manual input or calculation on my part). I have updated these for the start of the year, so all yields reflected in the last column are accurate. I actually prefer this method because it will show the reduced yield of a position added partway through the year (thus reflecting an accurate benefit vs. an inflated benefit).
Lastly, I wanted to include the Monthly Year-Over-Year Income Comparison to show how the Taxable Account is trending.
2022 – November – Taxable Monthly Year-Over-Year Comparison (CDI)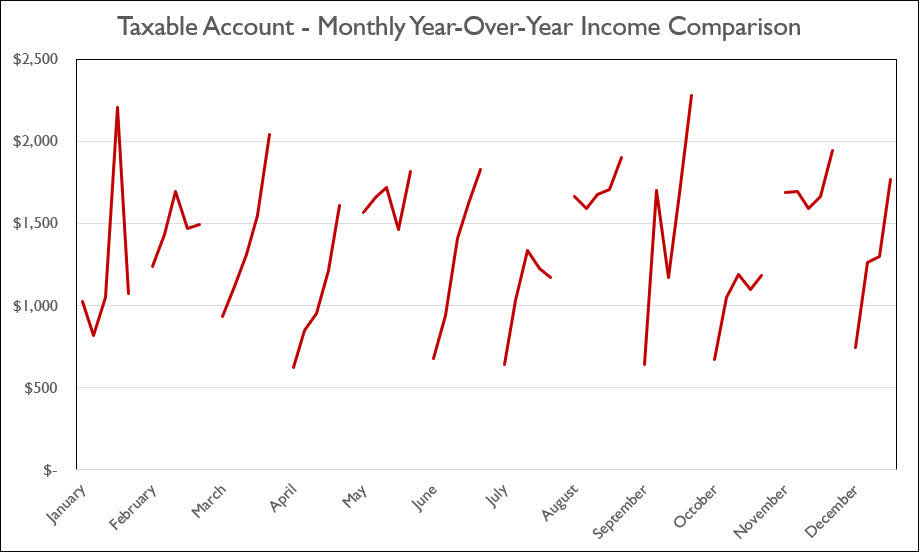
Conclusion
The upcoming rate hike will tell us more about where the Federal Reserve stands on how aggressively they plan to approach rate increases moving forward. Here is key information from November 14th regarding
Traders have increasingly raised their bets for a 50-basis-point rate increase for the December 13-14 meeting, in a less aggressive move when compared with the Fed’s 75-bp hikes at its prior four meetings. Again, the Fed, which has abided to its goal of bringing inflation down to its 2% objective, is data-dependent in the sense that it will need to see further monthly readings of cooler inflation. Of note, headline consumer prices climbed 7.7% in October from a year before, easing from September’s 8.2% print, but still way above the Fed’s target.
The upcoming increase depends on inflation and employment figures.
In John and Jane’s Taxable Account, they are currently long the following mentioned in this article: Apple (NASDAQ:AAPL), Arbor Realty (NYSE:ABR), Archer-Daniels-Midland (NYSE:ADM), Air Products and Chemicals (APD), Carrier Global Corporation (NYSE:CARR), Clorox (NYSE:CLX), Cummins (NYSE:CMI), Dover Corporation (NYSE:DOV), Eaton Vance Floating-Rate Advantage Fund A (MUTF:EAFAX), Emerson Electric (EMR), Enterprise Products Partners (NYSE:EPD), EPR Properties (NYSE:EPR), Equinix (NASDAQ:EQIX), Energy Transfer (NYSE:ET), Eaton Vance Tax-Advantaged Dividend Income Fund (NYSE:EVT), General Mills (NYSE:GIS), Honeywell (NASDAQ:HON), Helmerich & Payne (NYSE:HP), Hormel (NYSE:HRL), Iron Mountain (NYSE:IRM), McDonald’s (MCD), Altria (NYSE:MO), Nordson (NDSN), Realty Income (O), Old Republic International (ORI), Otis Worldwide Corporation (NYSE:OTIS), Parker-Hannifin (NYSE:PH), Ryder System (NYSE:R), Rio Tinto (RIO), Rithm Capital (RITM), RPM International (RPM), Raytheon Technologies (NYSE:RTX), Schlumberger (NYSE:SLB), Southern Company (NYSE:SO), Simon Property Group (SPG), AT&T (NYSE:T), Texas Instruments (NASDAQ:TXN), V.F. Corporation (VFC), Verizon (NYSE:VZ), Washington Trust (NASDAQ:WASH), Westlake Chemical (NYSE:WLKP), W. P. Carey (NYSE:WPC), and Exxon Mobil (XOM).
Be the first to comment