

Wavebreakmedia/iStock via Getty Images
Investment Summary
With the theme in risk-assets drifting continually to a risk-off climate, positioning of equity and cross-asset portfolios should ultimately mirror the distribution of outcomes in the global economy. Our probability distribution models have the chance at global recession at 90%. In that vein, discretionary macro-strategies look set to continue outperforming, as they have done historically in this kind of landscape.
Interest rate-driven volatility across assets has lifted volatility both ways, whilst valuation differentials continue to opened up the asymmetry in trading opportunities for equities. We argue, therefore, that discretionary strategies/managers with an acumen for tactical risk are critical in constructing convex portfolios for H2 FY22. This, and a constant weight to ‘quality’ and ‘resiliency’ factors.
Within health care, there are selective opportunities for investors looking to step up in the quality spectrum. One standout in this regard is ResMed Inc. (NYSE:RMD), a long-term cash compounder within the medical devices market. We are long-term holders of RMD and have enjoyed long-term capital gains from an overweight position that gets reviewed monthly. The stock has been punished recently and caught a downgrade from the sell-side despite a robust set of Q4 FY22/FY22 annual earnings. Note, being domiciled in Australia, RMD’s reporting period is June–June.
Exhibit 1. RMD 6-month price action
Data: Refinitiv Eikon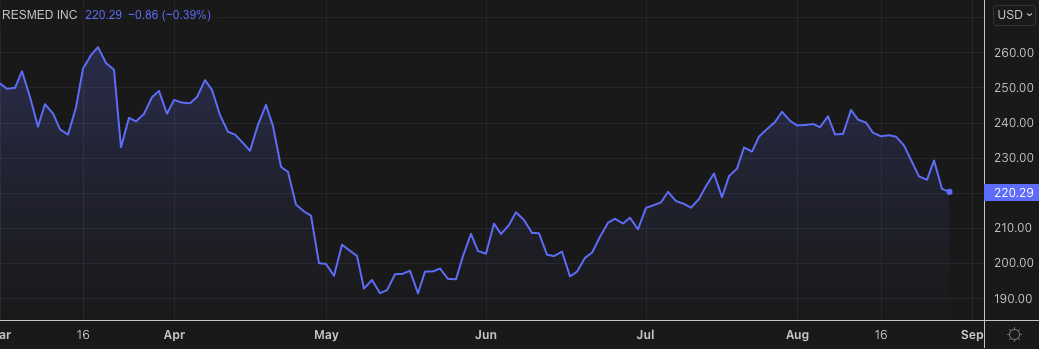
Here we argue the market has more than unfairly punished RMD, and, that when adjusting earnings to reflect true cash values for the company, measures of corporate value are even more appealing. We rate RMD a buy on a $284–311 price target.
RMD’s Q4 earnings give insight to resiliency
Fourth quarter revenue came in strong with upsides relative to consensus at the top and bottom lines. Revenue came in at a 400bps YoY increase to $915 million. Covid-19 revenue has finally began to wind right back, with a $20 million decrease from the same time last year. Underscoring the upside was an increase in demand across the portfolio due to the Philips recall, discussed here in our prior analysis.
Management estimate a $60–$70 million ($0.41–$0.47/share) incremental revenue benefit from the recall in Q2 FY22. Total incremental revenue obtained from the recall in FY22 is now estimated at $230–$250 million. Geographically, SaaS revenue in North and South America spiked 12% YoY whereas Europe and ex-America turnover was up ~100bps. Meanwhile, device sales increased 600bps YoY with masks and other segments up 11%.
Moving down the P&L, SG&A expenditures increased ~600bps YoY due to employee related costs and were ~21% of turnover. Covid-related expenditures continue to diminish alongside associated revenues. Meanwhile, the R&A expense gained 700bps YoY and was also 7% of turnover, up ~20bps YoY. This is expected to remain constant in FY23. GAAP operating profit therefore came in 400bps higher to $1 billion.
The company bought this down to FCF of $47 billion, down from $195 million the year prior, and declared a $0.44 final dividend bringing FCF to a $14 million loss net of dividends. As seen in Exhibit 2, these figures are down on longer-term averages
Exhibit 2. Recent FCF trends have de-rated respective to longer-term averages
Data: HB Insights, RMD SEC Filings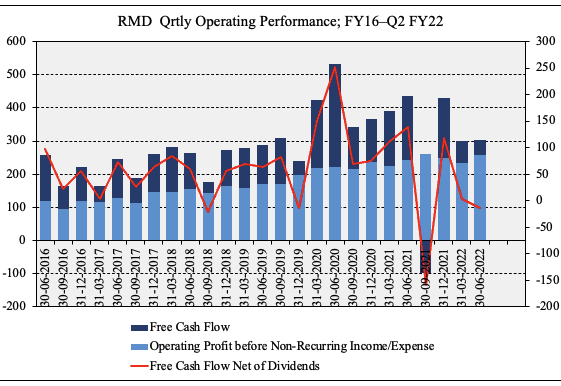
However, we argue that negative FCF is acceptable and even preferred if the company’s return on investment exceeds the cost of capital and capital is readily available. As seen in Exhibit 3, RMD’s quarterly return on investment has remained in the double-digits over the past 5-years to date. This continues to be an attractive feature in the company’s investment debate. Hence, despite the negative FCF prints, the company’s ROI of >20% far exceeds its WACC of 6.13% by 3.2 turns, and increased . Keep in mind this has occurred as the level of quarterly invested capital has increased by ~$250–$300 million on average.
Exhibit 3. Whist FCF has slipped back, RMD’s return on investment far exceeds the cost of capital and thus the negative FCF is desirable
Data: HB Insights Estimates; RMD SEC Filings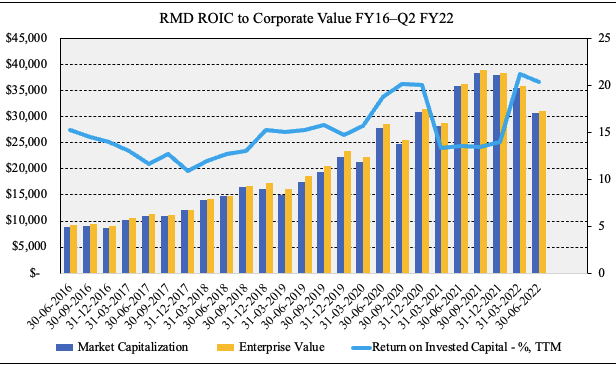
Earnings require necessary adjustments
Deeper examination of RMD’s financials reveal that several adjustments must be made in order to obtain an idea of true corporate value. Under GAAP rules R&D is expensed under OPEX and therefore impacts earnings volatility. We argue to capitalize RMD’s R&D as an intangible and amortize it as in other tangible assets instead of treating it as expenditure [IFRS rules permit the same]. R&D is, after all, a long-term investment to generate future economic value. In this vein, we had reconciled RMD’s earnings and investment piles in order to establish a more accurate picture of corporate value.
Doing so results in 32% of SG&A capitalized onto the balance sheet as intangibles. We assume an estimated life of 5 years, amortized on a straight line basis. As seen in Exhibit 4, these adjustments result in substantial differentials to stated earnings, and demonstrate the compelling value on offer with RMD. In particular, gross profit is restated at $2.06 billion whereas operating profit lifts to $1.6 billion. At the bottom line, earnings see a 99% gain to $10.55, and book value is adjusted by 17% to the upside. This has substantial impacts to valuation, as discussed below.
Exhibit 4. After necessary adjustments, we see a 99% gain in earnings and average 8.4% increase in investment from FY16–date
Data & Image: HB Insights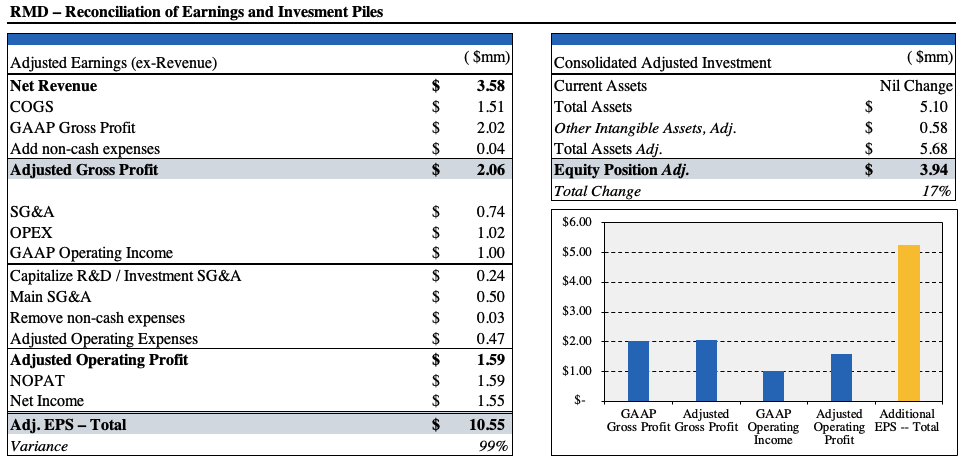
Valuation
Shares are richly priced at ~9.8x enterprise value (“EV”) to book value, implying that we’d pay ~$226 per share at that valuation. After our accounting adjustments the impact on corporate value at this level is negligible. As seen in Exhibit 5, we’d be paying ~$226 at each level, suggesting the stock could be slightly overpriced. Moreover, FCF ROE is high at nearly 40% after our adjustments, but this translates to a 2.7% FCF return on equity at the respective valuation.
Exhibit 5.
Data: HB Insights Estimates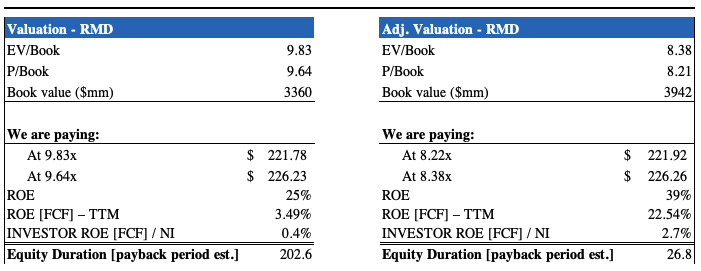
The above shows what we’d pay at the current market stipulations, based on RMD’s investment. We then need to check if it’s worth the price. Shares are trading at ~41x trailing GAAP earnings, putting RMD at a substantial premium to the sector. However, as we’ve analyzed previously, and shown in this report, we are buying a high quality business, and earnings are of a higher quality. After reconciling RMD’s earnings it generated $10.55 in EPS in our analysis, suggesting the stock is priced at ~21x adjusted P/E, a step below the GICS Industry sector’s 24x. This is compelling value by our estimate.
Moreover, the market has RMD priced at 35x forward GAAP earnings and 33x forward non-GAAP earnings. This is a 48% and 77% premium to peers respectively, suggesting investors are pricing an above-market result from RMD next year. At 33x our FY23 EPS estimates of $8.62–$11.27 [adjusted] this prices RMD at $284–$311 as an example of this.
Each of these points is conducive to suggest RMD is fairly valued and looks to unlock further upside in the periods to come. This represents compelling value and we are paying a relative $226 for this stipulated $284–$311 level of value, a 37% value gap to the upside [34% when factoring the premium to the current share price]. Rate buy on $284–311 price target.
Be the first to comment