

Liudmila Chernetska
Rent the Runway, Inc. (NASDAQ:RENT) is a U.S. e-commerce company that generates subscription revenue by renting out women’s designer items. We analyzed the company as its gross profit margin had improved from 9.8% in FY2021 to 34.3% in FY2022. To understand the drivers of its profitability increase, we analyzed its major expenses to determine its profitability outlook which includes fulfillment, Rental Product Depreciation & Revenue Share, SG&A, and R&D.
Rent the Runway, Khaveen Investments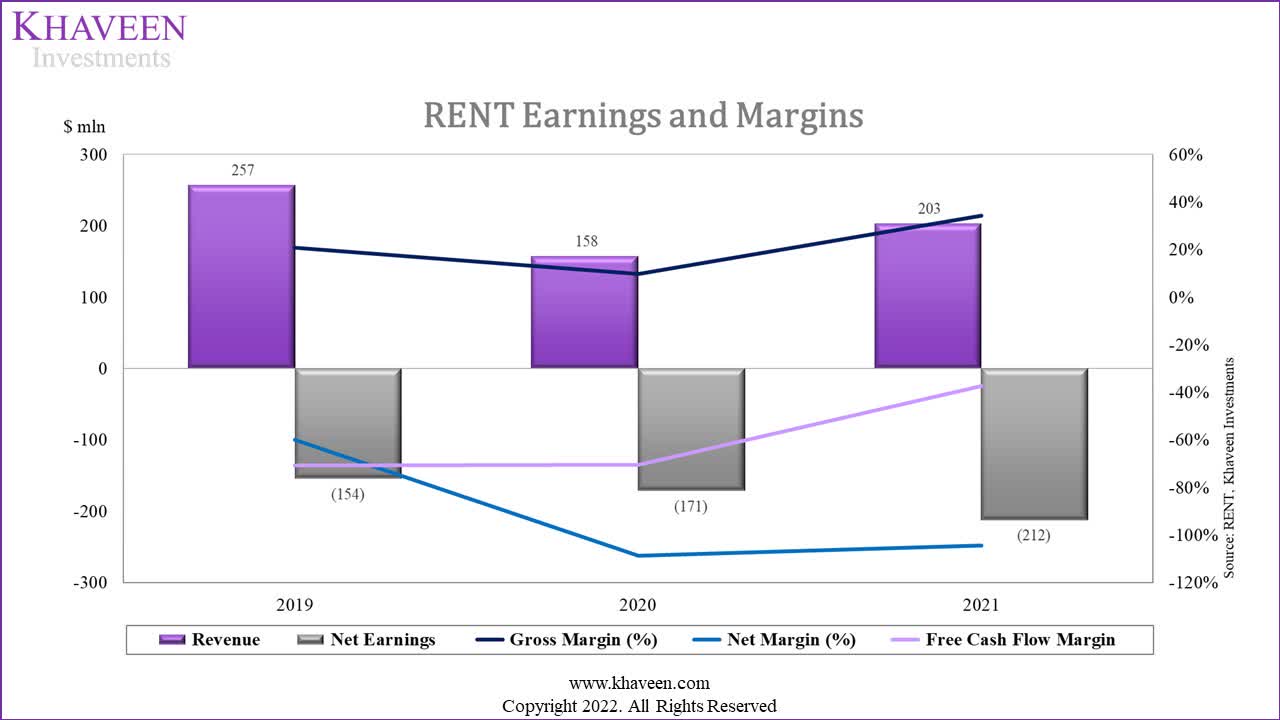
Declining Fulfillment Expense Positive for Gross Margins
|
Fulfillment Expense ($ mln) |
2019 |
2020 |
2021 |
|
Revenue |
256.9 |
157.5 |
203.3 |
|
Growth % |
-38.7% |
29.1% |
|
|
Fulfillment expense |
118.1 |
53.0 |
61.9 |
|
Growth % |
-55.1% |
16.8% |
|
|
Fulfillment expense as % of Revenue |
46.0% |
33.7% |
30.4% |
Source: Rent the Runway, Khaveen Investments
Based on the company’s annual report, its fulfillment expenses consist of
fulfillment costs to receive, process and fulfill customer orders, including fulfillment labor payroll and related costs, third-party shipping expenses, cost of packaging materials, cleaning expenses, and other fulfillment related costs.
Based on the table above, its fulfillment expense declined (55.1%) in 2020 as its revenue also declined (38.7%) before recovering back to positive growth in 2021 (16.8%) in line with its revenue growth (29.1%). In 2020, its revenue declined due to the decline of its active subscribers by 59% YoY during the pandemic.
However, its fulfillment expense as a % of revenue had continuously declined in the past 3 years from 46% in 2019 to 30.4% in 2021. As mentioned by the company’s management in its Q1 2022 earnings briefing, the company had focused on technology and automation investments which had led to a more than 30% YoY reduction in non-transportation fulfillment costs. For example, it highlighted the rollout of RFID technology on its products which allows the company to quickly scan its products compared to the past when each item had to be scanned more than 10 to 15 times with bar codes, leading to improved productivity and lower costs.
Besides that, as mentioned by the company, the at-home pickup service which is currently in the pilot phase would save on transportation costs versus the customers shipping the items back through third-party courier services. Hence, we believe its fulfillment cost which consists of third-party shipping expenses could continue to decrease due to warehouse improvements and as the company expands its at-home pick-up service to the goal of 50% coverage of its subscribers.
As a reminder, at-home pickup is not only more convenient for the consumer but also less expensive for us versus national carriers, thanks to pick up density and consolidation of inbound shipments back to our warehouses. – Jenn Hyman, Chairman, and CEO
Overall, we believe that the company’s fulfillment expenses as a % of revenue could continue to decrease with its technology and automation investments such as RFID for its logistics process and at-home pick-up service which could be positive for its gross margin growth.
Shift Towards Non-Wholesale Channel Could Further Boost Gross Margins
|
Rental Product Depreciation and Revenue Share Expense ($ mln) |
2019 |
2020 |
2021 |
|
Revenue |
256.9 |
157.5 |
203.3 |
|
Growth % |
-38.7% |
29.1% |
|
|
Rental Product Depreciation and Revenue Share expense |
85.2 |
89.0 |
71.7 |
|
Growth % |
4.5% |
-19.4% |
|
|
Rental Product Depreciation and Revenue Share expense as % of Revenue |
33.2% |
56.5% |
35.3% |
|
Gross Margin |
20.9% |
9.8% |
34.3% |
Source: Rent the Runway, Khaveen Investments
Besides fulfillment expenses, the company also incurs Rental Product Depreciation and Revenue Share which accounted for 35.3% of revenue, making it its second-largest expense behind SG&A (64.4%). The Rental Product Depreciation and Revenue Share increased in 2020 but decreased in 2021 (-19.4%) which contrasts with its revenue which had a positive growth of 29.1% in 2021.
According to the company’s management, one of the attributable factors is due to the shift of product acquisition from Wholesale mainly towards non-Wholesale, Exclusive Designs. Wholesale is where the company acquires the products from its brand partners in contrast with its Exclusive Designs channel where the company collaborates with brand partners and manufactures through third-party arrangements. As stated in the company’s annual report, the latter has an approximately 50% lower cost compared to retail.
Rent the Runway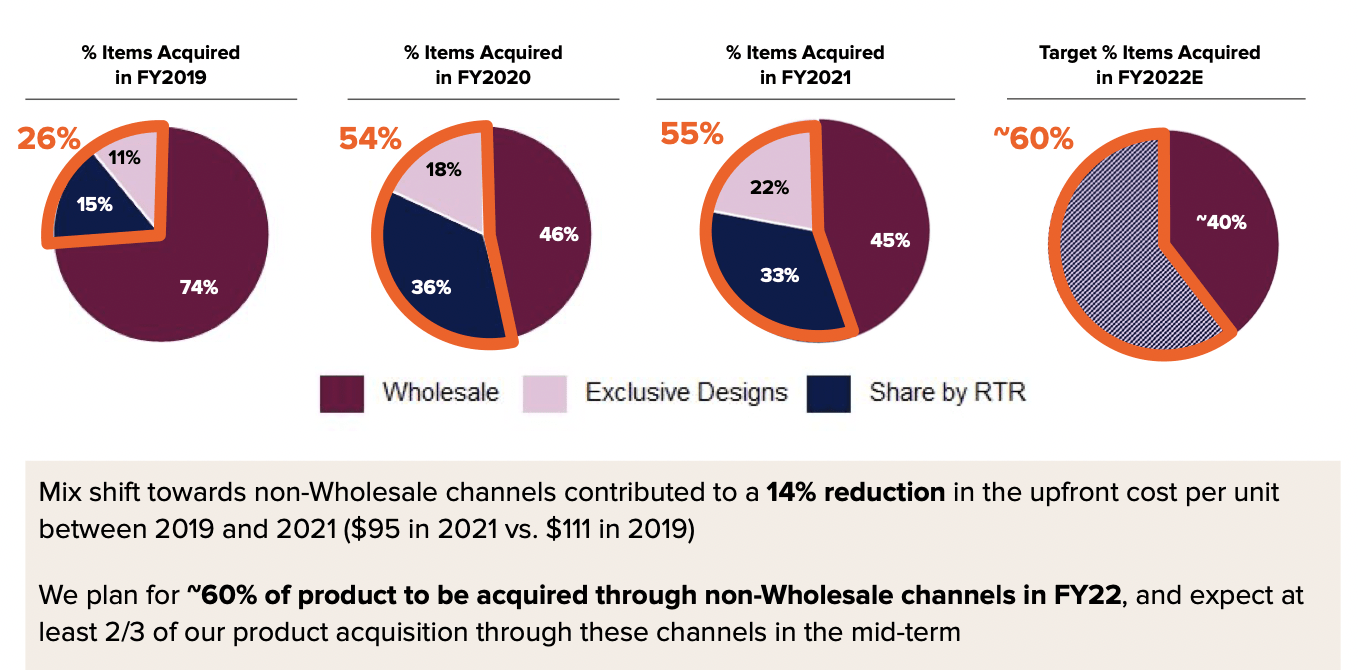
Based on the company’s presentation above of its product acquisition, its Share by RTR channel as a % of total items acquired increased in 2020 but decreased in 2021. Whereas Exclusive Designs had increased for both years but still remained the smallest channel among the other 3 channels. Overall, the % of non-wholesale channels had increased from 26% in 2019 to 55% in FY2021. This represents a shift from a 1P model toward 3P by the company which we believe could provide an opportunity for it to increase its margins by merely providing a platform connecting its merchant partners with customers without taking ownership of inventory.
From the chart, the company claimed that it had reduced upfront cost per unit by 14% from 2019 to 2021. As mentioned by the company, upfront cost per item is “total upfront spend for items acquired in a period divided by the number of items acquired” and Share by RTR has zero to low upfront cost. Currently, 45% of the product are acquired through Wholesale while 22% is through Exclusive design. However, the company targets to increase its non-wholesale channel share to 67% in the mid-term.
Hence, we believe that the Rental Product Depreciation and Revenue Share as % of revenue could continue to decline as the company increases its shift from a 1P to 3P model with a higher share of non-wholesale product acquisition as the company mentioned that it planned for its lower-cost non-wholesale channel to increase to 60% in 2022 and then 67% in the mid-term which we believe could support its gross margins growth.
Increasing Marketing Activities Threat to Margins
|
SG&A Expense ($ mln) |
2019 |
2020 |
2021 |
|
Revenue |
256.9 |
157.5 |
203.3 |
|
Growth % |
-38.7% |
29.1% |
|
|
SG&A |
121.8 |
85.3 |
130.9 |
|
Growth % |
-30.0% |
53.5% |
|
|
SG&A as % of Revenue |
47.4% |
54.2% |
64.4% |
|
R&D |
40.2 |
37.7 |
45.3 |
|
Growth % |
-6.2% |
20.2% |
|
|
R&D as % of Revenue |
16% |
24% |
22% |
|
Net Margin |
-60% |
-109% |
-104% |
Source: Rent the Runway, Khaveen Investments
The company’s SG&A expenses declined by 30% in 2020 and were in line with its revenue growth (-38.7%). Its R&D expenses also decreased in 2020 (-6.2%) but the decrease was lower as compared to its revenue decline (-38.7%). In comparison with its Rental Product Depreciation and Revenue Share expense, the company’s SG&A and R&D expenses showed an opposite growth trend. These expenses decreased in 2020 and increased in 2021 whereas Rental Product Depreciation and Revenue Share increased in 2020 but decreased in 2021. This is due to the company spending less on marketing and technology investments during the pandemic as demand decreased due to the restrictions on physical events. However, we believe the higher growth of its SG&A as compared to revenue in 2021 shows the company’s commitment to expanding its customer base through paid marketing as the company also mentioned that it had tripled its events-focused content.
Furthermore, we compared the company with its competitors based on SG&A % of Revenue and NPS to determine would Rent the Rental be able to maintain its competitiveness after increasing its SG&A and determine the company’s branding and satisfaction.
|
Competitors |
Revenue (2021) ($ mln) |
SG&A (2021) ($ mln) |
SG&A % of Revenue (2021) |
NPS |
Revenue Growth % |
|
Stitch Fix (SFIX) |
2,101.3 |
1,069.9 |
50.92% |
16 |
9.55% |
|
Poshmark (POSH) |
326.0 |
256.4 |
78.65% |
14 |
17.87% |
|
ThredUp (TDUP) |
251.8 |
240.5 |
95.51% |
20 |
39.00% |
|
Rent the Runway |
203.3 |
130.9 |
64.39% |
20 |
61.43% |
Source: Company Data, Comparably, Seeking Alpha, Khaveen Investments,
Based on the table, Rent the Runway’s SG&A as a % of revenue is lower than the average of its competitors (72.37%). Hence, we believe that Rent the Runway still has room to increase its SG&A expense while maintaining its competitiveness. In terms of NPS score, Rent the Runway has the highest NPS score among competitors and is higher compared to the industry average (17.5). Additionally, in terms of revenue growth, Rent the Runway had the highest growth rate (61.43%) among its competitors followed by ThredUp (39%). Thus, we believe this highlight Rent the Runway’s marketing and branding strength despite spending lower than its competitors as a % of revenue.
Overall, while we believe the company has strong branding and marketing compared to competitors, we expect the company’s SG&A and Technology expenses as % of revenue could continue to increase in the future as the company increases its focus on growing the company as it invests in marketing and technology for the improvement of functions on its platform (i.e., search, fit, and discovery). This is seen with its SG&A spending as a % of revenue increasing from 47.4% in 2019 to 64.4% in 2021. Thus, we expect this could weigh on its net profit margins with higher SG&A and R&D spending.
Risk: Higher Revenue Share Could Weigh on Margins
The company had not disclosed its revenue share for the Share by RTR channel. The company mentioned that the company partners with designer brands which we believe have greater bargaining power. Hence, if the brand partners request a higher revenue share, we believe this may negatively affect the company’s margin.
Verdict
To conclude, we determined that its margin improvement had been driven by lower Fulfillment and Rental Product Depreciation and Revenue Share as a % of revenue and we believe that the company’s margins could continue to improve going forward due to the factors including:
- Continues to invest in automation and technology such as RFID and its at-home pick-up service.
- The shift of product acquisition towards lower-cost non-wholesale channels.
In comparison, analyst consensus EPS growth in 2022 is 68.97% which is higher compared to the analyst consensus revenue growth of 49.85%, indicating margin growth in 2022.
However, we expect its SG&A and R&D expenses could weigh on its net margins as it continues to invest in marketing activities and platform feature enhancements. The analyst consensus price target of $10.80 represents a whopping 145% upside from its current stock price as it had contracted by 77% in the past 1 year with a P/S ratio (“TTM”) of only 0.61x.
Be the first to comment