

jetcityimage/iStock Editorial via Getty Images
I continue to find triple net REITs to be fertile ground for mispricing. The fair value is estimable in a tighter range than most equities due to the high visibility of future cashflows, and yet they trade with the same volatility of other equities.
While I reject the notion that triple net REITs are bond substitutes due to their ability to grow earnings, certain aspects of their valuation are akin to bond math. Bond investors recognize the mathematical nature of bond valuation and as a result bond pricing is often quite precise, particularly at the lower end of the risk spectrum.
A similar precision should be present in triple net REITs given the homogeneity of their businesses, but equity investors tend to be less mathematical and more story driven. Indeed, fundamental story is a better approach to valuing high growth vehicles than raw mathematical value because the future cashflows are so unknown that the story-driven CAGR of earnings is a bigger factor than a few turns of valuation.
However, with triple nets, the majority of cashflows over the next 10 years are locked in via contracts, making the fundamental story side only marginally impactful and the more mathematical cashflow valuation the much larger factor.
There are certain triple nets with whom the market has fallen in love with the story which is causing them to trade at valuations that are unjustified by cashflows. Others are perennially disliked, resulting in severe discounts to the raw cashflow value. To take advantage of this opportunity I propose a pair trade in which one goes long Spirit Realty Capital (NYSE:SRC) and short an equal dollar value of Realty Income (NYSE:O). I believe the valuation gap will narrow over time, resulting in a net gain on the pair regardless of which way the overall market moves.
This argument consists of 3 premises and a conclusion:
- SRC is demonstrably undervalued
- O is demonstrably overvalued
- They are almost indistinguishable from one another at a business level so the valuation gap is unwarranted.
Therefore, the valuation gap is unjustified and should close over time.
There is also a catalyst present in the form of rising interest rates which will aid in the closing of the value gap.
SRC is fundamentally undervalued
At its most basic level, SRC consists of 2,039 properties leased to 334 different tenants for a weighted average remaining term of 10.4 years. With annualized base rent of $623.3 million, that represents contractual revenues well over $6.5 billion after factoring in the 2.1% annual escalators.
Supplemental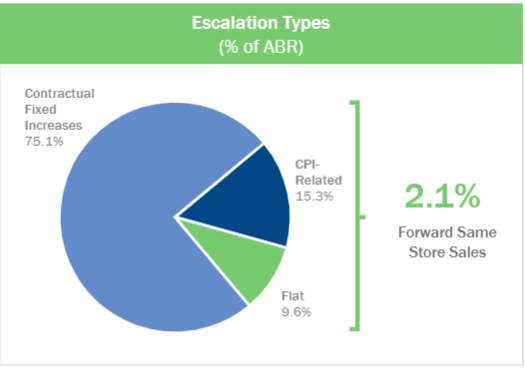
SRC operates a fairly lean business with minimal expenses. Since the leases are triple net, nearly all of the property operating costs fall on the tenants rather than the REIT. Interest expense is low as a result of an investment grade rating which granted SRC access to cheap fixed rate debt which they have locked in for the long term. In fact, the next debt maturity is in 2026.
Supplemental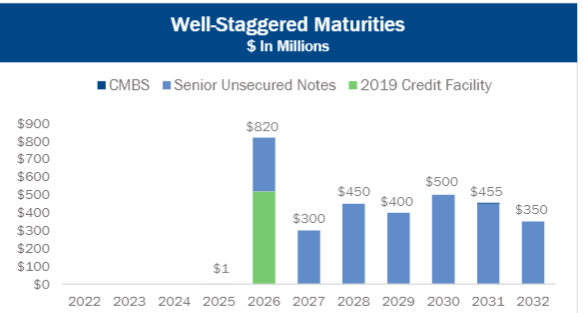
As such, a substantial portion of the contractual revenues flow through to the bottom line. 2022 AFFO is expected to be $3.55 per share which at current pricing means SRC is trading for 10.3X AFFO.
At current run-rate, AFFO would pay back the entire market capitalization of SRC over the existing contractual lease term. The general pattern with triple nets is that as leases expire most will get renewed at similar rates. It is a stable business model with long term recurring revenues. SRC’s occupancy consistently floats around 99%.
S&P Global Market Intelligence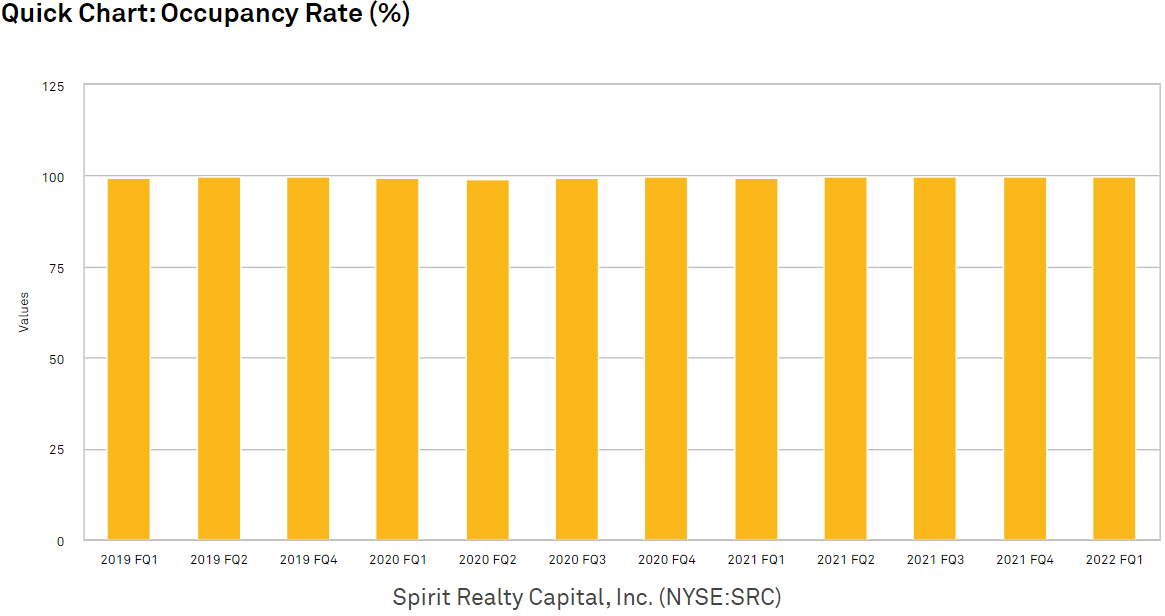
The existing business of SRC is essentially a recurring revenue stream for investors. With any recurring revenue it is a matter of how much revenue relative to the price paid. SRC got a fair deal on its recurring revenue stream when it bought its properties, but investors are getting a much better deal due to the discount at which SRC trades.
One can buy a property and get a fair economic return, or one can buy property via SRC and get a pool of properties at a 20% discount to fair value.
S&P Global Market Intelligence
Triple net single tenant retail properties can be bought at cap rates of about 6.5%, but if you buy that at a 20% discount, the cap rate to the investor is just over 8%. Via a responsible amount of corporate level debt, the cap rate to the investor is further amplified to about 10%.
That is how I view an investment in SRC at today’s price.
I am getting the quality that would typically be associated with a 6.5% cap rate, but getting a 10% cap rate due to the discount. In fact, SRC’s AFFO yield is just about 10%.
Just as the property purchased at a 6.5% cap rate would typically have escalators, SRC has escalators across its portfolio which provides a baseline of growth. This makes it a growing 10% AFFO yield with the consensus estimates shown below.
S&P Global Market Intelligence
Risk adjusted value
At present the “risk free” required rate of return for a 10 year stream of cashflows is just north of 3% as measured by the 10 year Treasury. Depending on the level of risk, investors do and should demand a higher rate of return.
SRC is an equity, thereby carrying a significantly higher level of risk than a treasury so its cashflow yield should certainly be higher than 3% at fair value, but how much higher?
Well, the average equity REIT trades at a 6.7% AFFO yield. We can use this as our starting point. From there, higher growth should trade at lower yields while higher risk should trade at higher yields.
I posit that SRC is slightly below average REIT growth and also slightly below average risk.
From a mix of rent escalators and accretive acquisitions in its $1.5 billion pipeline, SRC is on pace to grow AFFO/share about 3%-4% per year. The average REIT is growing at a pace closer to 7% per year, which would indicate that SRC should trade at a lower than normal AFFO multiple.
On the flip side, SRC is below average risk for 2 main reasons:
- SRC keeps a clean balance sheet with 33% debt to total capital resulting in an investment grade rating that puts it in the top 30% of REITs as far as the balance sheet is concerned.
- Its portfolio is highly diversified with minimal concentration to any given tenant and its tenants tend to be national brands which lends some degree of stability.
Here is SRC’s tenant roster.
Supplemental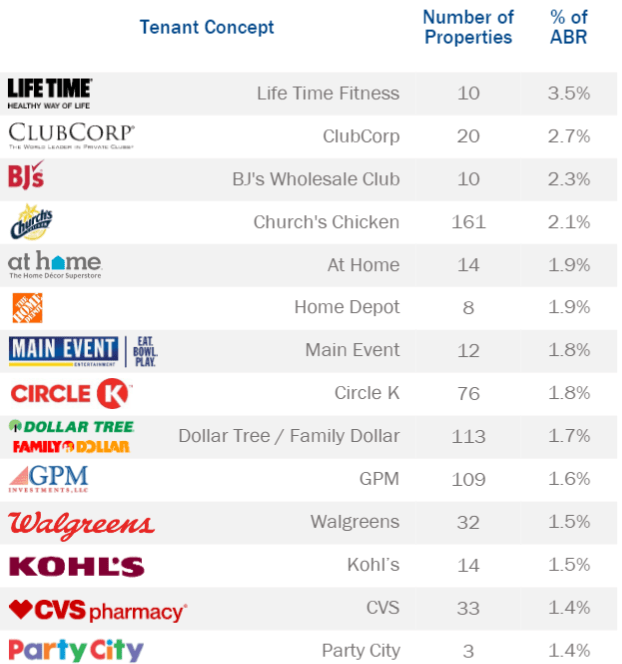
It had some minor delinquency during the pandemic, but as of now tenants are overwhelmingly paying contractual rent and I don’t see any glaring risks in their tenant list.
In my opinion, the below average growth rate is a bigger factor than the below average risk, so overall I think SRC should trade at a slightly lower AFFO multiple than the average REIT. I think 13X would be appropriate which would be a 7.7% AFFO yield.
In buying today one gets to collect the 6.7% dividend yield and potentially 30% upside as it returns to fair value around 13X AFFO.
Personally, I am playing just the long leg of this pair trade because I am bullish on REITs. I think the gap between SRC’s and O’s valuation will close almost exclusively by SRC moving up. However, the economy is in a highly uncertain place and more uncertainty is thrown in by the Fed rapidly raising rates so I can fully understand why someone might want to take a more neutral overall position.
Since O and SRC are so similar in terms of business model, an equal weighted short position in O eliminates a majority of one’s factor exposure. Such a pair trade allows one to capitalize on the closing of the valuation gap without being as exposed to market forces.
Below is my reasoning on O being relatively overvalued
O is demonstrably overpriced
Realty Income has long been a bit of a story stock in that they have successfully purveyed the concept of reliable dividend growth. O has branded itself as “the monthly dividend company” and income focused investors seem to really appreciate the monthly dividend checks.
All of that is fine and people could have done a lot worse than a long term investment in O. From a more mathematical valuation perspective, however, I’m not sure that all that branding actually adds any material fundamental value.
With a single digit dividend yield, the delta in compounding between a monthly and a quarterly dividend is minuscule, and the decades long track record of unbroken dividend growth only matters if one bought decades ago. Forward returns are based on forward AFFO so current valuation should be based on some combination of future earnings, growth and risk.
In that regard, O is very similar to SRC, just with a lower magnitude of earnings relative to market price and a smaller property portfolio relative to market price.
Just like SRC, O is buying institutional quality, single tenant, triple net properties at fair value. I would anticipate O getting similar 6.5% cap rates, but the difference comes in the investor’s realized returns. While SRC is trading at 80% of NAV, O is trading at 113% of NAV.
S&P Global Market Intelligence
Rather than amplifying cap rates it shrinks cap rates to the investor as the investor who buys O today is functionally paying $113 for every $100 of property.
O’s AFFO growth rate is quite similar to SRC’s at about 3%-4% per year.
S&P Global Market Intelligence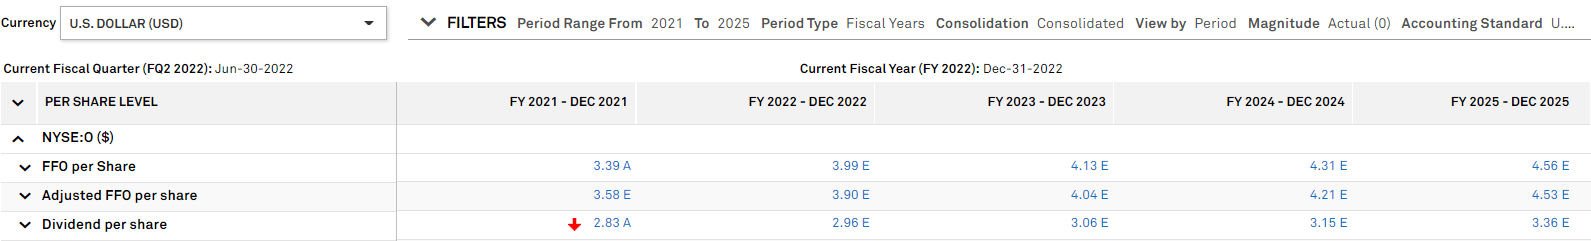
However, with O priced at $68, this is an AFFO multiple of 17.4X or an AFFO yield of 5.7%. Just as we measured SRC against the average REIT AFFO yield of 6.7% we can do the same valuation for O.
Realty Income’s growth rate is below that of the average REIT (3%-4% versus ~7%) so on that parameter it should trade at a discounted multiple. Like SRC, O is of below average risk, although I think the risk here is even lower due to 2 factors:
- O’s balance sheet is deeper into investment grade with 28.2% debt to total capital.
- With size comes stability and at a market cap of $40B, O is as sturdy as they come.
In my estimation the lower growth and lower risk approximately net out and O should trade in line with the average REIT AFFO multiple. A 15X multiple would place O at $58.50 or about 14% below current market pricing.
Catalyst to fair value
Realty Income has built such a strong reputation as a dividend aristocrat that it could potentially trade well above fair value for an extended period of time. It has a remarkably loyal shareholder base which functionally reduces the float and constrains supply of shares. It is big enough to still be liquid, but it likely helps the stock maintain a higher price.
There is, however, a catalyst in place which O has not had to contend with in a long time – interest rates.
As the Fed hikes the 10 year Treasury is likely to continue rising. With the 10 year Treasury yield over 3% and O’s dividend only 4.5%, the spread is not all that large. A couple more Fed hikes and the Treasury yield could approximate that of O.
Realty Income is fairly low risk, but I don’t see many people wanting to own it without a spread over that which is close to risk free.
With a 10% AFFO yield and a 6.7% dividend yield, SRC is not as threatened by rising Treasury yields. Even with a few more rate hikes, SRC has a very clear premium that presents a clear value proposition in exchange for taking on equity risk.
Relative value within triple net
Triple net REITs in general tend to be a great place to invest. It is just a clean business model that makes full use of the REIT structure as a tax efficient way to own real estate. The tax savings from a REIT not paying corporate taxes means there is legitimate value creation when a REIT executes a sale-leaseback with a tenant to buy their property. Rental rates are balanced such that some of that tax savings goes to the REIT and some to the tenant in terms of economic value created.
It is such a simple process and the transactions are usually widely marketed such that the majority of deals are going to take place at fair market value. This makes differentiation smaller than in other sectors as each triple net REIT largely does the same thing. Two things, however, are important when investing in the space.
- Clean balance sheets – minimizing financial distress costs is crucial to maintaining spreads on investment
- Good management aligned with shareholders.
SRC and O both pass these criteria with flying colors. O is known for its stellar corporate governance and SRC is a more recent graduate into the trusted management club.
Originally a non-traded REIT, SRC had a rough start. Non-traded REITs tend to be indiscriminate buyers of properties because they have money coming in that must be put to work immediately in order to finance the promised dividend. When it went public the portfolio had a mix of good quality properties and some junk with troubled tenants like Shop-Ko.
A few years after going public, Jackson Hsieh came in to clean it up. He spun off the bad assets and a large portion of the debt into a separate company in what was essentially excising a tumor.
To this day I think SRC’s valuation is being held back by its early weakness. The fundamentals were fully transformed into a quality institutional grade triple net REIT but the market’s trust takes longer to build. Successful elimination of the junk can be seen in how SRC handled COVID. Today it has full occupancy and higher AFFO/share than it did in 2019. That is a how a quality REIT goes through a crisis. In a few more quarters of demonstrated stability and moderate growth I believe the market will start to fully trust SRC and trade it in line with peers.
Until then an opportunity exists in the relative value. Below is a chart of P/AFFO on the Y axis and debt to total capital on the X axis.
2nd Market Capital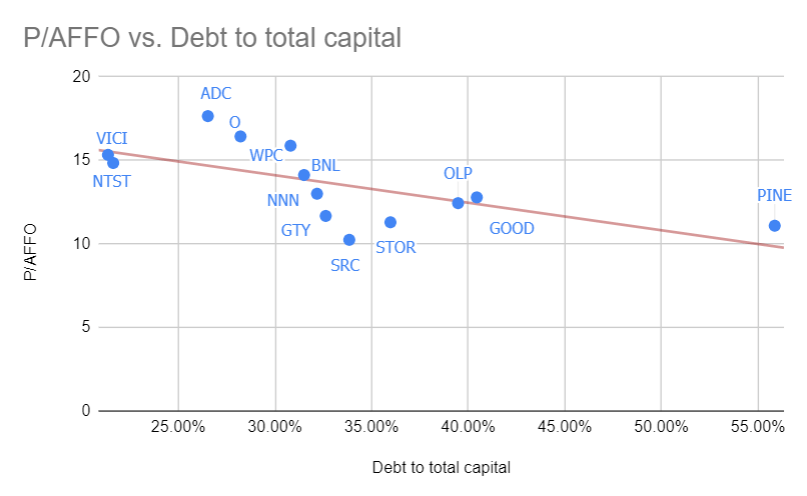
The market correctly trades higher debt load triple nets at lower multiples which forms a nice trend line.
Those trading above the line are relatively overvalued while those below the line are relatively undervalued. Some of these are in slightly different property sectors such as VICI in casinos or GOOD in industrial. O and SRC are both primarily in single tenant retail with substantial geographic overlap and tenant overlap.
I could pick a random property from one of their portfolios and even an analyst that covers the sector would have trouble telling whether it is from O or SRC.
Given the similarity I believe it is clear mispricing that there is a 6.5 turn gap between the AFFO multiples of O and SRC. At fair values that gap would only be 2 turns.
There is profit to be made in the closing of this gap. I am bullish on REITs so I am playing just the long side of it in owning SRC, but one can also isolate the valuation gap as their exposure factor by doing an equal money pair trade; long SRC and short O.
The pair trade has positive carry of 2.2% as SRC’s dividend is higher and the AFFO carry is greater at 3.2% as SRC’s payout ratio is lower. Higher cashflows fuel both more dividends and more reinvestment in properties.
Risks
Individually, the primary risks to investing in these companies would be one or more tenants defaulting on a lease. As a pair trade, however, a significant portion of this risk is mitigated because the tenant rosters are similar. Keep an eye out for any events that would impact one of the legs of the trade more than the other.
Be the first to comment