


Nikolay Yeltsov/iStock via Getty Images
Produced by Ryan Wilday with Avi Gilburt and Jason Appel.
Bitcoin on the Edge
Investors in high beta assets have had a difficult 2022, whether they are in growth stocks, speculative tech stocks, or cryptocurrencies. But if you have followed Jason’s work and mine, you know that the strong downtrend in cryptocurrencies was no surprise.
In Bitcoin: Detour on the Moonpath, Jason discussed levels which, if broken, should take Bitcoin down to $24K. All of those levels have been breached during this very bearish year. While we were looking down for most of 2022, we would rather have seen $24K hold.
The break of $24K in mid June leaves us with one last support level in Bitcoin. This level is $16K. If that level breaks and Bitcoin sustains below it, we expect this downtrend, now nearly a year long, to turn into a multi-year bear market. We’re not calling for that now, but we’re watching for the possibility. While we’re still looking for $100K one day, breaking $16K will likely delay it for years.
Mining Trouble
The pain we’ve seen in Bitcoin is commensurate with past bearish moves. The 75% drop, peak to trough, is roughly in the middle of the road among other year-long Bitcoin corrections. However, this move down has damaged many miners, potentially ending their bullish cycle.
Over the last year, I have spoken out of both sides of my mouth about Bitcoin miners. On one hand, in Be Careful with Bitcoin Miners, I warned about the particular challenges of mining Bitcoin as a business. As Bitcoin prices rise, more want to mine the coin. Bitcoin has a mechanism called “difficulty” that increases competition to mine Bitcoin as more hash power is applied.
This creates a phenomenon that is unique in production-oriented businesses: Production costs rise with product prices, diluting margins. But the troubles with Bitcoin miners didn’t end there. As Bitcoin fell over the past year, difficulty continued to climb. Revenue dropped while the costs for Bitcoins mined increased, a perfect storm.
I included bullish charts in that article, alongside the warning, because the market was poised bullishly at the time. Bitcoin miners rallied for another 6–7 months after the article was published. And as Bitcoin continued to be rangebound for a year, most miners appeared to want to hold a large flat wave four, just as Bitcoin was forming. Unfortunately, in the last two months, we’ve seen many of these stocks break support catastrophically. By and large, we now have very low expectations of them.
When we give support regions on a chart, we take them very seriously in our own trading. To trade successfully for additional income, or to grow the balance sheet, or to make a living, one must take risk very seriously. The Elliott Wave theory can give us some predictive power with markets, but it excels even more as a risk–reward measure.
Support regions are great places to start or add to a trade because the stop is close by. Risk is minimal and reward is highest in support regions. While broken supports can sometimes leave us with a second level of support, in the miner charts below we have no reliable levels left. This means that when key levels broke Jason and I either stopped out or cut our positions to speculative levels. Speaking personally of my own portfolio, I still own the stocks in this article, however, the position size was quickly made a remnant of their formal selves. I keep just to track in case of a rebound, not enough to cause real pain.
Such events happen many times in one’s trading life. We cut the pain short.
In the charts below, which we’ve reviewed over the last year, I show where the last support sat before the break. As you can see, support regions were slaughtered. It’s reasonable to expect these stocks to rally along with Bitcoin if it rises from this region. However, the breakdown we’ve seen in these stocks leaves us unable to maintain the expectation for new all-time highs in this cycle. This will remain our perspective even if Bitcoin reaches prices of over $100K.
Riot Blockchain (RIOT)
In my article “Be Careful with Bitcoin Miners,” I identified key support in RIOT at $14. It decisively breached that level in March 2022, after flirting with it for several months. We cut there, and discontinued coverage in Crypto Waves at that breach. Now it’s down another 66%.

RIOT (Created with Motivewave Software)
Marathon Digital Holdings (MARA)
I didn’t mention support in Marathon Mining in my previous article because it was pulling away into the 2021 highs. However, in that article I showed a blue box at the bottom of that chart where support resided, at $8.42. That has now broken decisively. I have kept the potential of a high near $100 (the yellow box on my chart) which does correspond to Bitcoin putting in a fifth over $100K. However, the nominal breach of support gives that fifth wave a very low probability.

MARA (created with Motivewave software)
HIVE Blockchain Technologies (HIVE)
I don’t recall covering HIVE in previous articles, but it’s a chart we have covered in Crypto Waves and a market favorite. Its split-adjusted support was at $3.90, which was broken in May.
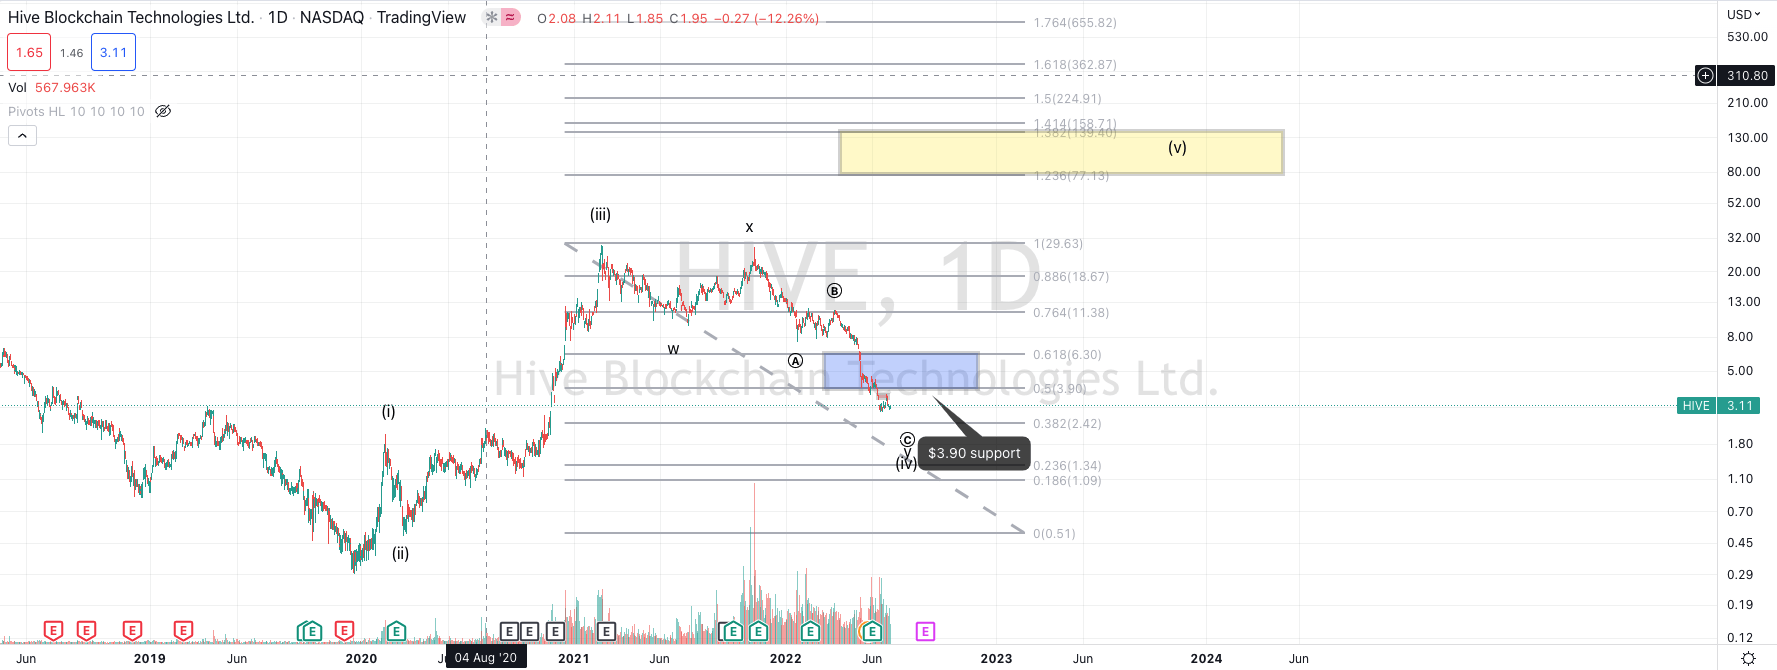
HIVE (created at Tradingview.com)
As these charts have continued to break support, bad news piled on. As mentioned, these companies struggled under the weight of lower Bitcoin prices and higher network difficulty. Also, in the last few weeks we’ve had news of Bitcoin liquidation by many miners to cover the cost of operations. Should recent action in Bitcoin result in an important bottom, that’s the saddest news of all. Those that sold are now handicapped by that lost Bitcoin, hampering their return in a coming rally. This is behavior akin to retailers selling at the bottom.
There’s Good News?
There’s one remaining mining chart that may have retained a bullish outlook. Yes, only one. That chart is Argo (ARB on the London Stock Exchange, ARBK on the Nasdaq). I’m going to consider an article on that chart in the future, but I want to see how the recent action develops over the coming month.
Voyager Digital
On a side note, I want to highlight the Voyager chart. To my own detriment, I have called it the prettiest chart in crypto. I hope you understand from the body of this article how important objective support levels are to us. “Pretty” is a subjective term, and levels are objective. Voyager’s break of support also was catastrophic. In Making Profit with Crypto Exchange Stocks I called out support at $5 Canadian. When it broke, we notified subscribers in Crypto Waves that we were cutting our position. Of course, that scaling back saved us from the drop below $1. Later, news came out that Voyager had exposed user funds to the now insolvent 3AC crypto hedge fund. We didn’t know that when support broke, but took action anyway. Finally, today, July 6, we heard that Voyager aims to restructure so that all common shareholders are left with no equity.
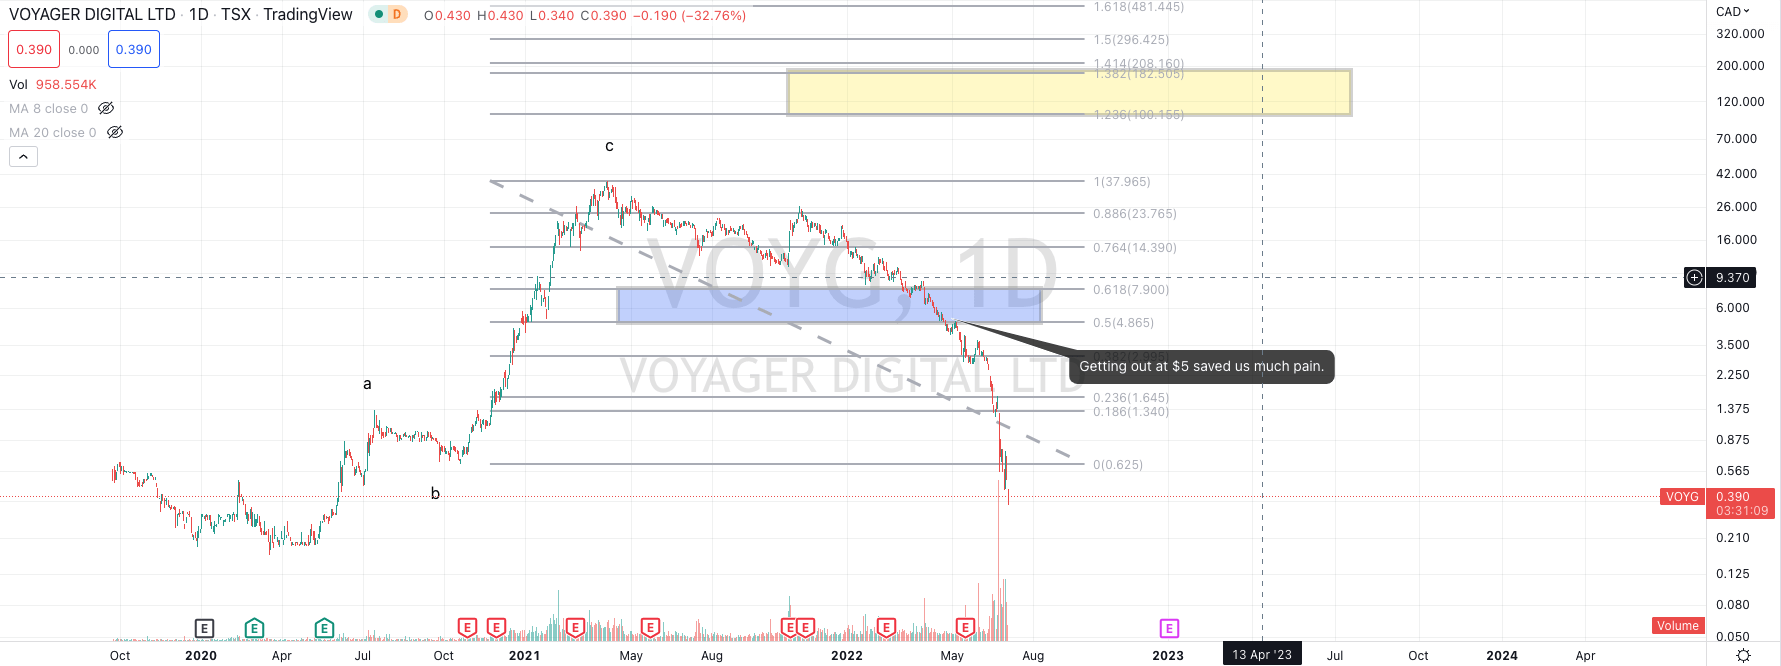
VOYG (created at Tradingview.com)
Conclusion
We’re cautiously bullish regarding Bitcoin, provided $16K holds. However, this bullish perspective does not extend to Bitcoin miner charts. We do expect them to rally with Bitcoin, but we have lost what we need in the charts to give us solid and objective measures of risk and reward. I also wanted to use the rough action over the last year to highlight how important these levels can prove to be. Obviously, we want our pivots to hold. But markets are a game of probabilities, not certainties, and so risk management must come first.
Be the first to comment