

Canadian Stocks in the Toronto Stock Exchange Recommendations Christoph Burgstedt/iStock via Getty Images
As a Canadian analyst, I am thrilled to see Seeking Alpha extend their coverage to Canadian securities. There are a few factor styles and themes that have worked very well in Canada over the past 20 years. The company, Guardian Capital Group Limited (TSX:GCG:CA) (OTCPK:GRCGF) (‘GCG’), ranks high in a couple of areas that have been historically linked to higher-than-average returns in Canadian markets. Because of this, I am recommending inclusion of this stock in a Canadian themed portfolio.
A Few Ground Rules
Before I begin, I want to lay out a few ground rules.
- First, I will only be testing stocks within the Toronto Stock Exchange.
- Second, a stock must have at least an average of $100,000 CAD of dollar-volume per day. Thinly traded stocks are excluded.
- Third, the stocks that pass this screen will be held equal-weight and will constitute my benchmark.
portfolio123.com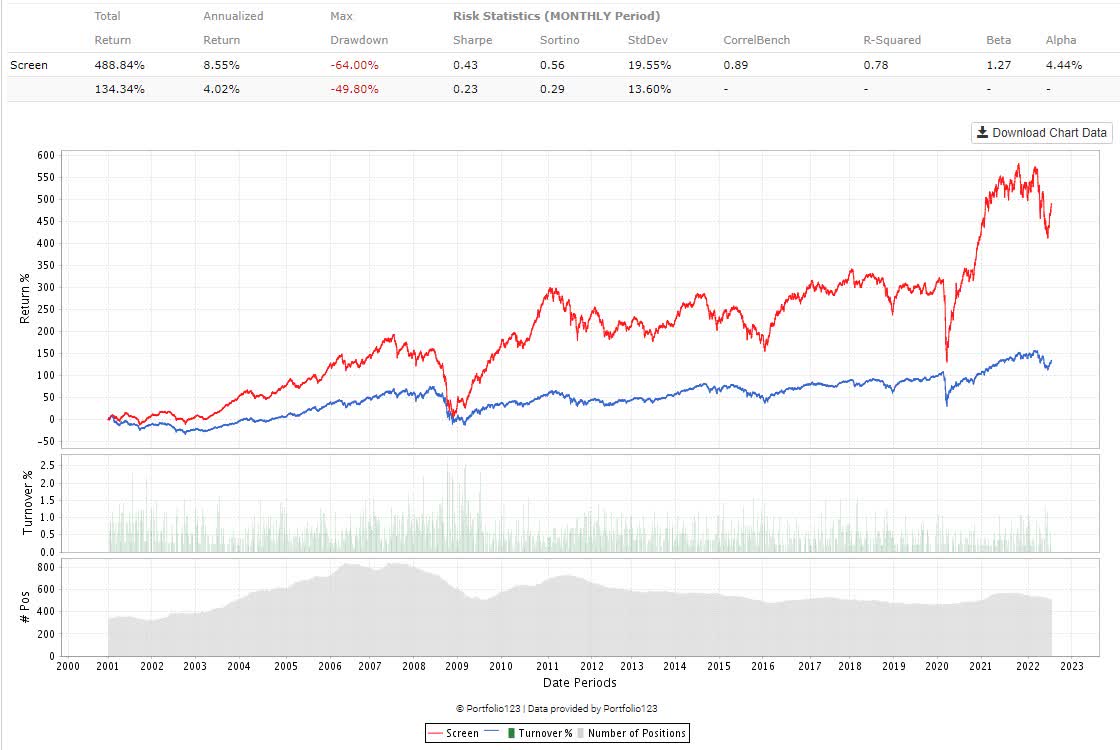
Chart compliments of Portfolio123.com
Since 2001, this group of semi-liquid TSX stocks has returned 8.55% annually (red line). The cap-weighted return of all stocks in the TSX is less than half of that (blue line).
Condition 1: Positive Free Cash Flow
Stocks with positive free cash flow perform much better on average than those with negative free cash flow. If a company spends more on expenses than what it brings in, there is negative free cash flow. Sometimes there are good reasons why free cash flow will be temporarily negative. Cashflows are lumpier than earnings. Large capital expenditures can make negative FCF for a period of time. But in general, companies with ongoing negative free cash flows will have more financial stress and chronic underperformance than those with positive cash flows.
The chart below shows the free cash flow of Guardian Capital Group.
YCharts.com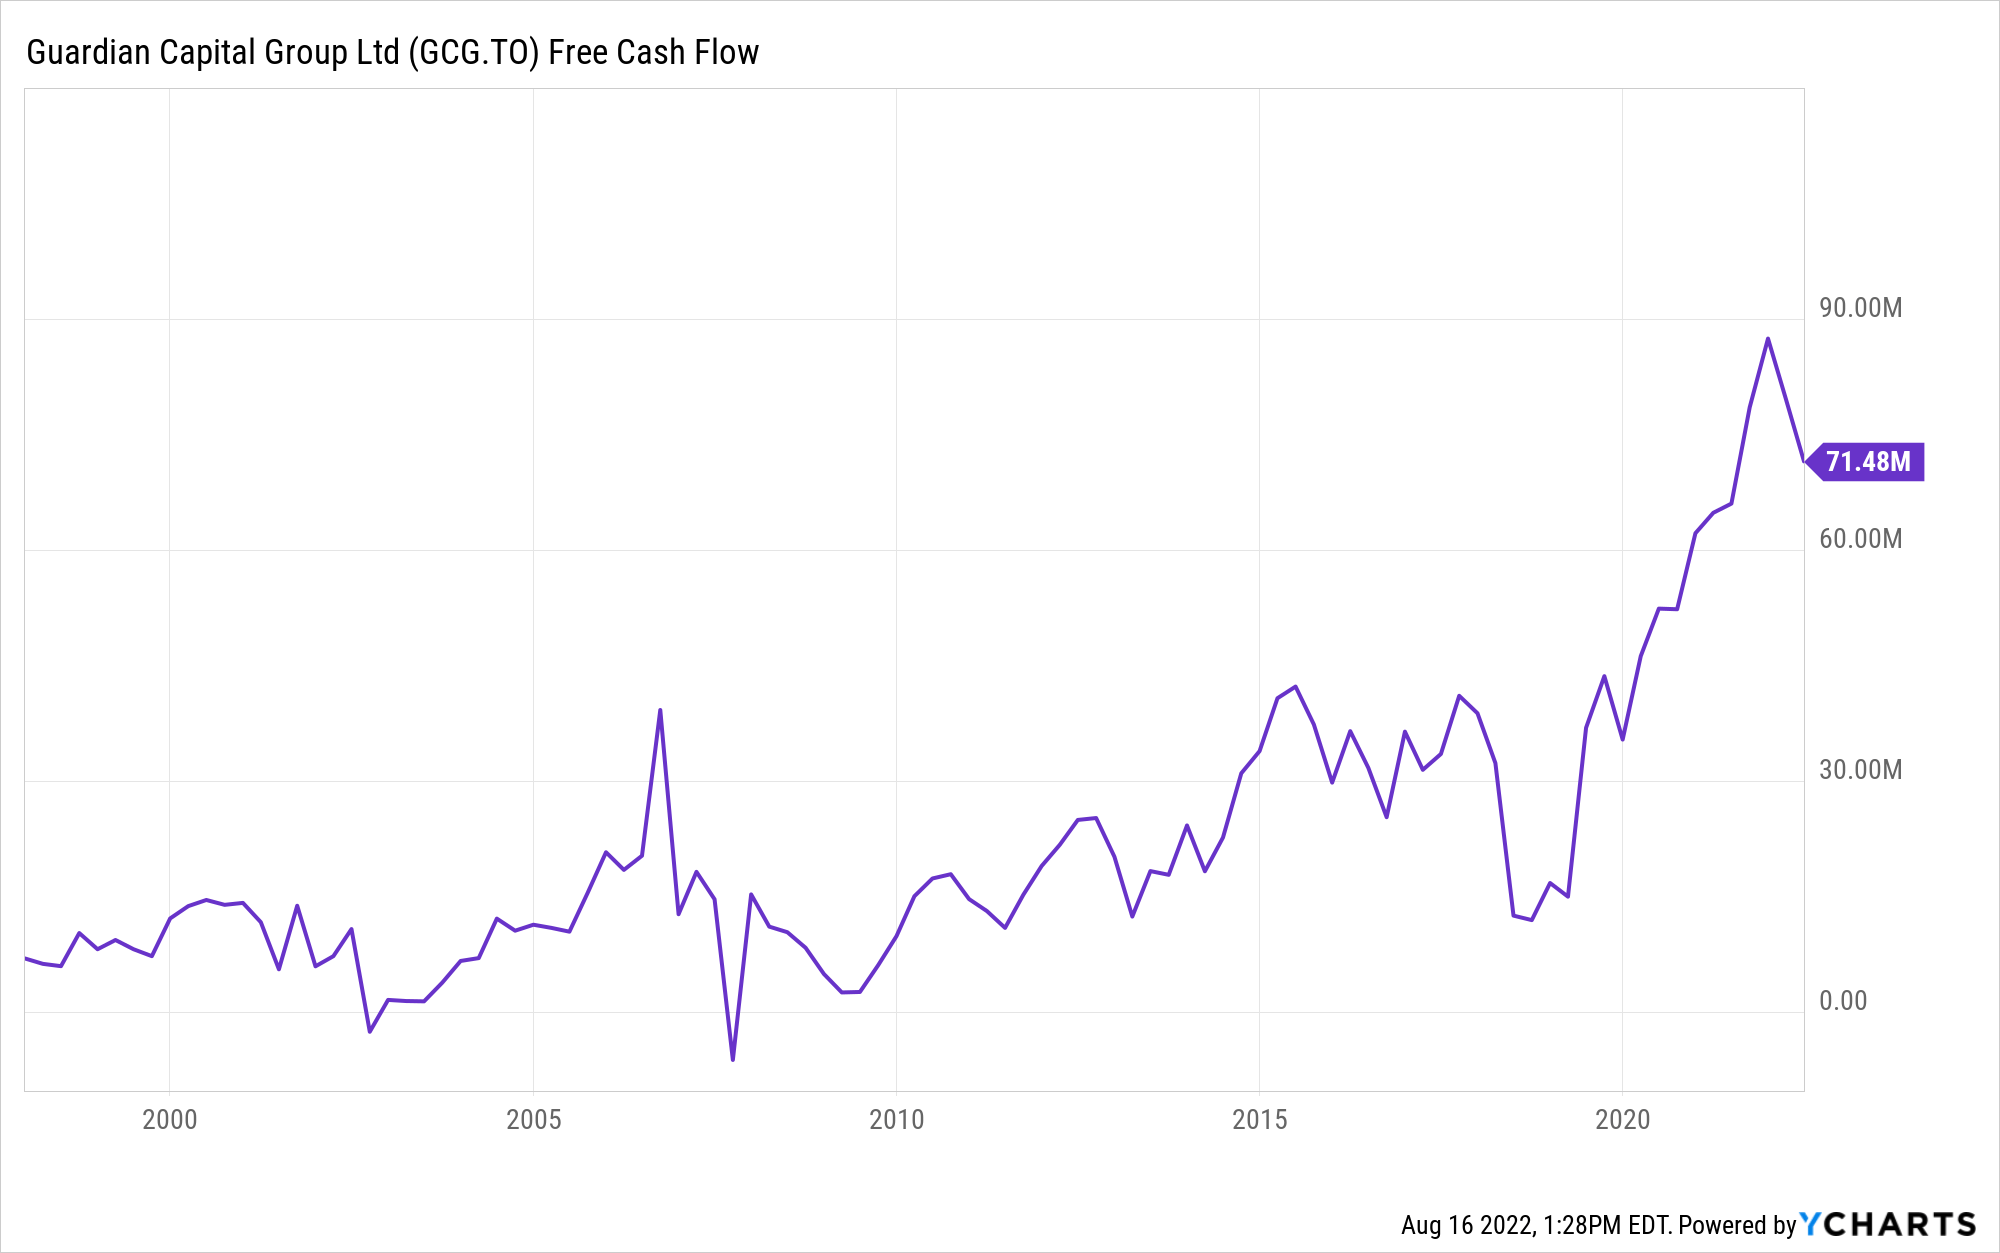
Chart compliments of YCharts.com
To keep it simple, I remove companies that have negative free cash flow over the trailing 12 months. In my semi-liquid TSX universe, stocks which have negative free cash flow have produced an average of 2.9% annual return since 2001 as opposed to 14.4% annual return for stocks which have positive free cash flow.
There will always be exceptions to the rule, but I cannot think of a single criterion more important in Canadian stocks than this one. It is an incredibly simple rule you can apply today to position yourself for much higher returns.
Condition 2: Moderately Low Volatility
Probably the second most important aspect I look for in Canadian stocks is volatility. The chart below compares the BMO Low Volatility ETF (ZLB:CA) versus the TSX Index ETF (XIC:CA) over the past 10 years. The low volatility ETF has roughly double the return.
YCharts.com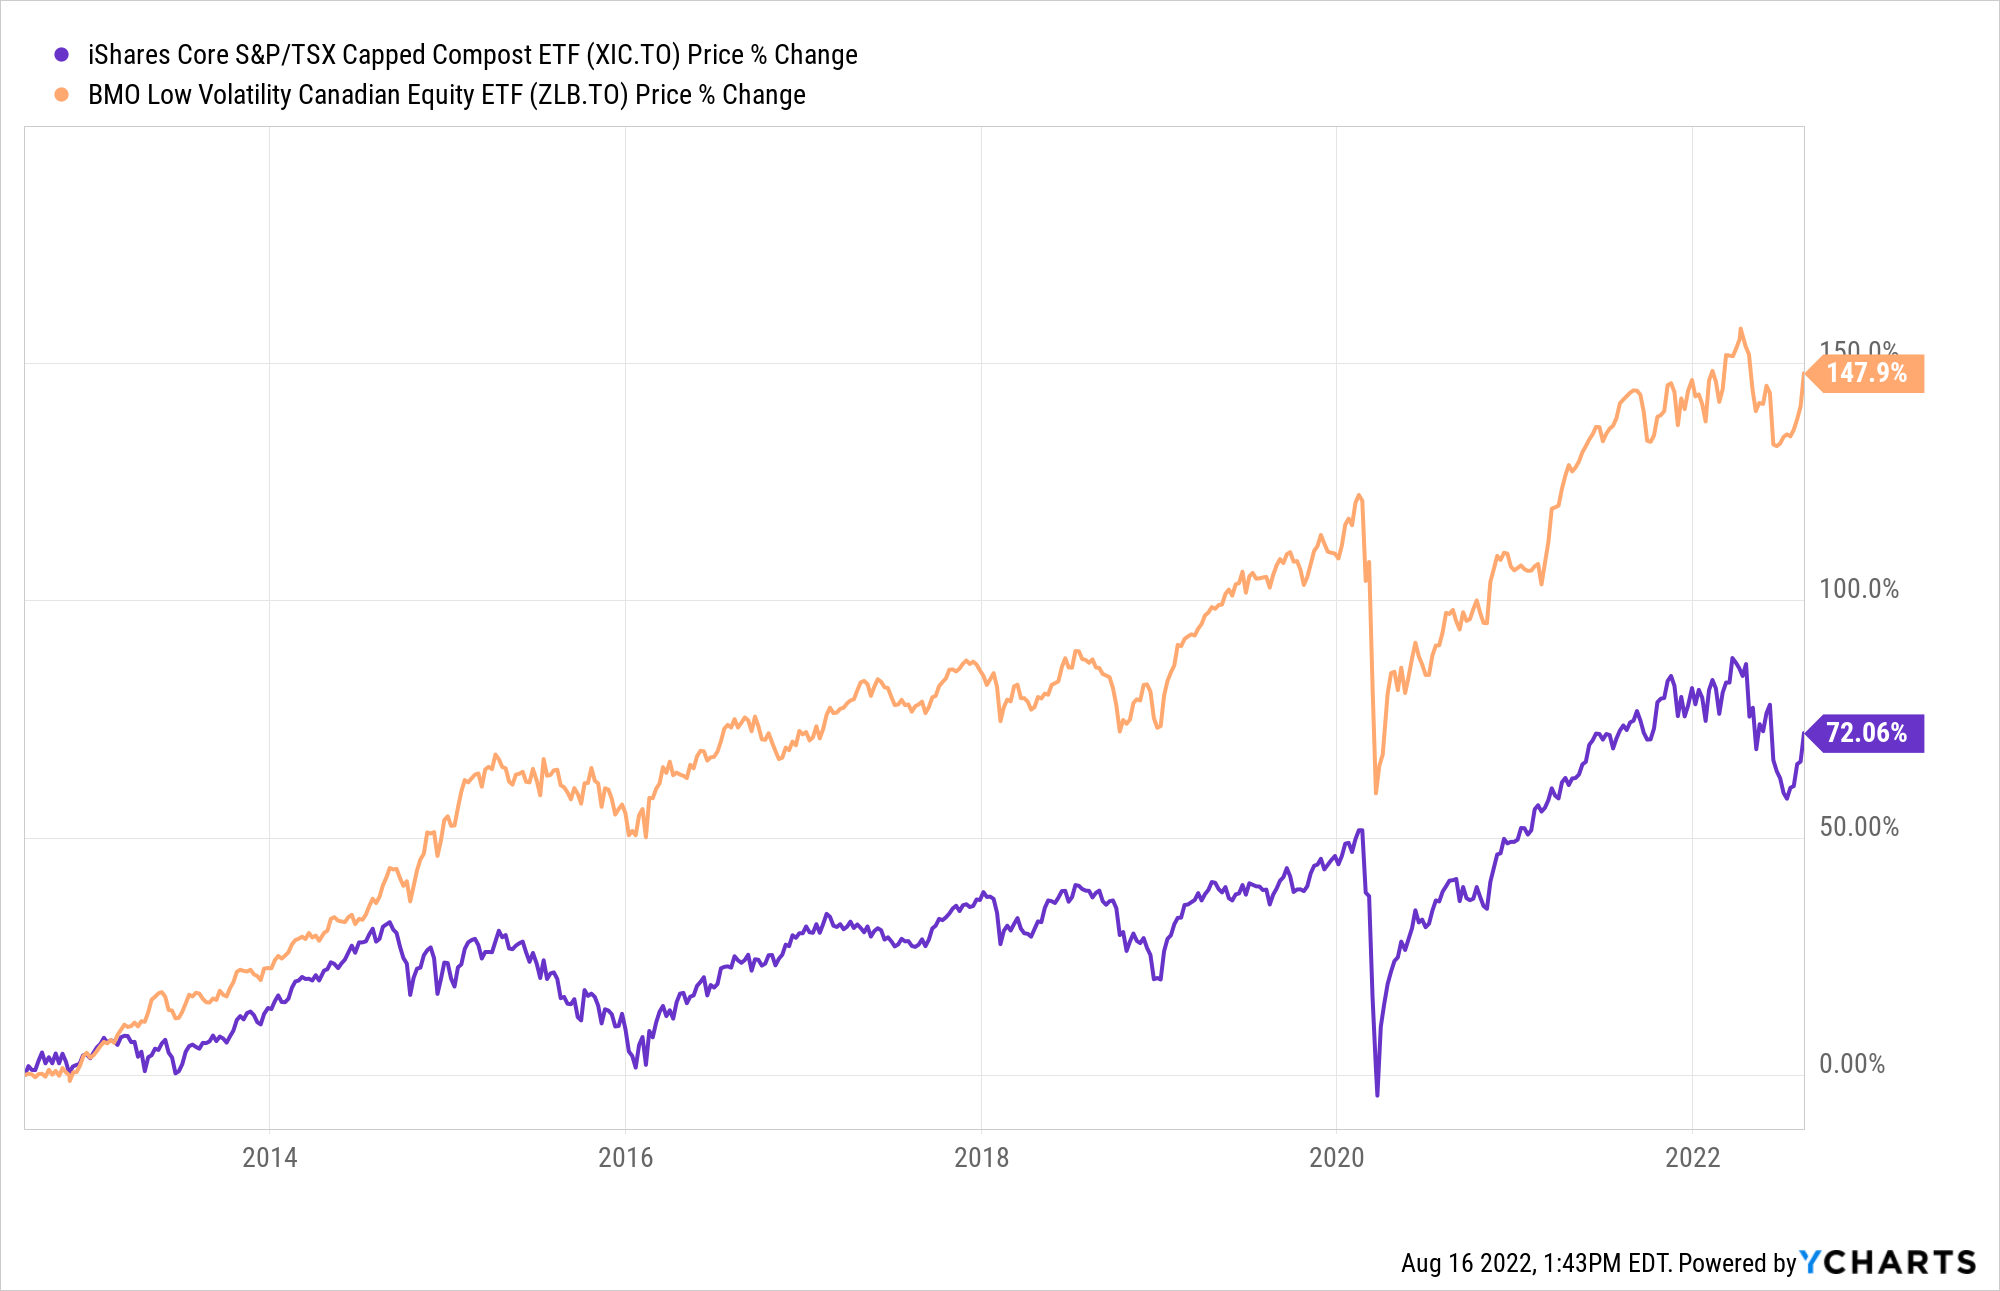
Chart compliments of YCharts.com
If I were to split my universe of stocks into 2 equal groups based on volatility (higher and lower volatility), the returns would look like this. The chart assumes that $100 was invested in 2001. The low volatility group has $1,300 today, whereas the higher volatility group has roughly $200.
portfolio123.com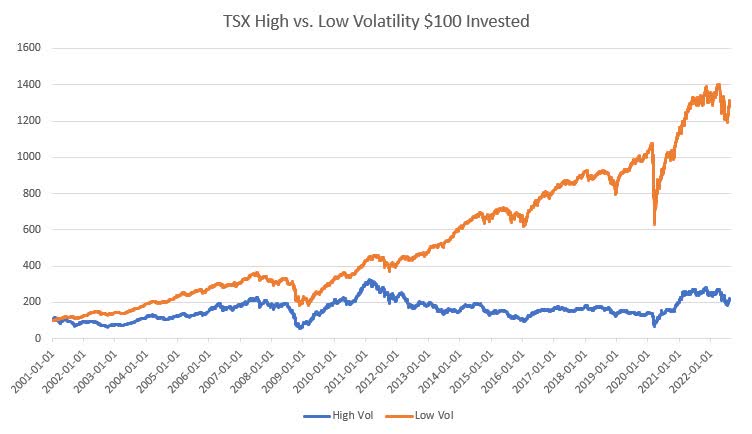
Data compliments of Portfolio123.com
But having the lowest possible volatility doesn’t necessarily mean you will have the highest possible returns. This is where it is important to understand how each factor or style works. In the following test, I separate my universe of Canadian stocks into 10 portfolios based on volatility. Each bar in the diagram represents annualized portfolio returns since 2001.
portfolio123.com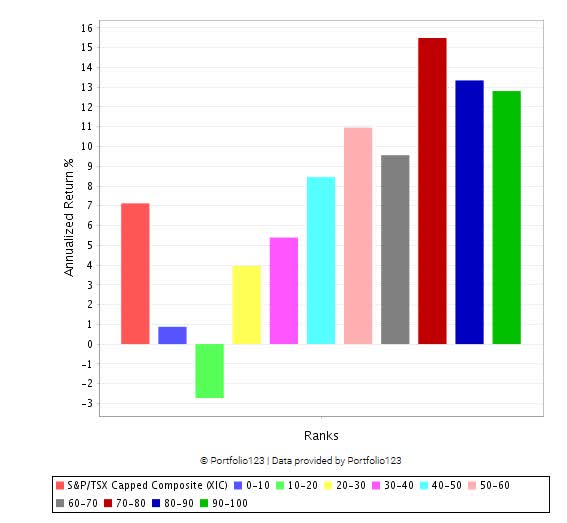
Chart compliments of Portfolio123.com
The bar furthest to the left is the index (red). The next bar (which is blue) has less than 1% average annual return (since 2001). This is the highest volatility portfolio. The bar on the far right (green) shows the average annual return of the lowest volatility portfolio, which is roughly 13%. Although portfolio returns increase as volatility decreases – the lowest possible volatility does not necessarily mean the absolute highest return. This is where common sense comes in.
- For this rule, I prefer to simply remove the bottom 50% of stocks with the highest volatility.
Over the past 12 years, Guardian Capital Group has consistently been in the best 25% of low volatility stocks in my Canadian universe. It currently sits near the top 10% of investable Canadian stocks. It definitely makes the grade with flying colors.
Value and Profitability
Value and profitability is a third area that has a strong correlation to returns in Canadian markets. Some of the highest returns in the Canadian markets come from deep-value stocks. In this regard, Guardian Capital Group comes up short.
YCharts ranks the value of Guardian Capital Group 4 out of 10. It isn’t terrible, but it isn’t great. This is the one area that I wish Guardian Capital Group was higher in. If it had better value, I would give this a very strong recommendation instead of a moderate recommendation.
YCharts.com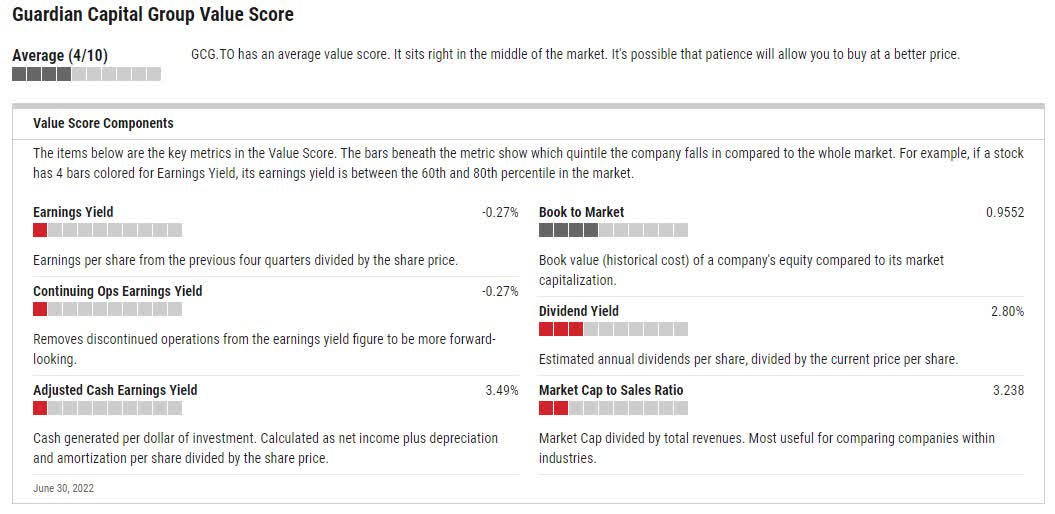
Chart Compliments of YCharts.com
Final Thoughts
I moderately recommend adding Guardian Capital Group Limited to a Canadian themed portfolio. I make my recommendation based primarily on the company’s free cash flow and low volatility. Although the company doesn’t have deep value, neither is it at the top of the valuation chart.
Be the first to comment