

da-kuk
The iShares S&P India Nifty Fifty Index ETF (NASDAQ:INDY), a product that focuses on 50 of the largest stocks in India has enjoyed quite a decent year, all things considered; whilst the benchmark emerging markets ETF – EEM has witnessed negative returns of mid-teens, INDY has proven to be a lot more resilient, only sliding by mid-single-digit levels.
YCharts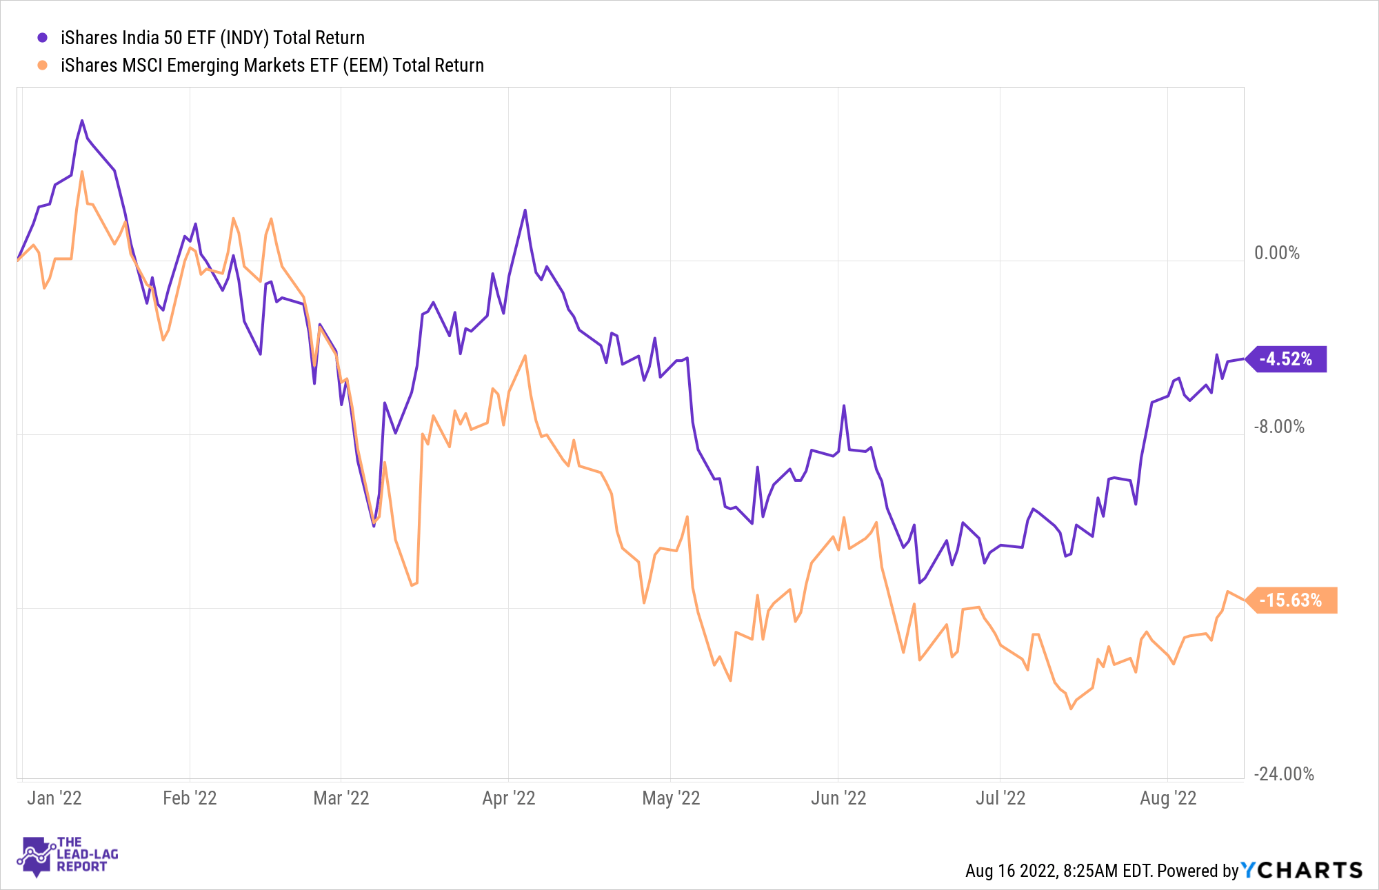
INDY – Yes or No?
One of the fundamental reasons why INDY has held up reasonably well is due to the favorable growth landscape of its focus market.
Twitter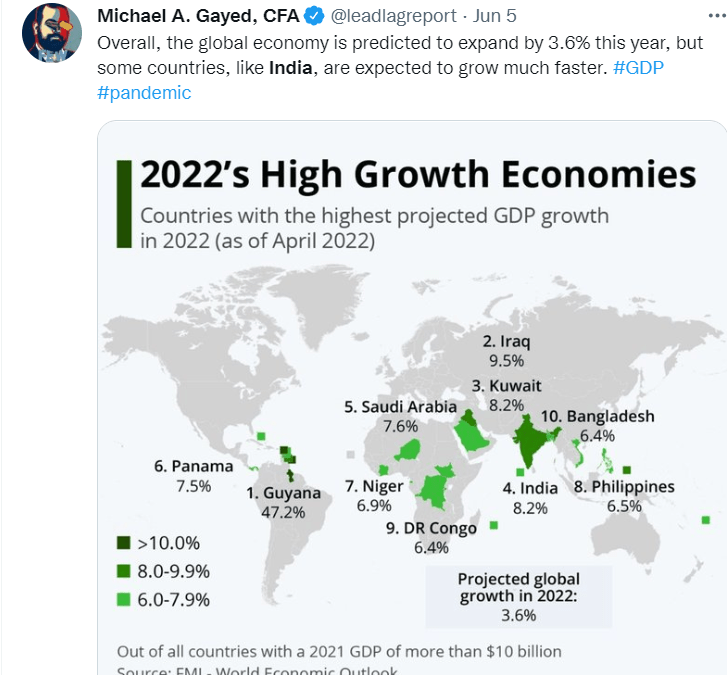
A couple of months back, I put out a tweet on the timeline of The Lead-Lag Report highlighting how India was expected to grow by more than 2x the projected global growth; whilst those numbers will likely be scaled down for both the regions in question, the growth differential is still quite substantial.
When your growth panorama is just larger, it puts these companies in a better spot to deliver superior earnings. Indeed, according to YCharts estimates, INDY’s constituents are expected to deliver weighted average earnings growth of 55%; conversely, the broad EM basket, in general, will likely only deliver a figure at roughly half those levels at around 27%.
The other important facet to consider is the dominance of banks in this portfolio, currently accounting for around 36% of INDY. It’s fair to say that conditions have been relatively solid for this segment; firstly, consider the ferocity with which annual loan growth has picked up in recent months; at the start of the year, aggregate loan growth was only coming in at the high-single-digit levels, but lately, it has been hitting levels of close to 15%.
Trading Economics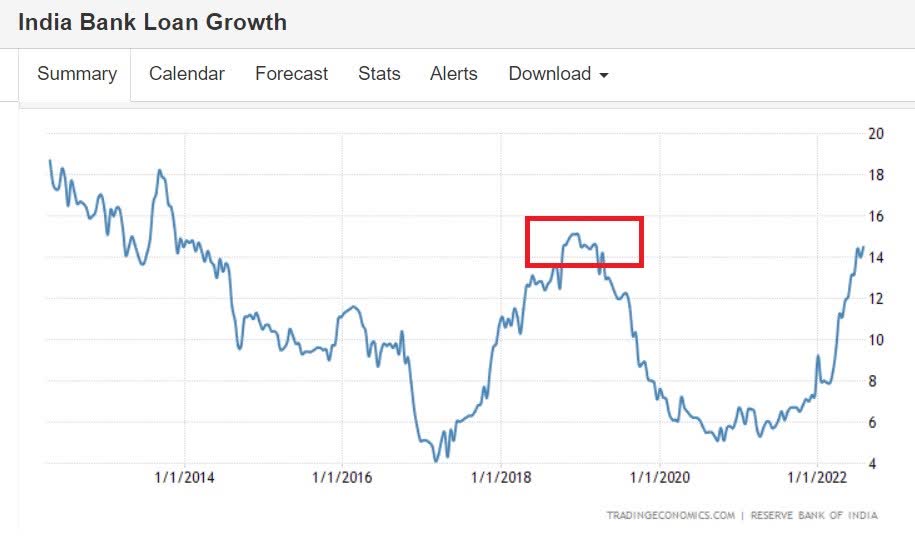
So far so good, but investors ought to be a little wary considering that the loan growth momentum is now approaching the 2019 peak levels of just below 15%. Could we see a reversal from here, or is there still ample fuel in the tank?
Well, one segment which could continue to remain buoyant is the credit card segment, where things appear to have come back in favor after a 2-year lull. Recent data from RBI shows that outstanding credit cards in force have grown by 10% on a YTD basis, and in recent months, it has been growing at 23% annual growth.
BQ Prime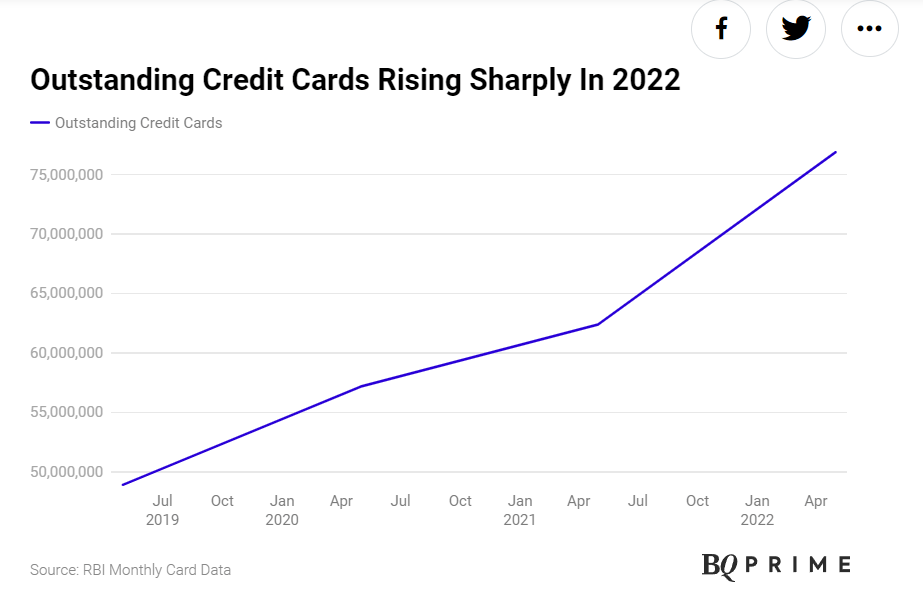
What’s also interesting is that 3 out of INDY’s top 7 stocks (HDFC Bank, ICICI Bank, and Kotak Mahindra Bank) also account for a lion’s share of the outstanding credit card balances.
BQ Prime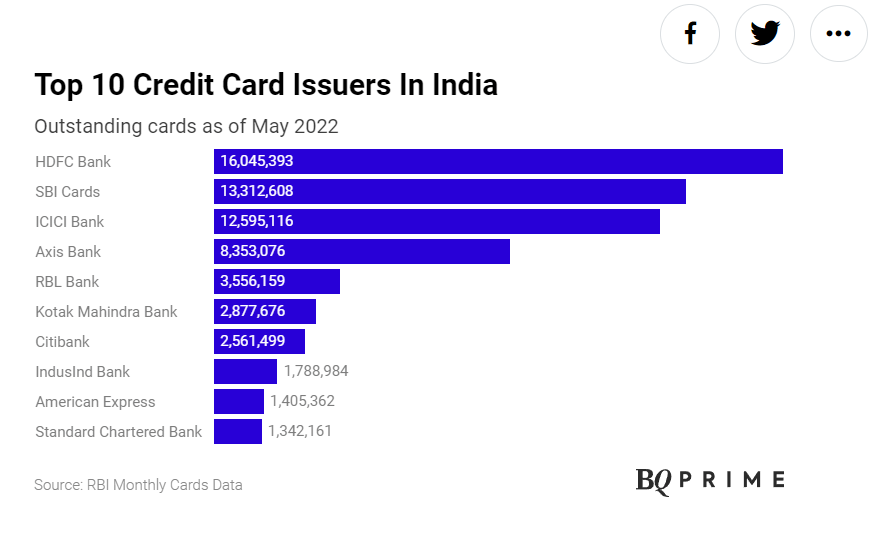
What’s emboldened the recent frenzy in credit cards is that underwriting standards have gone up a notch, backed by advanced customer analytics that was inadequate during the previous downturn.
Needless to say, growth in the credit card portfolio should do a world of good for the net interest margins of these banks as unsecured loans are availed at some of the priciest rates around.
Speaking of rates, note that the Indian central bank recently hiked its benchmark rate by 50bps, and it doesn’t look like it will be the end of it, as inflation is likely to be above the RBI’s comfort band for the foreseeable future; indeed expectations are that things will only normalize and come to the comfort band by the March quarter or so.
I think the INR could do with a somewhat aggressive stance given what a difficult year it has faced this year where it dropped to record lows.
Twitter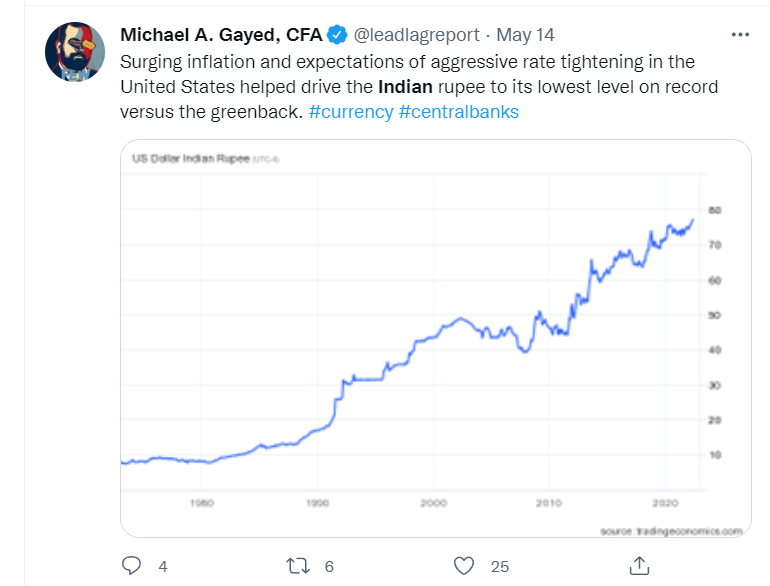
India is noted to be a chief culprit in importing high levels of inflation, given its reliance on energy imports. Do consider that, in recent months, the monthly import bill has been at record highs and hovering close to the $70bn mark.
TradingView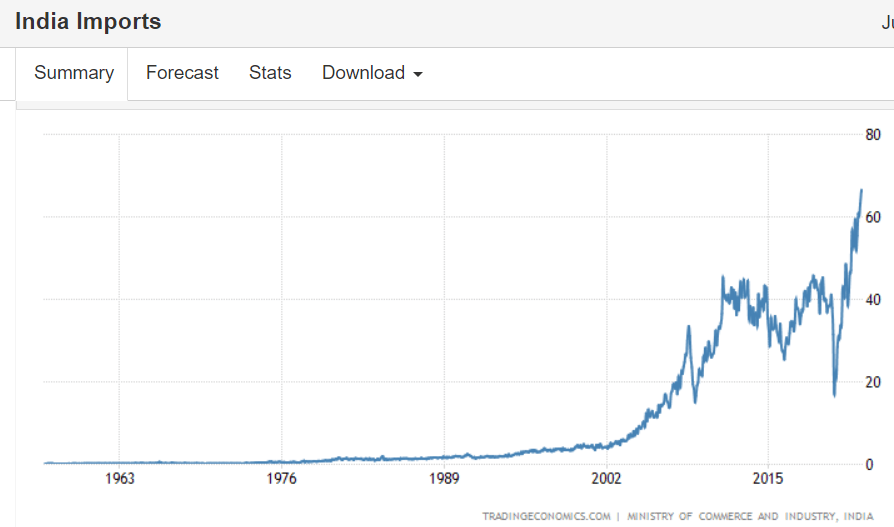
The RBI’s desire to not switch to an accommodative stance should help arrest the weakness in the INR and bring some capital flows back to the markets. This also coincides with the weakness seen on the dollar front. As highlighted in the ‘Leaders-Laggers’ section of this week’s Lead-Lag Report, the most recent inflation report could likely prompt the Fed to shift its stance, although one could also argue that the recent reading could just be an aberration. Nonetheless, I’ve been left less than impressed by the way the Fed has handled its monetary policies and the way it has communicated with the markets. I discussed this and more with my guest Jim Grant in the talk “The Fed Is Out Of Control”.
Conclusion
As noted in this week’s edition of The Lead-Lag Report, a ratio measuring the strength of the flagship basket of emerging market stocks as a function of the S&P 500 has dropped to record lows, and much of this has been driven by weakness in China. Whilst the house of cards appears to be collapsing in the EM space, India is still one of the better-positioned EMs. Having said that, INDY’s cost efficiency is a bit of a bugbear with an elevated expense ratio of 0.89%, higher than other Indian-based alternatives. In addition to that, INDY’s valuation differential is also quite steep with the ETF trading at 16.8x, almost 55% higher than the corresponding multiple of the EM basket.
 Anticipate Crashes, Corrections, and Bear Markets
Sometimes, you might not realize your biggest portfolio risks until it’s too late.
That’s why it’s important to pay attention to the right market data, analysis, and insights on a daily basis. Being a passive investor puts you at unnecessary risk. When you stay informed on key signals and indicators, you’ll take control of your financial future.
My award-winning market research gives you everything you need to know each day, so you can be ready to act when it matters most.
Click here to gain access and try the Lead-Lag Report FREE for 14 days.
Be the first to comment