

tupungato/iStock Editorial via Getty Images
In our last assessment of Realty Income Corporation (NYSE:O) in Feb ’22, we made a DCF analysis and recommended buying at $67.4 given the DCF implied price of $88 per share in the base case scenario.
O is currently trading at $55.6, down -17.5% (S&P 500 -21%) from the last article, excluding monthly dividends. The two more negative scenarios presented to the readers gave it a price target of $58 and $39 per share, respectively, driven by slower growth and higher WACC assumptions.
We also recommended closely monitoring WACC and growth rates following the merger with VEREIT. With H1 results published, we are now re-evaluating our previous DCF assumptions in a more challenging economic reality.
Key drivers for valuation
- WACC – Federal Funds Effective Rate impact on operating costs
- Cap rates – Ability to exceed the WACC hurdle rate to acquire properties.
- Occupancy & growth- Tenants’ ability to carry over costs to customers
- Shares outstanding – The merger’s impact on shareholder dilution
H1 ’22 results – Base for projection
Weighted Cost of Capital (WACC)
As Fed raises the interest rate, we observe a higher WACC guidance from the company. The long-term target is now at 6.1%, up +0.4pp vs. the guidance beginning of the year. The new target is used in our base DCF scenario. We will also simulate higher levels in a conservative scenario.
Investor Presentation, Aug 2022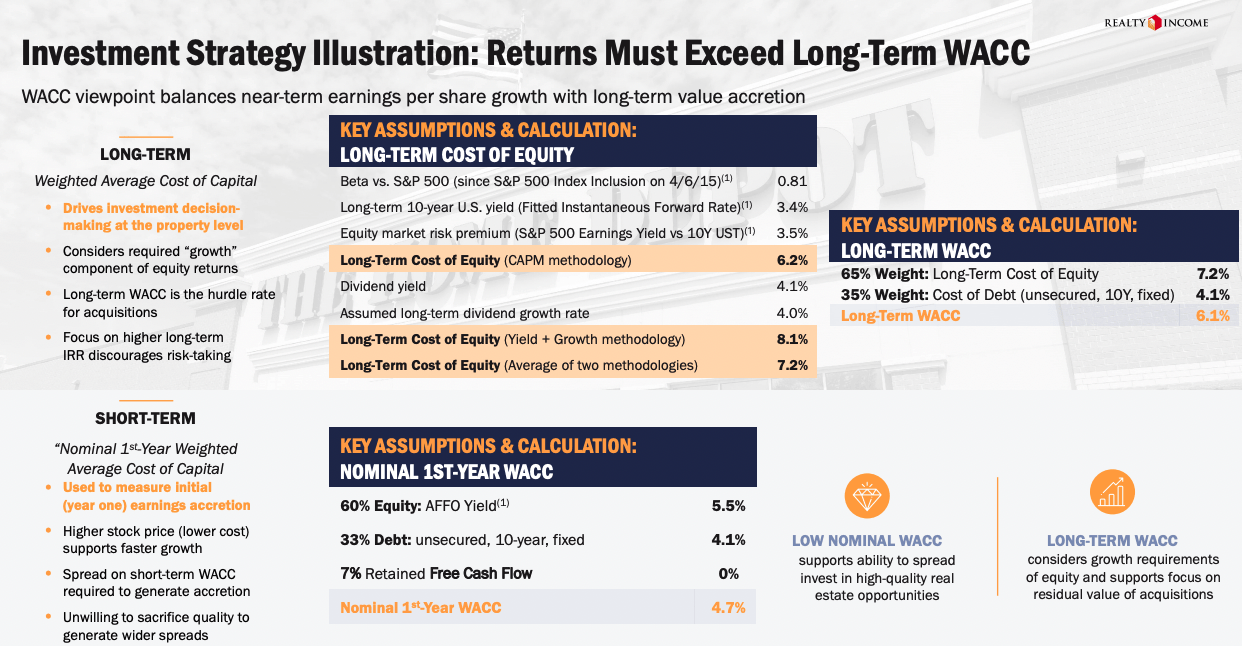
Capitalization Rate (Cap Rate)
Rising costs require O to purchase properties with higher cap rates to maintain the spread, which can steer the company into risky assets. However, we do not see indications of this happening. A recessionary environment could present attractive investment opportunities for a well-capitalized enterprise.
Investor Presentation, Aug 2022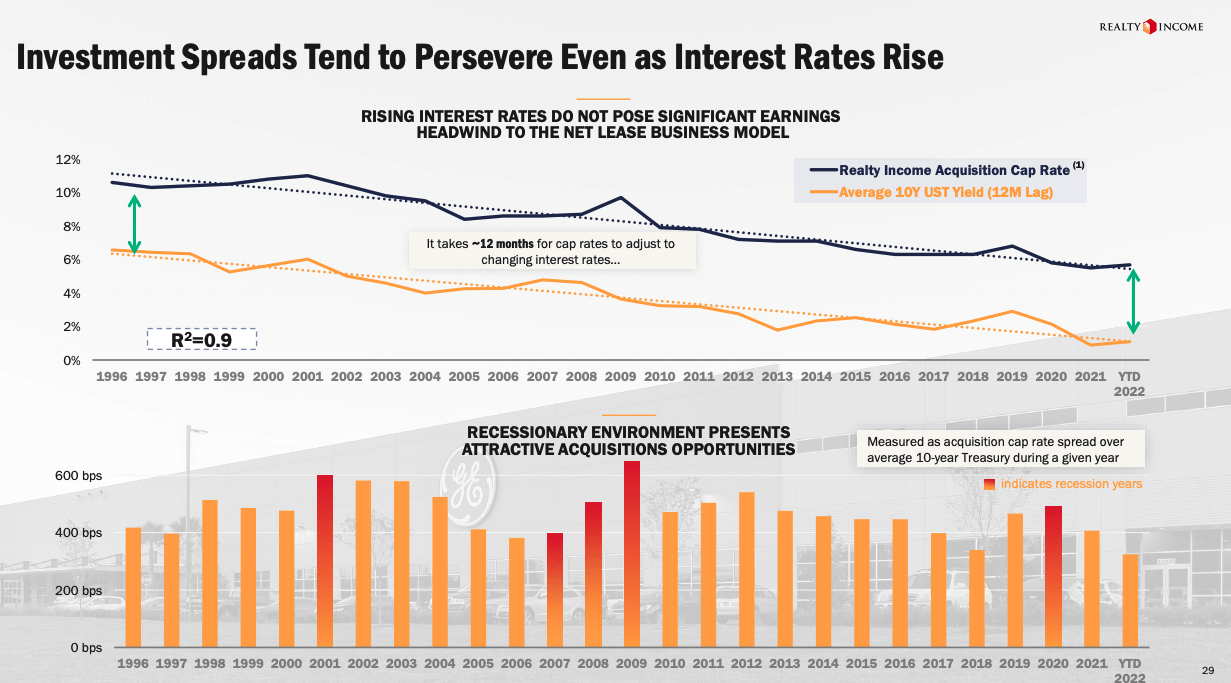
Occupancy Rates & Growth
Occupancy rates continue to be high. Rent escalation clauses pegged to inflation are starting to kick in, but tenants are resilient thus far. O’s solid tenant base should withstand even higher costs as they can carry it over to customers. We will simulate slower growth levels in all our scenarios to account for a potentially lower occupancy rate.
Investor Presentation, Aug 2022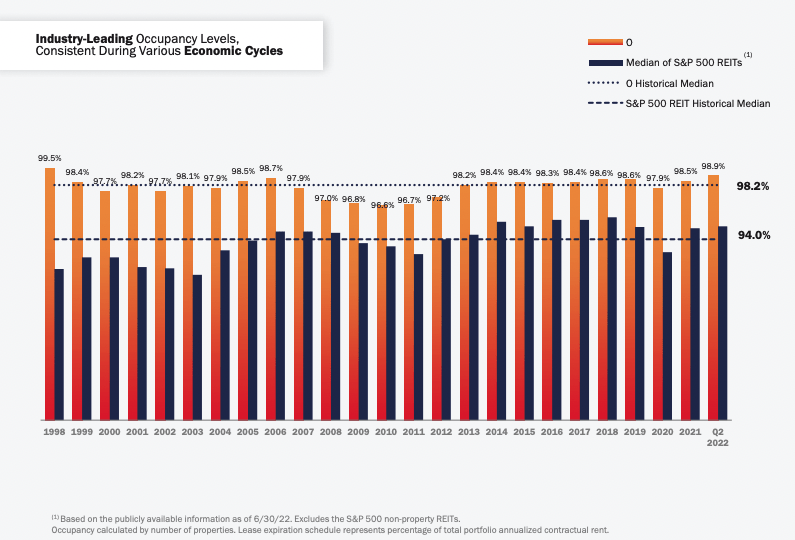
DCF Analysis
Three scenarios were modeled to capture future outcomes. First, we calculated the ’22 base point for the outlook years by extrapolating H1 actuals.
Revenue growth in the first half of the year was +79% vs. the same period last year (SPLY) and +72% growth quarter over quarter (QoQ), but the merger with VERIET skews the growth rate figures and needs to be adjusted.
The current H1 run rate indicates 3.236 M in Revenues for FY ’22, and consensus among analysts estimates a +59% YoY growth rate. Our calculations align with the market consensus and will be the base for all three scenarios. It is unlikely O will experience an event that derails the run rate for this year adjusted for the VEREIT acquisition.
Earnings Release, Aug 2022 Analysts Consensus Estimates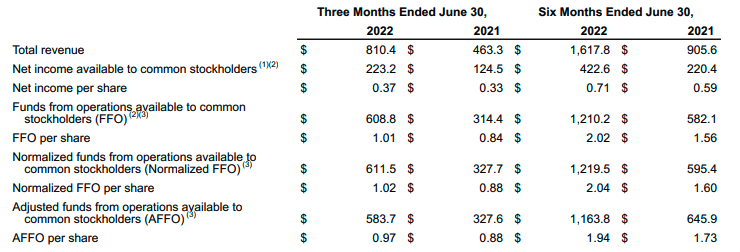
DCF Scenarios
The following scenarios were created for our analysis of the outer years.
| Label | 1. Conservative | 2. Base | 3. Optimistic | |||
| Revenue Growth | 7.0% | 8.0% | 9.0% | |||
| WACC | 7.5% | 6.1% | 6.1% | |||
| TGR | 0.50% | 1.00% | 1.50% | |||
The historical revenue growth for the company has been double-digit, but in all our scenarios, it is kept more modest. This gives us a buffer in all scenarios should the cost of capital rise above our model assumptions and the post-merger result cause a slowdown vs. historical trend.
FY ’22 and the outer years include post-merger projected results (O+VEREIT).
SEC, FORM 10-Q, DCF Projections SEC, FORM 10-Q, DCF Projections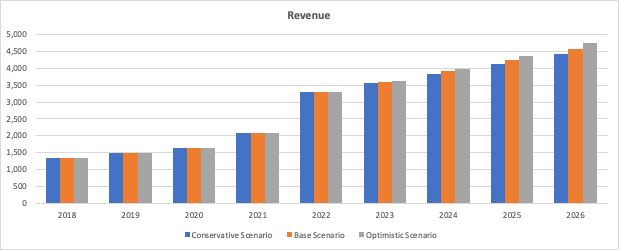
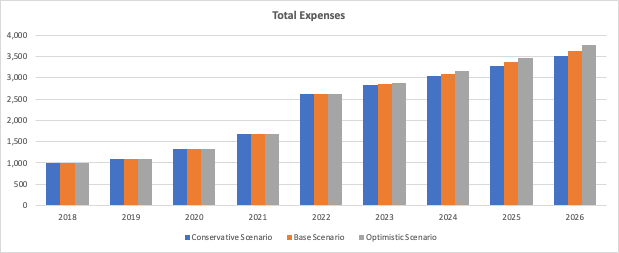
Total expenses grow proportionally to the revenues. The elevated costs in 2021 above trend were attributed to non-recurring charges for the merger.
SEC, FORM 10-Q, DCF Projections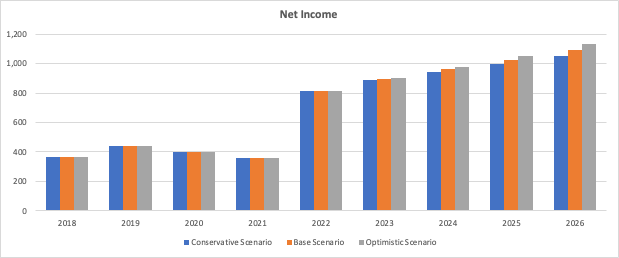
Two years stand out looking at Net Income for ’20 and ’21. At first glance, it seems to break the long-term trend, but it is attributed to one-off items. Provision of impairment cost in ’20 (150 million) and loss of extinguishment of debt in ’21 (100 million).
SEC, FORM 10-Q, DCF Projections SEC, FORM 10-Q, DCF Projections
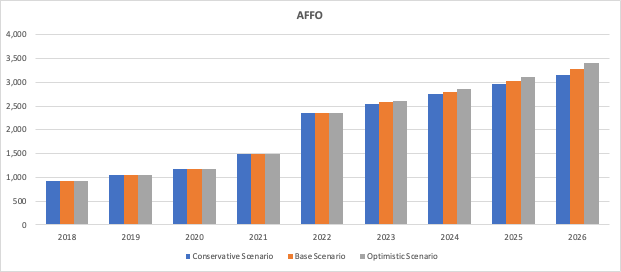
FFO and AFFO have grown consistently (Excludes one-off items).
With the acquisition of VEREIT, new shares were issued to finance the deal, resulting in a significant share dilution in ’22.
SEC, FORM 10-Q, DCF Projections SEC, FORM 10-Q, DCF Projections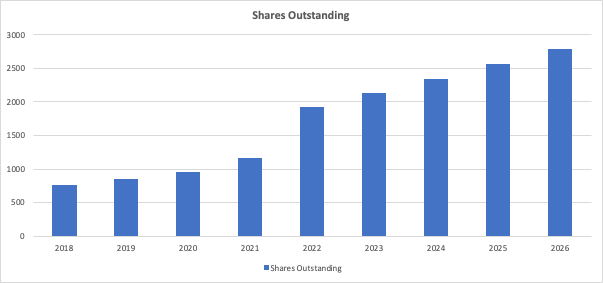
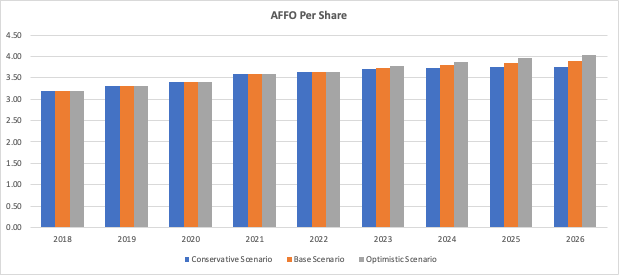
Despite the share dilution, the company still maintains AFFO growth on a per-share basis for all scenarios. However, the conservative scenario’s AFFO per share is leveling out in the outer years.
Seeking Alpha, DCF Projections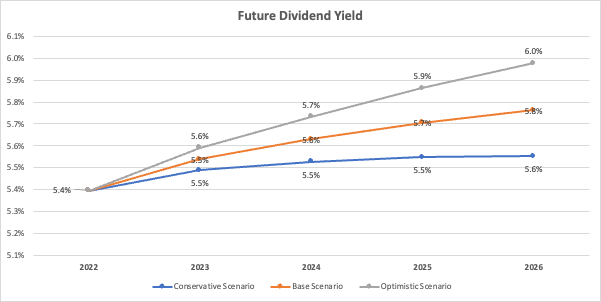
Given an 82% payout ratio, the future dividend yields are expected to grow, but a slowdown in per-share growth results in a flattening yield curve for the conservative scenario.
Recommendation
By discounting the business’s future cash flow for each scenario, we reach the following share price targets.
| Label | 1. Conservative | 2. Base. | 3. Optimistic | |||
| Price Target | $38.5 | $65.6 | $77.6 | |||
The stock is currently trading at $55.5, and our base scenario indicates an upside potential of +18%. We have been conservative in our growth outlook in all scenarios. Still, downside potential exists should there be a disruption in O’s funding ability and market sentiment turns more negative.
We recommend buying O in small increments to capitalize on the market volatility. Risk-averse investors are advised to stand on the sidelines until we see clear signs of the Fed slowing down the interest rate hikes.
Be the first to comment