

Yurii Klymko/iStock via Getty Images
Co-produced with PendragonY
Diversification is a good way to reduce individual investment risk. We frequently provide several different investment ideas to choose from in the name of diversity and risk management. But sometimes, you only have enough cash to take advantage of one opportunity. Every strategy gives a set of metrics to help those following it compare two investments. The Income Method that we use at HDO does the same.
BDCs (Business Development Companies) are very hot right now. Many are doing quite well. Two such companies,Ares Capital Corporation (NASDAQ:ARCC) and Oaktree Specialty Lending Corporation (NASDAQ:OCSL), are BDCs that are doing well. If an investor only has the cash to buy one of them, which is the best one to buy?
ARCC has been around for a long time and has done very well. The current team managing OCSL took over the worst-performing BDC in 2017, got its dividend in line with what it could support, and began an aggressive program to improve the portfolio and its performance. Despite that impressive turnaround, ARCC is still the better BDC with better dividend coverage and more room to increase the dividend. In addition, Ares Management has a history of managing a BDC in many different economic conditions, which Oaktree’s management team has yet to experience.
We’ll be looking at 2nd quarter 2022 results in this report. ARCC will be releasing Q3 earnings on October 25th. OCSL reports FY-Q4 on Nov. 15th.
Dividend Safety
Determining which company, ARCC or OCSL, is the better investment starts with assessing the dividend safety. While the Income Method aims to buy investments when their yield is high, it is still critical that the dividend be safe. It doesn’t really matter how high a dividend was paid before we bought shares, we will only ever collect the dividends paid after we have started purchasing shares.
Typically, companies increase their dividends only when they can afford to continue paying the higher dividend for some time. So a raise is an indicator that the dividend is well covered. In March, ARCC increased its regular quarterly dividend by a penny to $0.42, a 2.4% increase (and again in September to $0.43). In addition, ARCC has been paying a supplemental dividend of $0.03 each quarter of 2022. OCSL also showed its solid dividend coverage by increasing its quarterly dividend by half a penny to $0.17, a 3% increase.
NII (Net Investment Income) is also a good metric to help determine dividend safety. While it isn’t the only source of cash to pay the dividend for a BDC, it is the most repeatable. So how did our two BDCs do in NII?
Looking at Adjusted NII (which accounts for some fees and interest not counted by GAAP), OCSL earned some $0.17 a share in the most recent quarter. That works out to be 103% of the dividend paid out for the quarter. The adjusted NII over the last year has averaged 17 cents a quarter and was 19 cents in the year-ago quarter.
ARCC produced $0.52 in NII which very easily covered the $0.42 dividend for the quarter, and also covered the 3-cent special dividend that would normally come out of spillover income. That coverage leaves untapped that pool of cash that is required to be distributed to shareholders and thus available to help pay dividends in the future.
ARCC easily beats OCSL on NII coverage of its dividend, even if you include the special dividend from ARCC in one’s calculations. This is a big win for dividend reliability for ARCC.
As future dividends are more important than past dividends, so is the ability of a BDC to pay those future dividends. And since NII is at, least in part, dependent on interest rates, the sensitivity of a BDC’s portfolio to interest rate changes is important. At first blush, it might look like OCSL’s portfolio is better positioned to benefit from a rising rate environment as it lists its exposure to floating rate debt as 87.8%. It would seem that ARCC’s exposure, at 74%, is much less. However, OCSL lists its exposure to fixed or floating rate debt as the percentage of its debt investments, while ARCC lists its exposure relative to its entire portfolio. Adjusting for the 89% portion of its portfolio that is debt investments, OCSL’s whole portfolio exposure to floating rates is just 78.2%. So that reduced OCSL’s advantage significantly.
The Federal Reserve intends to be far more hawkish than it was saying even a year ago as the most recent 75 bps increase in interest rates shows. So how each BDC will fare as rates increase is quite important.
As it happens, ARCC has a slide covering this in its last earnings presentation. While it shows an increase of 31 cents in Core EPS for a 100 bps increase in interest rates, it says this is a 17% increase that would work out to be about a 12% increase in Core EPS for the 75 bps increase the Fed just instituted. This will also impact NII, so this will mean that the current dividend, increased a penny a quarter, will be better covered and might even be raised again. (Source: ARCC Q2 Investor Presentation).
ARCC Q2 Investor Presentation
OCSL doesn’t provide such exact data, but did say in the conference call that it was well-positioned to benefit from likely interest rate increases.
On dividend safety, one of the most important metrics, ARCC clearly outshines OCSL.
Leverage and Liquidity
ARCC and OCSL have the same investment-grade credit rating and outlook from S&P. This gives them similar costs, as well as availability and access to capital.
ARCC has nearly $4.6 billion in total liquidity The leverage ratio is 1.23x. This should provide plenty of flexibility while not having too big an impact on the downside.
OCSL, meanwhile, has $489 million in total liquidity. The leverage ratio is 1.08x. While OCSL is much smaller than ARCC, it still has less cash to deploy. This is offset by the lower leverage reducing the impact of price declines for its assets.
Overall, we will consider this comparison to be a draw as we prefer ARCC’s greater liquidity enabling it to buy assets at a good price as rising interest rates make for lower debt investment pricing. While OCSL’s lower leverage ratio reduces the potential downside impact of asset price declines. Given that ARCC already has better dividend coverage, we think ARCC’s larger liquidity will allow it to buy even more income which can be used to support and even increase the dividend.
Investment Portfolio
Non-accruals are very low as of the end of June, only 0.9% (yes, less than 1%) at fair value or 1.6% of amortized cost. ARCC’s portfolio consists of 64% senior secured debt and 74% of its investments are floating rate. ARCC’s portfolio is overweight more defensive sectors, with its top five sectors being software, healthcare, commercial and professional services, insurance services, and power generation.
Rebuilding its portfolio since its takeover by Oaktree, the OCSL’s portfolio beats out ARCC by having none of its investments in non-accrual status. OCSL’s portfolio consists of ~87% senior secured debt and 88% of its debt investments are floating rate, meaning that ~79% of the total investment portfolio benefits from rising interest rates. Similar to ARCC’s portfolio, OCSL’s portfolio is also mostly overweight more defensive sectors, with its top five sectors being software, pharmaceuticals, data processing, biotechnology, and healthcare. In fact, its portfolio looks even more defensively positioned given its greater emphasis on medical-related industries.
Overall, I think OCSL has a slightly better portfolio than ARCC. Oaktree’s takeover of the fund back at the end of 2017 allowed for a good house cleaning and they have done an excellent job at underwriting new investments since then, which shows in the lower non-accrual rate. The actual amount of investments both ARCC and OCSL have in floating rate debt gives a marginal win to OCSL being slightly better positioned for a rising rate environment. Although ARCC will do marginally better if rates fall, I don’t think that is likely to happen in the near to medium term. Certainly not in the next year.
Track Record
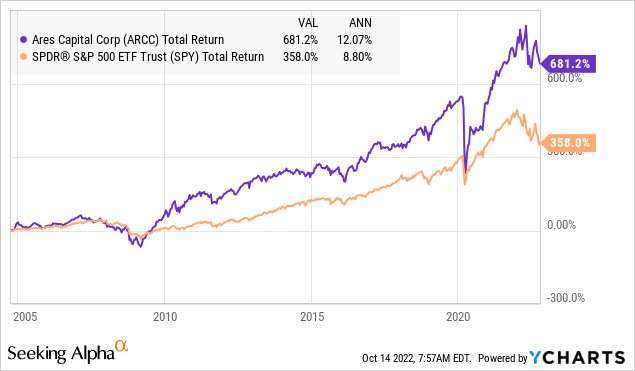
While we focus more on income at HDO, many investors also look at an investment’s total return track record. ARCC has a great track record, as it has crushed the market since it went public:
OCSL, meanwhile, has a less-than-stellar track record. However, since being acquired by Oaktree at the end of 2017, management has done a phenomenal job of growing NAV and dividends per share. In fact, over that period, OCSL has improved enough to only trail ARCC by a small amount:
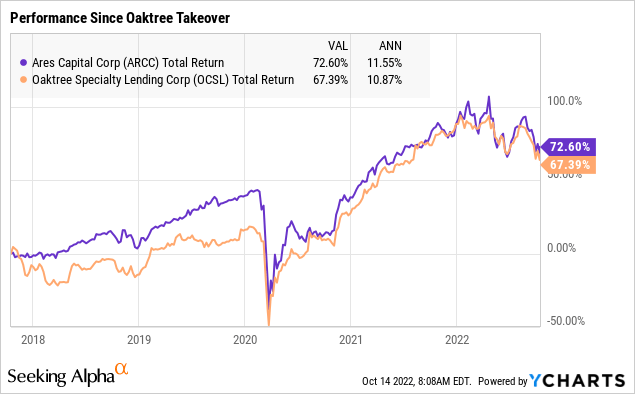
In the last few days, as the market went down hard, OCSL has even closed some of the gap with ARCC. ARCC still does better than OCSL (since Oaktree took over management) with a CAGR of 11.55% versus 10.87% for OCSL.
As a result, we view this as a win, but a narrow one, for ARCC. It is hard to underestimate ARCC’s impressive long-term track record. At the same time, however, under the current management teams, OCSL has been doing a lot better than it has in the past. Oaktree management team under the guidance of Howard Marks has an exceptional long-term track record of its own.
Valuation
We can look at a valuation in two ways. The first is to look at how many dividend dollars you get for each investment dollar put into ARCC and OCSL. That is basically the current yield, and for OCSL it is $0.68 (based on 17 cents for the most recent quarter) at a $6.18 share price for 11.0%. For ARCC, it is $1.72 (based on the regular dividend of $0.43 declared for the most recent quarter) at a share price of $17.85 yields 9.6%. If we include the special dividends paid out each quarter that would be a yield of 10.3%.
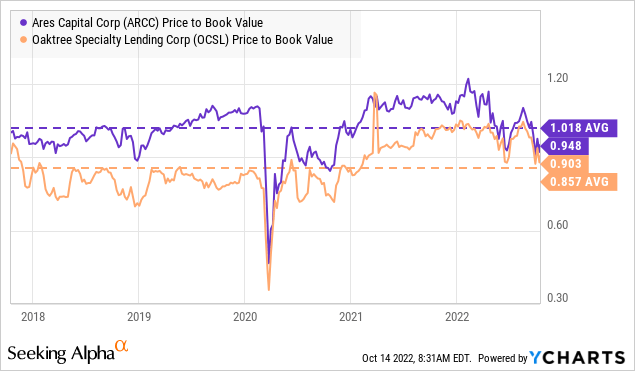
The other way to look at valuation is the price-to-book value ratio. For that metric, ARCC at 0.948, is slightly edged out by OCSL with a lower 0.903 ratio. However, ARCC is well below its average price-to-book ratio while OCSL is slightly above its average.
Shutterstock
Conclusion
In this comparison of two good BDCs, there is a clear winner. While OCSL has a slightly higher yield, ARCC has better dividend coverage, valuation, and total return track record. That better total return track record starts with OCSL being the worst-performing BDC, and that low makes its performance look even better.
ARCC has a longer history of excellent performance. The experience of its management team will prove invaluable in this economy, especially if we enter a recession. Remember, OCSL’s management team hasn’t managed a BDC with such high inflation and rising interest rates.
So while both ARCC and OCSL are reasonable options, we decided to side with ARCC’s proven history and track record through difficult times.
Be the first to comment