

mbbirdy
Investment Thesis
The First Trust Rising Dividend Achievers ETF (NASDAQ:RDVY) bounced back as one of the best-performing dividend ETFs in the market in July. But given the ETF’s reliance on the Technology sector, is this a sign that market optimism has returned? That’s the key question I’ll be looking to answer with this article as I explore its constituents’ latest fundamentals and earnings results through Q2 2022. My view is that RDVY remains a valuable risk-on asset to balance out most dividend investors’ conservative portfolios, but on its own, it’s not an attractive buy right now.
RDVY ETF Overview
Strategy and Exposures
RDVY tracks the NASDAQ US Rising Dividend Achievers Index, holding 50 companies that have paid more dividends in the last year than in the previous three and five years. In addition, selections must have higher earnings per share than three years ago, cash to total debt ratios above 50%, and a trailing dividend payout ratio less than 65%. These last two screens are biased against capital-intensive sectors like Utilities and Industrials, so that limits the defensive capabilities you might otherwise expect with a dividend-focused ETF.
RDVY’s GICS sector exposures are below. Please note that these are slightly different than what appears on the First Trust website, but ultimately, the story is the same. RDVY is overweight Financials (35.62%) and Technology (26.55%), even more so than the Schwab U.S. Dividend Equity ETF (SCHD), which I consider to be an excellent all-around fund.
Morningstar
RDVY’s top 20 holdings, which total 42.83%, are below. This list includes stocks from all size segments, including mega-caps like Apple (AAPL), large-caps like Goldman Sachs (GS), mid-caps like Williams-Sonoma (WSM), and small-caps like Louisiana-Pacific (LPX). The weighted-average market capitalization is $207.85 billion, but the median is just $44.62 billion. That still makes it primarily a large-cap ETF, but it’s closer to the bottom end.
First Trust
Dividends and Fees
RDVY currently yields 1.53%, so that’s not much of a draw. In addition to its sector composition, RDVY’s 0.50% expense ratio directly reduces what would otherwise be a decent 2% yield. On the plus side, its 14.76% five-year dividend growth rate is well above average. Younger investors are probably better suited to this ETF because of this high growth component.
Seeking Alpha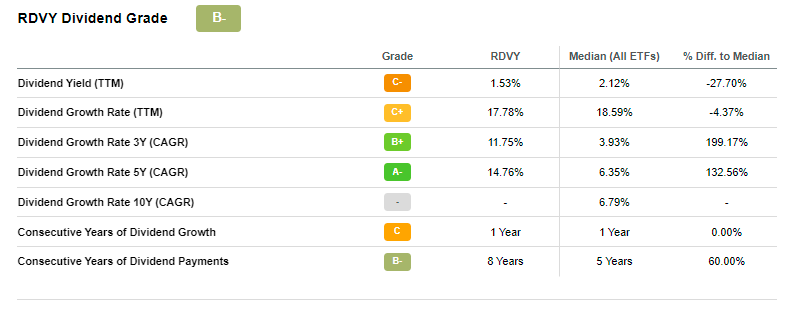
To achieve a decent yield, you need a long time horizon. As the graph below shows, purchasing RDVY five years ago would only achieve a 2.47% yield on cost, well below the starting yield of many leading ETFs, including SCHD.
Seeking Alpha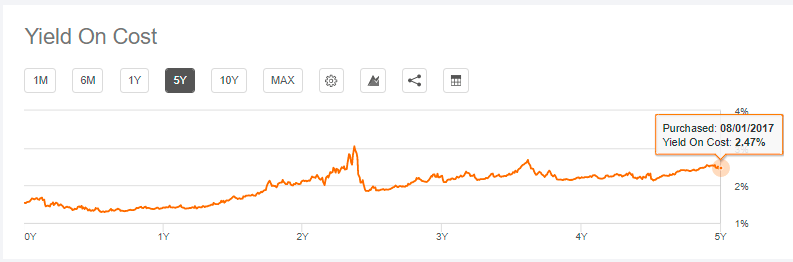
Performance Analysis
Since its inception, RDVY has nearly matched the performance of SCHD and the SPDR S&P 500 ETF (SPY), gaining an annualized 12.11%. However, volatility and drawdown figures aren’t in RDVY’s favor, leading to significantly worse risk-adjusted returns (Sharpe and Sortino Ratios).
Portfolio Visualizer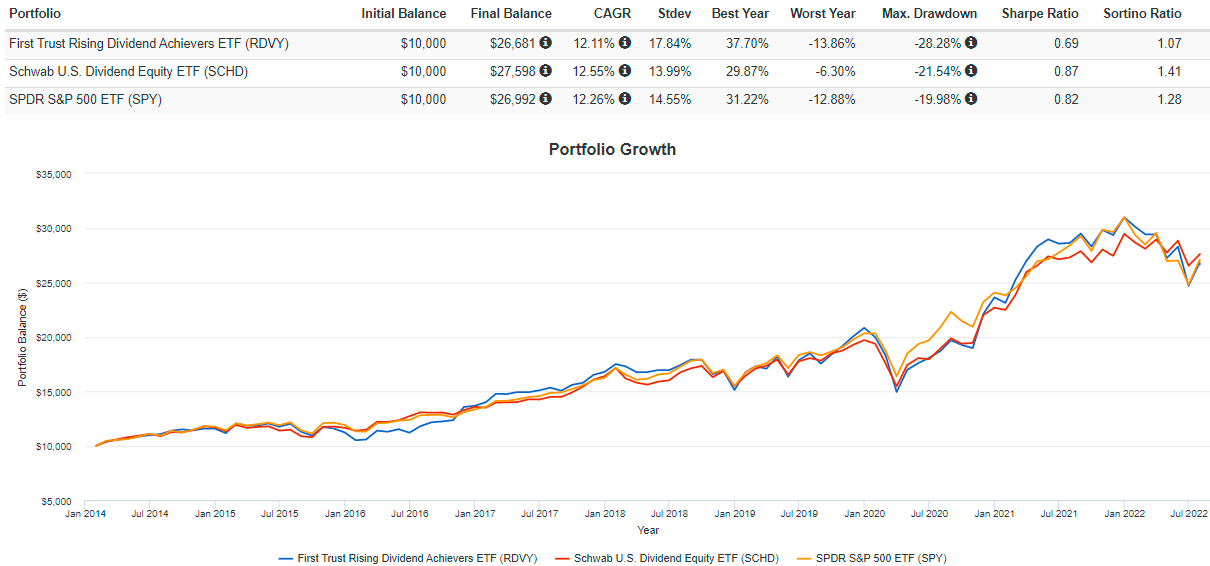
I’m stacking the deck against RDVY because SCHD is a well-known top performer, and SPY has a much more significant growth component. However, RDVY was the second-best-performing large-cap dividend ETF in July and the fifth-best overall of 65 ETFs. Below is a sample of those with at least $1 billion in assets under management.
The Sunday Investor
RDVY has gained 74.76% in the last five years, which is pretty solid but well behind what it used to be. Despite last month’s excellent performance, RDVY is still down 6.39% over the previous year. The high volatility creates opportunity, but it’s not for everyone.
Fundamental Analysis
Industry Snapshot vs. SCHD
Here is a snapshot of RDVY’s top 20 industries, with metrics for the entire fund bolded near the bottom. Notice that despite RDVY holding only 50 securities, they’re at least spread fairly evenly across industries. Its concentration in the top 20 is 86.80%, slightly more than the 100-stock SCHD.
The Sunday Investor
The next evident feature is RDVY’s 1.19 five-year beta, which is among the highest for dividend-oriented ETFs and rivaled only by small- and mid-cap focused funds like the First Trust SMID Cap Rising Dividend Achievers ETF (SDVY). The industry breakdown lets you see the most significant contributors. RDVY is overweight Semiconductors and Semiconductor Equipment stocks like KLA (KLAC), Lam Research (LRCX), Applied Materials (AMAT), and NVIDIA (NVDA). These stocks have betas between 1.68 and 1.96. You can see how well investors would have been rewarded over the last decade by investing in an equal-weighted portfolio of RDVY’s seven semiconductor stocks.
Portfolio Visualizer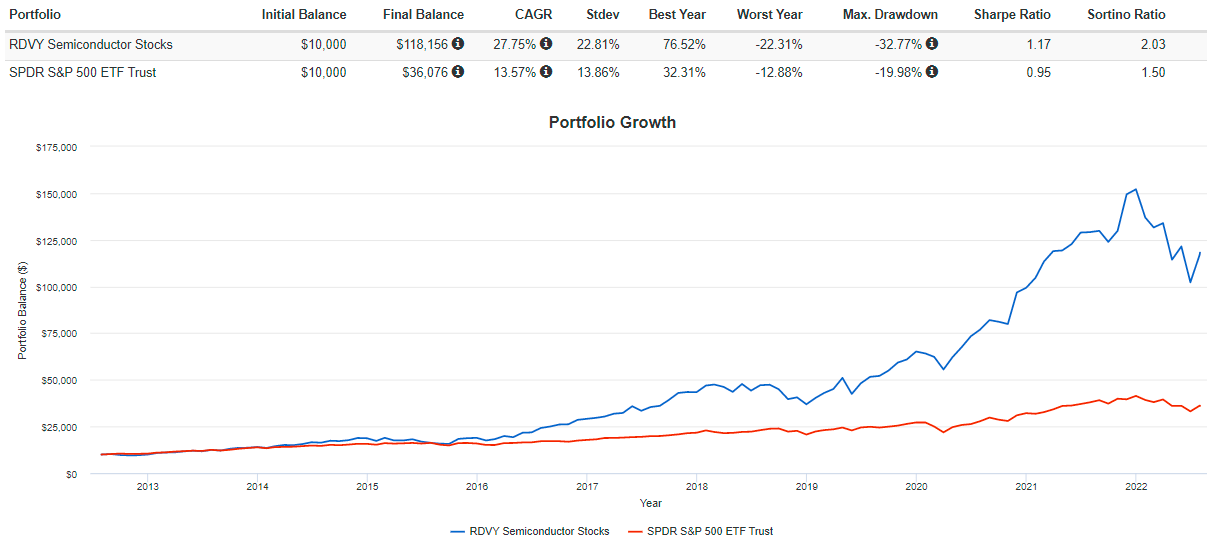
As discussed, RDVY’s constituents have excellent dividend growth histories, raising them by an annualized 15.41% over the last five years. This dividend growth was partially supported by a 9.63% annualized revenue growth figure. Analysts expect revenue and earnings per share to increase by 10.78% and 20.85% over the next 12 months, substantially higher than SCHD’s 7.93% and 12.00% growth rates. These are reasons why I don’t want to give up on the Rising Dividend Achievers. Typically, investors pay a premium for such growth, but RDVY trades at an attractive 13.80x forward earnings.
Earnings Season Update
Through August 1, 2022, 35 constituents (69.84% of the total weight) have reported Q2 2022 earnings. I want to zero in on the Financials and Technology sector since they will drive most of RDVY’s returns going forward. I’ve summarized the 24 stocks in these two sectors below, and I’ve calculated their median revenue and earnings per share surprises to be 1.45% and 4.80%.
The Sunday Investor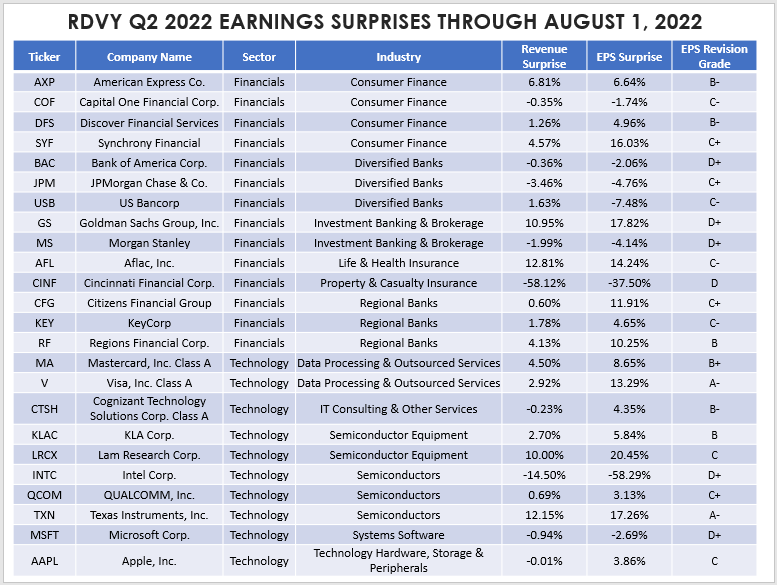
There are several outliers, including Intel (INTC) missing consensus estimates by 58.29% and the CEO admitting a “below standard” quarter. Still, after considering this and the earnings surprise data provided by Yardeni Research, it looks like we’re on track to continue the downward trend in earnings and revenue surprises. If the earnings season were to end today, this is how it would look relative to the prior 11 quarters.
Chart: The Sunday Investor, Data: Yardeni Research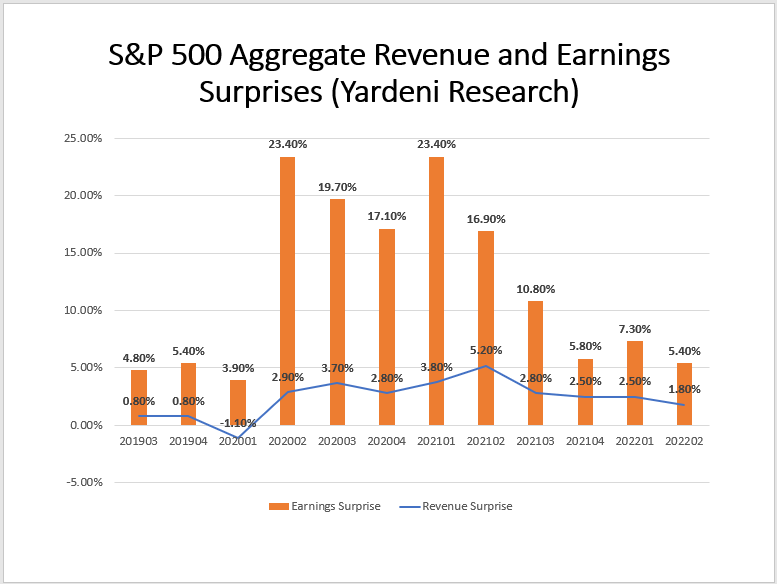
These numbers are still somewhat strong on a historical basis, but I was hoping for a second consecutive quarter of growing earnings surprises, and it doesn’t look like we’re going to get it. Therefore, I think extra caution is warranted for equity investors. A high beta ETF like RDVY can easily erase its 8.58% July gain.
Fund Overlap
While market indicators aren’t positive, RDVY may be a complementary holding given its low holdings overlap. According to the ETF Research Center, there’s just a 17% overlap in weight between RDVY and SCHD.
ETF Research Center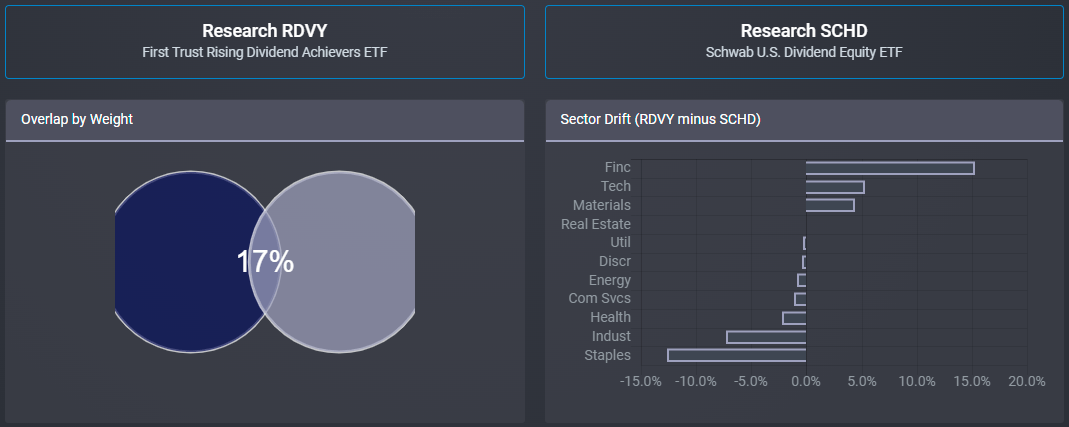
A two-ETF portfolio comprising 75% SCHD and 25% RDVY would have solid fundamentals and significantly enhance diversification. The following table shows this combination yields a 75.48% concentration in the top 20 industries (vs. about 85% for SCHD and RDVY). It also has a beta slightly below market, an earnings per share growth rate of just 3.23% less than SPY, and a forward earnings valuation about nine points less.
The Sunday Investor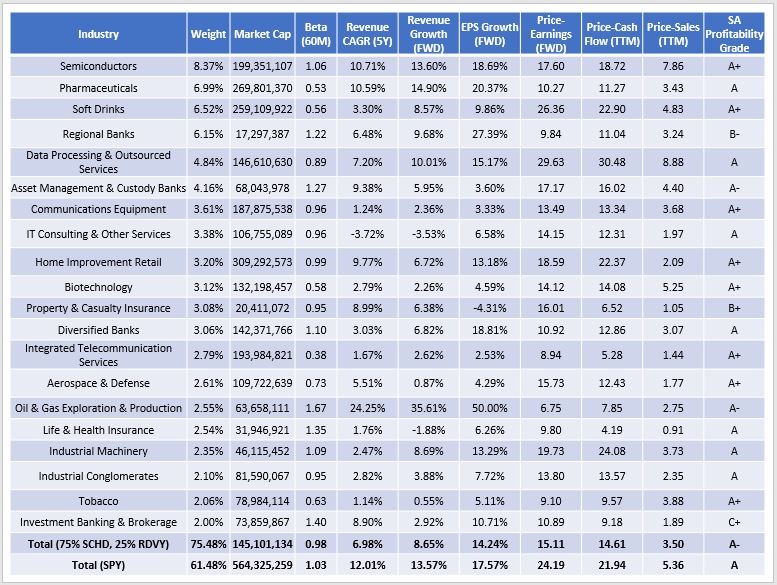
The takeaway is that adding RDVY to your portfolio, even in small amounts, is often an efficient use of capital for dividend investors. It likely will improve your portfolio’s growth potential and may even reduce its valuation.
Investment Recommendation
There are several pros and cons to investing in RDVY today, so it’s challenging to make a call either way. On the one hand, I like that it’s a high-growth ETF trading at a low valuation. It’s also overweight semiconductors, which I think are solid overall and will continue to deliver outsized returns. The negatives include an inexplicably high 0.50% expense ratio that helps drive the fund’s dividend yield below 2%. Market sentiment doesn’t look like it will improve in the near term based on earnings results, and that’s not good news for a highly volatile ETF like RDVY. Therefore, my rating today is neutral, and I look forward to discussing further in the comments section below.
Be the first to comment