

koyu/iStock via Getty Images
It’s the Friday before Halloween, so it seems like a good time for a quick tale of some of the scarier moments in financial markets over the past several decades. Here’s another reason why the present moment is a good time for this discussion: the relentless recent pace of strong consumer demand is starting to show signs of flagging, giving strength to the argument that a recession is likely to take place sometime in the first half of 2023 (a point of view with which we agree). Could market conditions get a whole lot worse than they already are?
The Sound of Assets Breaking
The short answer to the above question is: sure, things could always get worse, and they could also get much better, too. But when we look more closely at those scary moments stock prices have experienced, we find that much of the dismay has less to do with economic recessions than with other things – with other latent threats that surface and exert a sudden, sharp influence on risk assets of a certain class. Consider the following chart. Here we document each instance since 1987 – the year of the fabled Black Monday crash on Wall Street – when the S&P 500 has retreated by a magnitude of ten percent or more (ten percent being the technical definition of a market correction).
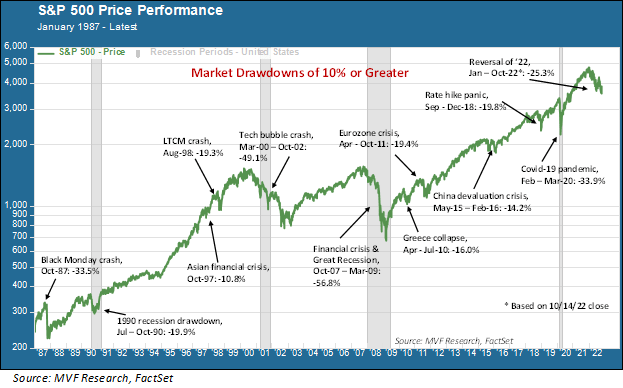
Over this 35-year span of time, we have witnessed twelve instances of market corrections. Only one of these twelve events, in our judgment, resulted directly from a cyclical economic recession, and that was the 1990 recession (the gray columns in the chart represent periods of recession). Yes – there were three other recessions apart from the 1990 event. But in those cases the recession itself was caused by financial breakage – the tech bubble crash in 2000, the credit and mortgage market meltdown in 2008 and the deliberate shutdown of the economy in March 2020. The stock market drawdown resulted more from the breakages than from the recession itself.
Black Monday Set the Pace
Each of these drawdowns has its own particular tale of misery, but there are some common threads. Black Monday is a great place to start. On October 19, 1987, all major US stock indexes fell by more than 20 percent in a single day. There was no recession, no geopolitical crisis, nothing to suggest that the largest single-day drop in stock market history was about to take place. But there was a nifty little financial hedging strategy going on with major institutional investors like pension funds; a thing called “portfolio insurance.” The theory was simple enough: if prices go down by more than a certain threshold, sell to cut your losses. That theory was underpinned by the fundamental axiom of boundless liquidity; i.e. for every seller there will always be a buyer.
But if enough people are selling the same thing at the same time, then the supply of buyers dries up. Prices keep going down, which triggers a vicious cycle of yet more selling. That is what happened on Black Monday, and in fact, that is what happened just a couple weeks ago in the market for UK sovereign debt, as we have discussed in a couple of our recent commentaries.
The October ’87 crash was a template of sorts for a number of the breakages that would follow, including the failure of hedge fund LTCM in 1998, the rapid unraveling of Internet stocks in 2000 and, most famously, the discovery in 2008 that problems in the subprime mortgage market were just the tip of an overleveraged iceberg of interlinked credit instruments that nearly brought the entire financial system down when, in the wake of the Lehman Brothers bankruptcy, buyers all ran for the exits.
The Fed Steps In
Black Monday set another durable trend in motion: the repeated market bailouts at the hands of the Federal Reserve. The US central bank under then-chair Alan Greenspan stepped in to provide liquidity in the immediate wake of that market crash, and then he and his successors proceeded to operate from the same playbook throughout the ensuing chain of events up to and including the 2020 pandemic. That event was perhaps peak Fed: with even the US Treasury market seizing up during the worst of the March 2020 panic, the Fed pledged to essentially buy whatever assets it needed to in order to restore confidence and liquidity.
So where does that leave us today? Clearly, the key difference in the market climate of 2022 from all the other years shown in the above chart is that the Fed is not in the market providing liquidity, but is rather taking money out of the system as it tries to subdue the highest levels of consumer inflation in forty years. As we see it, the Fed’s current policy will continue at least through the end of the year until the Fed funds rate winds up somewhere north of 4.5 percent. A rate hike of 0.75 percent in November, widely expected, plus another one of 0.5 to 0.75 percent in December would bring us to that level (the upper bound of the Fed funds target rate is currently 3.25 percent).
At that point, the central bank will likely slow down or even pause the monthly rate increases to assess the policy’s effects on inflation and economic growth. We would expect to see asset prices stabilize somewhat under these conditions with a more sustained upward directional trend commencing well ahead of the general economy bottoming out (note: this is an observation, not investment advice). This has been the case in basically all the recessions we have had since 1945 (the exception was the 2001 recession, in which as we noted above the market was impacted more by extraneous events than by the recession itself).
What we cannot predict, of course, is the sudden emergence of another threat that breaks the market in the manner of those previous events of the past 35 years. Nobody had “UK gilts and pension funds” on their 2022 bingo cards, yet here we are. How would the Fed react to some kind of market breakage? We don’t know for sure, but the Bank of England supplied a template with their emergency intervention in the UK gilt market. What we do know is that any such forced intervention into US asset markets would be an unwelcome distraction from finishing the job of putting high inflation to bed. More treats, and fewer tricks, is what we could use this time around.
Editor’s Note: The summary bullets for this article were chosen by Seeking Alpha editors.
Be the first to comment