

NicoElNino
This dividend exchange-traded fund (“ETF”) article series aims at evaluating products regarding the relative past performance of their strategies and quality metrics of their current portfolios. As holdings and weights change over time, I post updated reviews when necessary.
RDIV strategy and portfolio
The Invesco S&P Ultra Dividend Revenue ETF (NYSEARCA:RDIV) has been tracking the S&P 900® Dividend Revenue-Weighted Index since 09/30/2013. It has 61 holdings, a distribution yield of 3.32% and at total expense ratios of 0.39%.
As described by Invesco, RDIV universe is the S&P 900 Index excluding the top 5% by dividend yield and the top 5% by payout ratio in each sector. Then, the top 60 stocks by dividend yield are weighted according to revenues, with a maximum 5% per stock. The portfolio is reconstituted and rebalanced quarterly.
RDIV is mostly invested in U.S. companies (97%), 48.1% in large companies, 40.4% in mid-caps and 11.5% in small caps. The fund is quite concentrated in the top 10 holdings, listed below: they weigh 49.2% of asset value.
|
Ticker |
Name |
Weight% |
EPS growth %TTM |
P/E TTM |
P/E fwd |
Yield% |
|
3M Co |
5.36 |
-29.65 |
20.62 |
14.18 |
4.04 |
|
|
Cardinal Health Inc |
5.26 |
-190.92 |
N/A |
11.87 |
3.22 |
|
|
Chevron Corp |
5.19 |
703.62 |
10.26 |
8.23 |
3.70 |
|
|
Prudential Financial Inc |
4.92 |
-70.22 |
17.88 |
9.50 |
4.97 |
|
|
Valero Energy Corp |
4.92 |
616.49 |
6.04 |
4.27 |
3.73 |
|
|
Walgreens Boots Alliance Inc |
4.91 |
134.95 |
6.29 |
7.78 |
4.92 |
|
|
Citigroup Inc |
4.85 |
-21.34 |
6.60 |
7.25 |
3.95 |
|
|
Gilead Sciences Inc |
4.67 |
-19.87 |
18.62 |
9.23 |
4.78 |
|
|
Duke Energy Corp |
4.58 |
29.14 |
22.05 |
20.02 |
3.68 |
|
|
AbbVie Inc |
4.53 |
90.35 |
19.53 |
9.98 |
4.09 |
The heaviest sector is utilities (22.3%), followed by financials (17.5%) and healthcare (14.5%). Other sectors are at 10% and below. Compared to the S&P 500 index (SPY), RDIV overweights not only utilities and financials, but also consumer staples, energy, and materials. It underweights communication, industrials, consumer discretionary and ignores technology.
RDIV sectors (Chart: author – data: Invesco and Fidelity)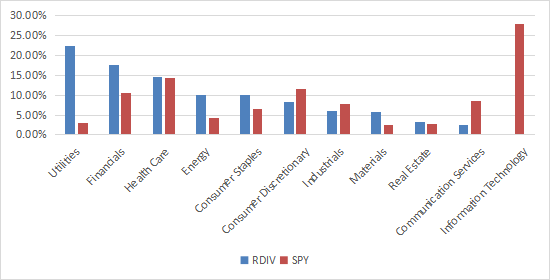
Performance
Since inception in 2013, RDIV has lagged SPY by 2.44 percentage points in annualized return, with a much higher risk in drawdown and volatility (standard deviation of monthly returns). It has also lagged one of its closest competitors among dividend ETFs: the Schwab U.S. Dividend Equity ETF (SCHD).
|
Total Return |
Annual.Return |
Drawdown |
Sharpe ratio |
Volatility |
|
|
RDIV |
140.04% |
10.42% |
-46.78% |
0.55 |
19.28% |
|
SPY |
190.52% |
12.83% |
-32.05% |
0.81 |
14.49% |
|
SCHD |
192.61% |
12.92% |
-32.29% |
0.84 |
14.01% |
Data calculated with Portfolio123
However, RDIV has outperformed both of them in 2022 to date, showing a positive return:
RDIV vs. SPY vs. SCHD in 2022 (Portfolio123)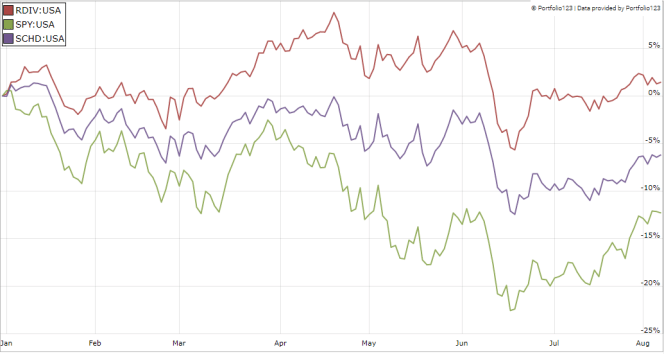
Comparing RDIV with a reference strategy based on dividend and quality
In previous articles, I have shown how three factors may help cut the risk in a dividend portfolio: Return on Assets, Piotroski F-score, and Altman Z-score.
The next table compares RDIV since inception with a subset of the S&P 500: stocks with a dividend yield above the average of their respective indexes, an above-average ROA, a good Altman Z-score, and a good Piotroski F-score. It is rebalanced annually to make it comparable with a passive index.
|
Total Return |
Annual.Return |
Drawdown |
Sharpe ratio |
Volatility |
|
|
RDIV |
140.04% |
10.42% |
-46.78% |
0.55 |
19.28% |
|
Dividend quality subset |
191.38% |
12.87% |
-36.22% |
0.81 |
14.81% |
Past performance is not a guarantee of future returns. Data Source: Portfolio123
RDIV lags the S&P 500 dividend and quality subset. However, RDIV performance is real, whereas the subset performance is hypothetical. My core portfolio holds 14 stocks selected in this subset (more info at the end of this post).
RDIV Value and Quality
RDIV is much cheaper than SPY regarding usual ratios (see next table).
|
RDIV |
SPY |
|
|
P/E TTM |
13.34 |
18.61 |
|
Price/Book |
2.07 |
3.59 |
|
Price/Sales |
1.3 |
2.39 |
|
Price/Cash Flow |
10.59 |
14.64 |
Data: Fidelity
RDIV holds 60 stocks, of which 5 are risky stock regarding my metrics. In my ETF reviews, risky stocks are companies with at least 2 red flags among: bad Piotroski score, negative ROA, unsustainable payout ratio, bad or dubious Altman Z-score, excluding financials and real estate where these metrics are less relevant. Here, risky stocks weigh about 11% of asset value, which is acceptable.
According to my calculation of the weighted average metrics reported in the next table, RDIV quality is very inferior to the benchmark.
|
RDIV |
SPY |
|
|
Altman Z-score |
2.02 |
3.44 |
|
Piotroski F-score |
5.85 |
6.02 |
|
ROA% TTM |
4.54 |
7.56 |
Takeaway
RDIV is a dividend fund holding shares of 60 companies paying high dividend yields, mostly large and mid-caps. Constituents are weighted based on revenue. It is heavy in utilities, with over 22% of asset value in this sector. RDIV is cheaper than SPY regarding valuation ratios, but average quality metrics are underwhelming. It has underperformed the benchmark and its popular competitor SCHD since inception, but beats them year-to-date. It shows a much higher risk measured in drawdown and volatility. RDIV has a bad rating at Morningstar: one star, whereas SCHD gets five. In summary, RDIV recent performance looks great, but keep in mind it is a risky fund regarding historical data and current quality metrics. For transparency, a dividend-oriented part of my equity investments is split between a passive ETF allocation (RDIV is not part of it) and my actively managed Stability portfolio (14 stocks), disclosed and updated in Quantitative Risk & Value.
Be the first to comment