

USD/JPY News and Analysis
- The emergence of doji candles indicate indecision for USD/JPY
- Negative but better than expected Japanese GDP data worsens fundamental outlook
- Bearish divergence suggests the current USD/JPY consolidation may turn into a pullback
Doji Candles Indicate Major Indecision for USD/JPY
The Japanese Yen appears to be consolidating beneath the 130 level as USD/JPY is on track to mark a third day of doji candles on the daily chart. Doji candles typically indicate indecision, which is an apt way to summarize recent USD/JPY price action.
The yen has been under pressure ever since Russia’s “special military operation” in Ukraine as the island nation imports between 70% to 80% of its oil consumption and therefore, remains susceptible to higher crude prices. Not only that, but the recent depreciation of the yen compounds the issue as more of the local currency is required to pay for the already elevated crude oil.
Japan’s Worsening Fundamental Outlook
Earlier today Japan’s preliminary GDP growth figure for Q1 suggested a contraction in economic growth with a -0.2% quarter on quarter figure, while the annualized figure signaled a contraction of 1%. Both data metrics have seesawed in previous readings, oscillating between positive and negative prints – avoiding a technical recession.
China’s lockdowns are also anticipated to have a sizeable impact on the Japanese economy, worsening the outlook further.
Customize and filter live economic data via our DaliyFX economic calendar
Rates and Growth Differentials Take a Back Seat for now
US GDP and the path of rate hikes continues unabated, although GDP has been revised down from 4% to 3.7% according to the IMF’s World Economic Outlook published in April. The 0.3% decline seems rather robust when compared to the 0.9% decline in GDP for Japan over the same period.
The Fed has already hiked rates twice this year and recent Fed officials have made reference to two further 50 basis point hikes in June and July in line with market expectations according to Fed funds futures.
USD/JPY Technical Levels
As mentioned earlier, the USD/JPY chart reveals multiple doji candles as the prevailing uptrend compresses due to a slightly softer dollar. Equity markets and other pro-cyclical FX pairs have clawed back losses in recent days as risk sentiment appears to have stabilized somewhat. As such, funds appear to be flowing away from the ‘safer’ USD to stocks and commodity currencies to mention a few.
Key resistance remains at 130 with support all the way back at 125. Despite the weak fundamentals, the negative divergence shown on the RSI suggests we could see lower USD/JPY prices. The indicator made lower highs while price action printed higher highs suggesting that the pause in trend could turn into a deeper pullback.
Daily USD/JPY Chart Revealing Doji Candles

Source: TradingView, prepared by Richard Snow
In addition, US 10-year treasury yields appear to be back on the rise (towards that 3% mark) which tends to support dollar appreciation.
US 10- year treasury yield
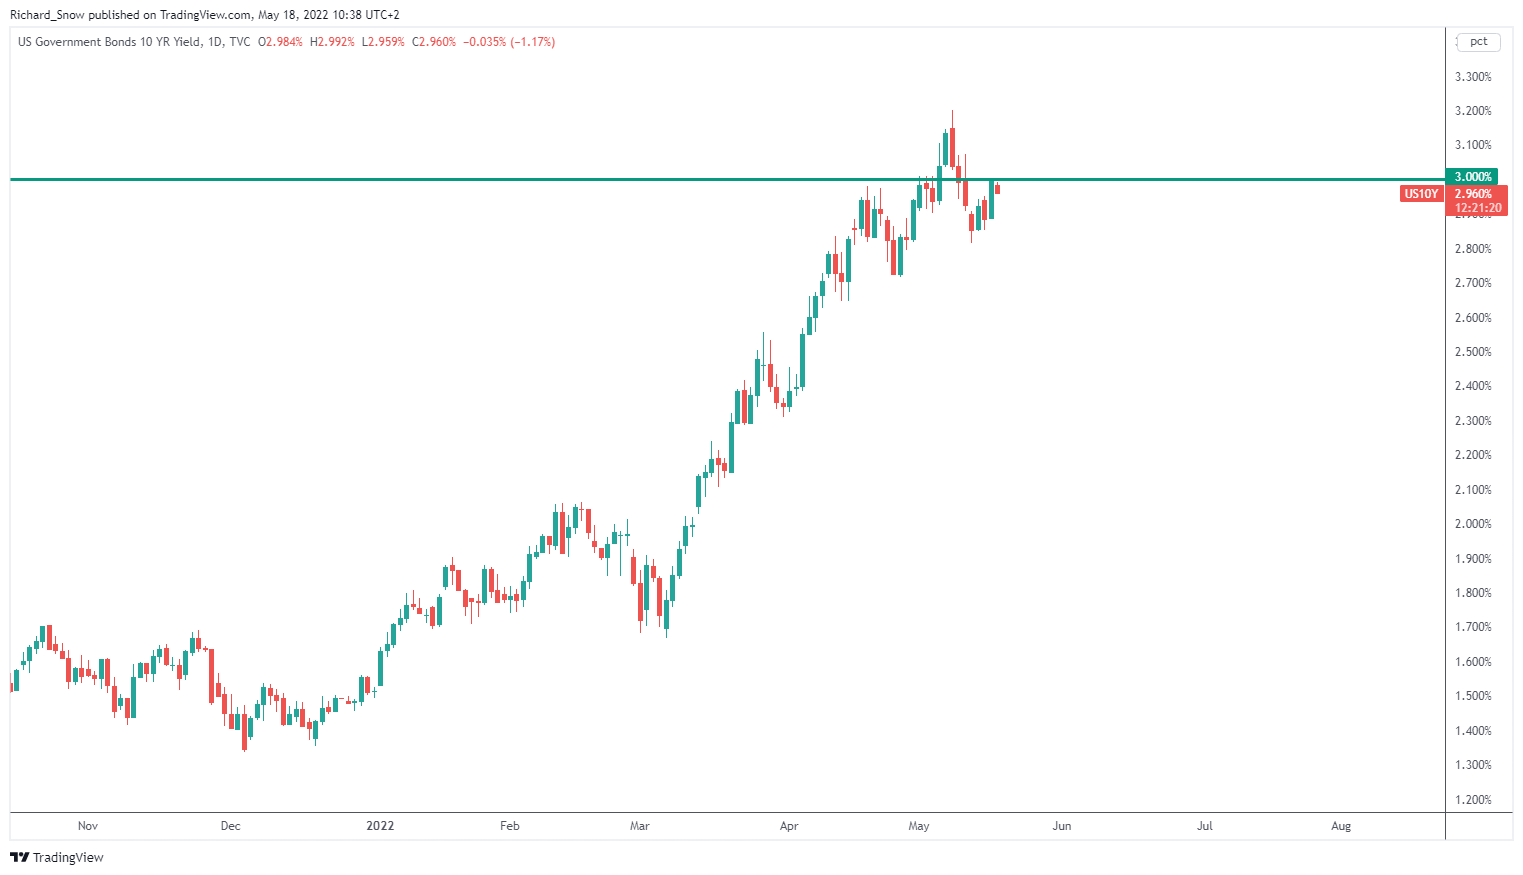
Source: TradingView, prepared by Richard Snow
In contrast, the BoJ is actively intervening in the bond market to suppress yields (borrowing costs) in an attempt to support the economy. Rising US/Japan spreads favors the dollar meaning USD/JPY could stay supported for much longer.
Japanese 10-year government bond (JGB) yield
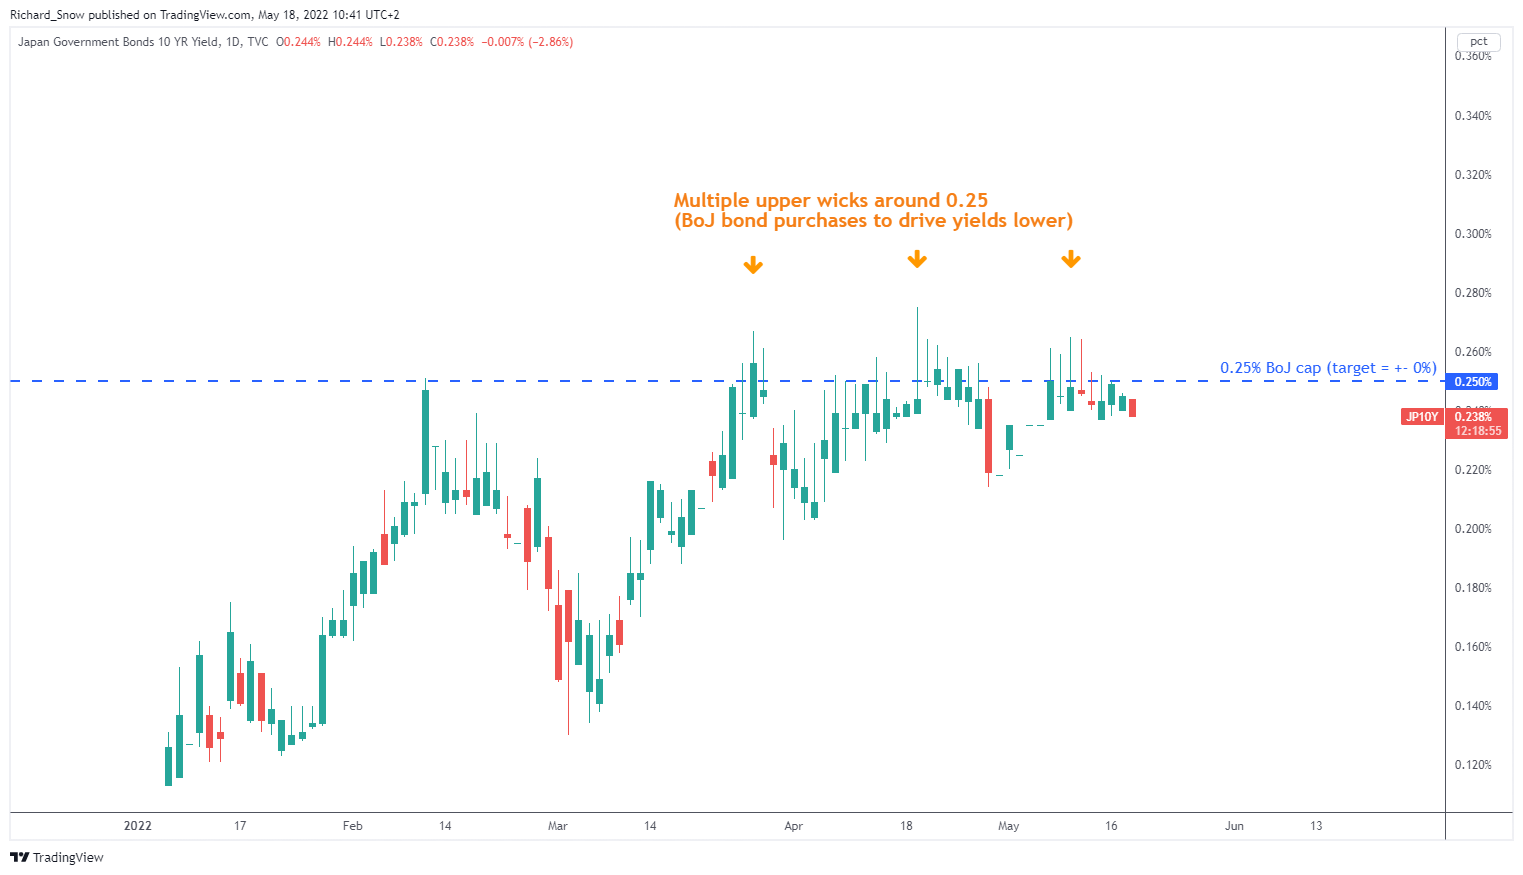
Source: TradingView, prepared by Richard Snow
— Written by Richard Snow for DailyFX.com
Contact and follow Richard on Twitter: @RichardSnowFX
Be the first to comment