

tupungato/iStock Editorial via Getty Images
Introduction
Right after ManpowerGroup (NYSE:MAN) reported earnings, we had the Dutch industry leader Randstad (OTCPK:RANJY, OTCPK:RANJF) publishing its Q3 results.
In this article, I would like to share a follow-up of the comparison I am running between the two competitors.
I will run my analysis by comparing it to ManpowerGroup’s recently reported earnings.
Summary of previous coverage
In fact, until a few years ago, ManpowerGroup (MAN) was the industry leader, but in the past decade Randstad has managed to surpass it and keep on growing, while the first one, as I already outlined in my first article on ManpowerGroup, stopped growing. A key point was the 2016 acquisition of Monster Worldwide by Randstad. However, this added only approximately $650-700 million in yearly revenue while we see that from 2017 Randstad’s revenue and gross profit sped up, leaving ManpowerGroup (and Adecco) behind.
Author, with data from Seeking Alpha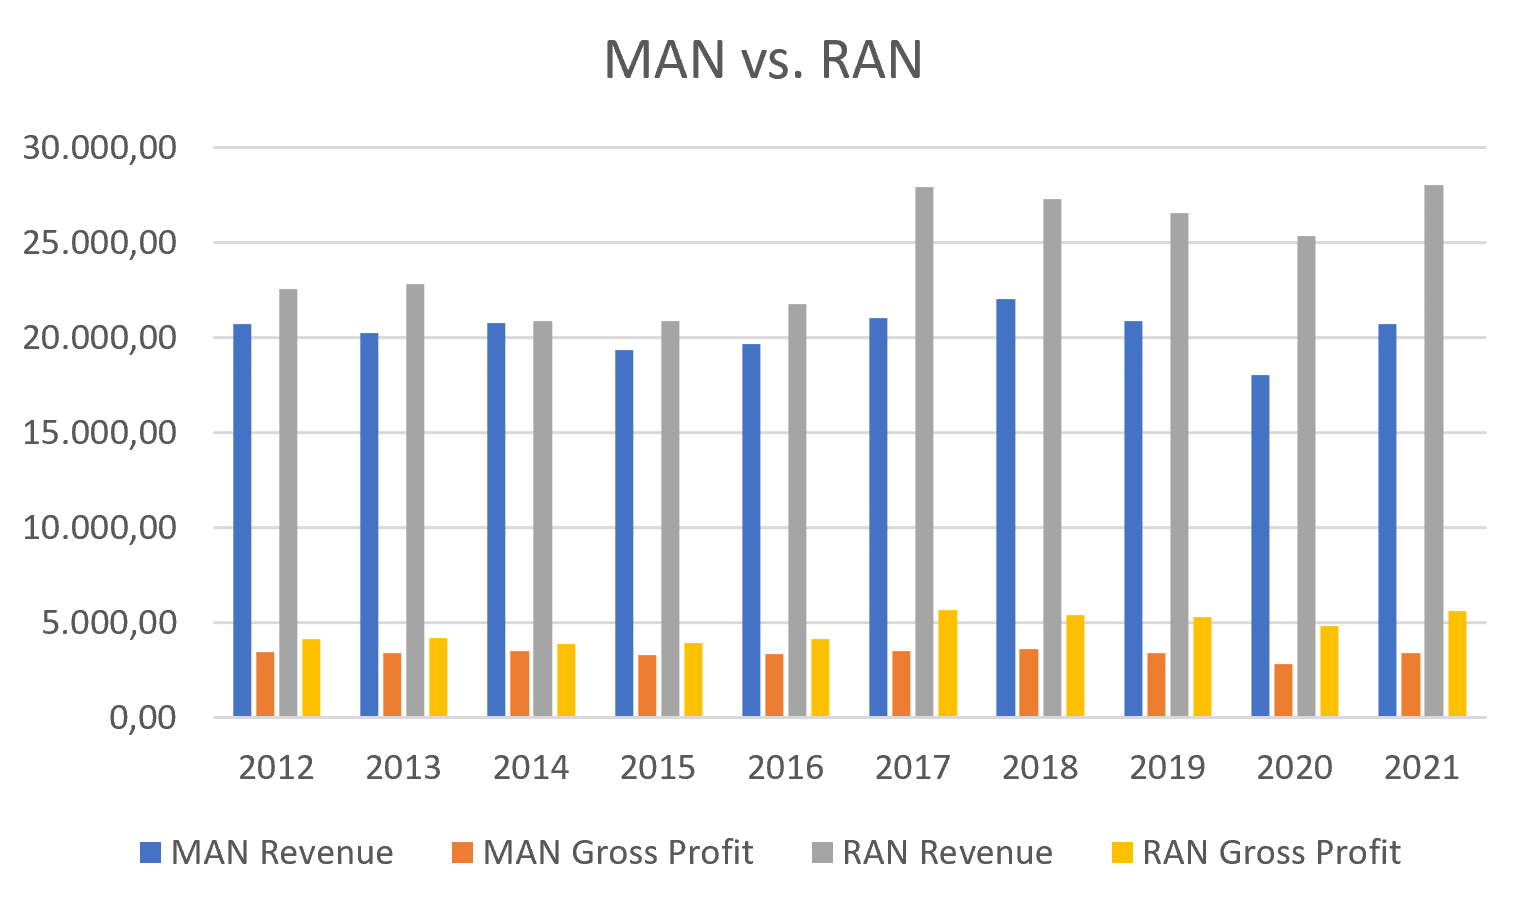
Not only has Randstad managed to catch and up with ManpowerGroup and then overcome it in terms of revenue, but it has also been performing better from a margin point of view.
So, in this comparison after both companies posted their quarterly release, we will focus on top-line growth and margins, to see if there are any major changes between the two competitors.
Before we dive in, I would like to use some data Randstad published in its last annual report to see
The Market
The addressable market is huge and it is estimated to be a little less than half a trillion, as shown in the graph below. More than half is linked to staffing, which is the most sought for service by many companies as it enables them to have a flexible workforce always on par with their real needs.
Randstad 2021 Annual Report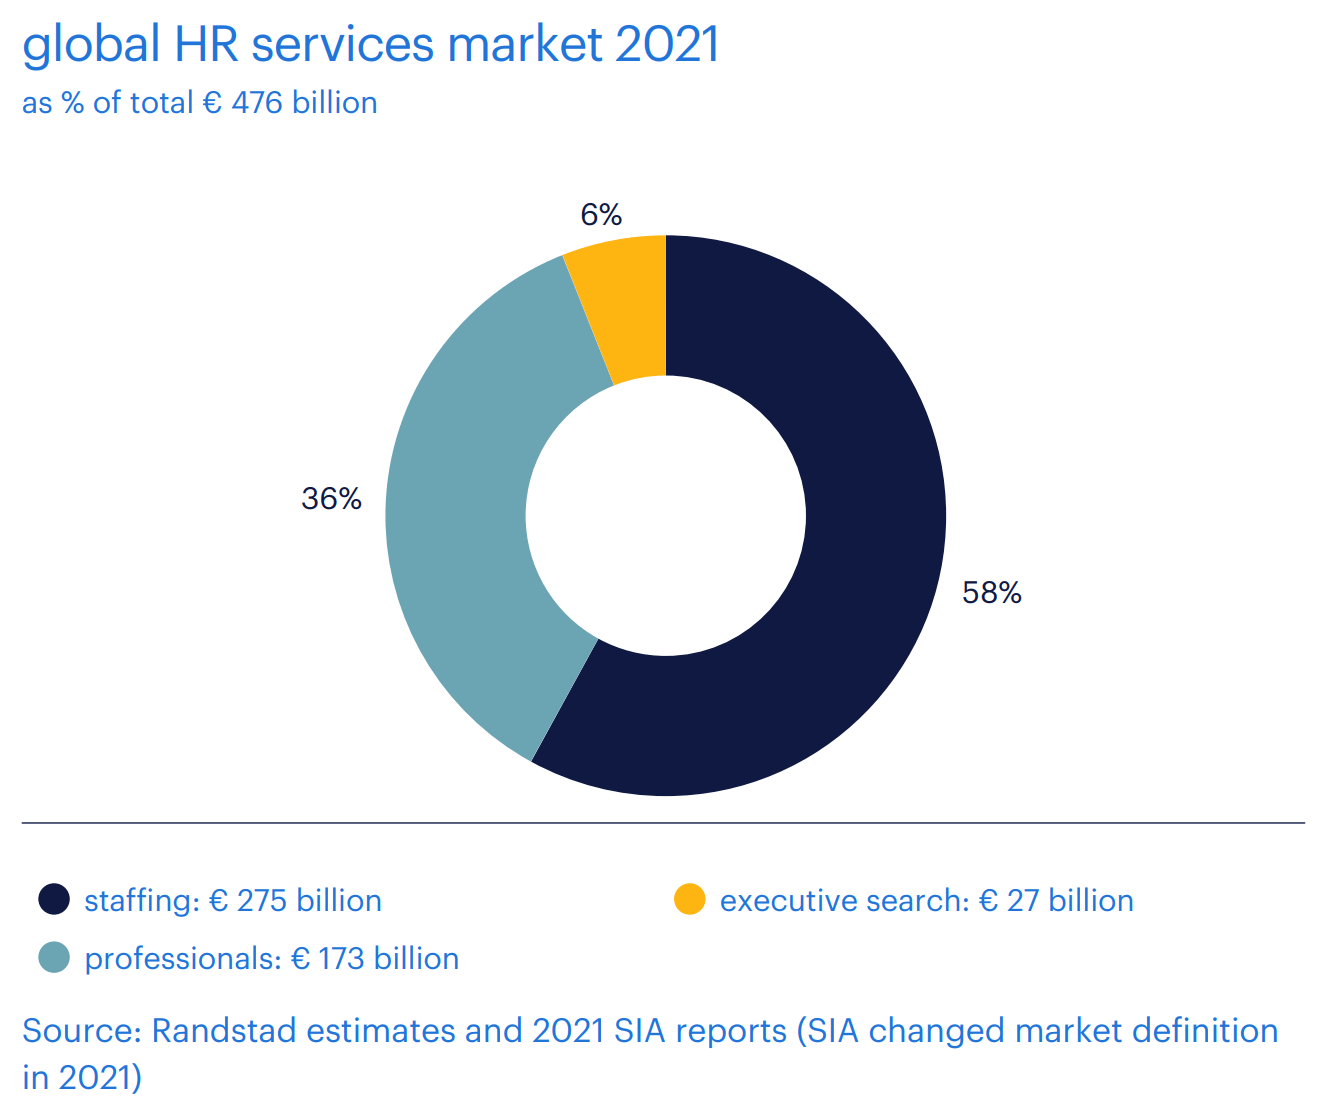
Another key characteristic of the market is that it is highly fragmented. We can see from the graph that the three main players only hold together a 13% share. I think this is caused by the fact that there is no real entry barrier that prevents new and local competitors from springing up as most of the business is run through employees who know their territory and the companies in it. Often local players come up and fare well in a certain area because they know how to deal with the local labor market.
Randstad 2021 Annual Report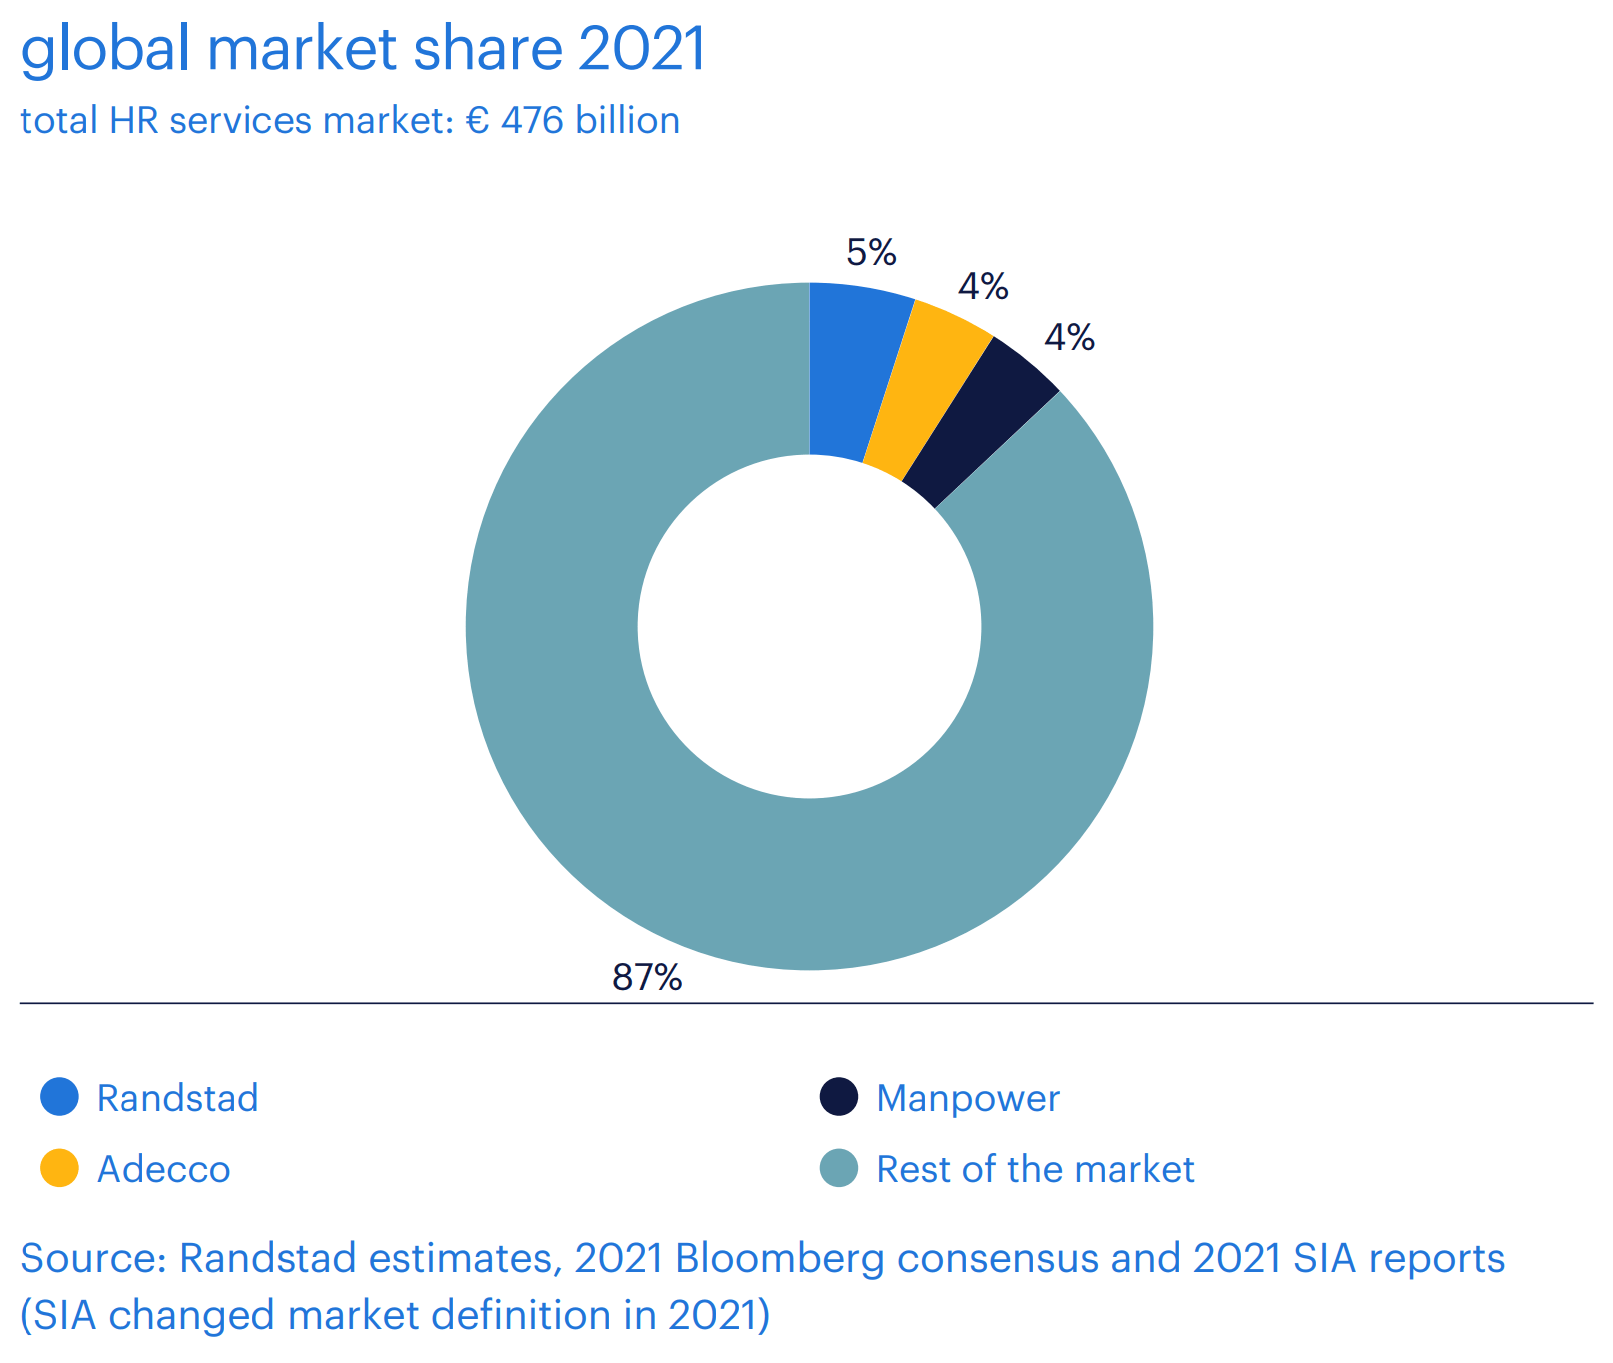
Q3 Comparison
One caveat, ManpowerGroup reports earnings in USD, while Randstad in EUR. This year, with the strong dollar, this damages ManpowerGroup versus Randstad. Since the exchange rate is now close to 1:1, I will keep the financial data in the currency each company uses.
From the top line to the bottom line
ManpowerGroup reported revenues of $4.8 billion, down 7% but up 5% on a constant currency basis. The gross profit margin was 18.3%, up 170 bps YoY.
Randstad, on the other hand, reported a quarterly revenue of €7 billion, up 12% YoY, with a gross profit of €1.48 billion, which is equal to a gross profit margin of 21%.
An important number to consider is that in the first nine months of the year, Randstad’s revenue amounts to more than €20.5 billion, which as we have seen from the column graph above, it is around the yearly revenue ManpowerGroup achieves and that has proven to be somewhat unsurpassable for this company over the past decade. Since seasonal patterns make Randstad declare that the second half of the year is usually stronger than the first, I think we can expect the company’s revenue to end the year close to €28.5 billion that gets closer and closer to the €30 billion threshold.
As per revenue categories, ManpowerGroup disclosed that its staffing unit decreased 12% as reported or grew 1% OCC. The real driver of ManpowerGroup’s growth is Experis, which focuses on professional resourcing in IT, engineering and finance and benefits from higher margins.
On the other hand, Randstad offers the category revenue breakdown and we know that from staffing the company grossed €3.25 billion, which is just a 1% organic growth YoY. Thus, the trend is somewhat confirmed that this unit flat.
Randstad is seeing its growth led by two divisions: Inhouse Services and Randstad Professionals. The former focuses on solutions for managing a workforce for which there is a fluctuating level of demand; the latter deals with middle and senior leadership positions in fields such as engineering, IT, finance, healthcare, HR, education, legal affairs and marketing & communications.
Inhouse Services grew 15% generating €1.77 billion in revenue, Randstad Professionals’ revenue came in at €1.63 billion, up 12% YoY.
Just like for ManpowerGroup, we see that there is a shift in the industry leader’s business toward higher margin services.
ManpowerGroup reported an EBITA margin expansion of 60bps to 3.6%. Randstad here outperformed once again with a 4.8% EBITA margin, up 10bps YoY.
As we move to the bottom line, we see that Randstad’s net income amounted to €230 million vs. €199 million in Q3 of the prior year, which means that it achieved a 16% growth YoY. Overall, in the first nine months of the year, net income’s growth is at 20% YoY.
On the other hand, ManpowerGroup reached $111.3 million in net income, up 13.9% YoY, but it would have been 31.2% CC. ManpowerGroup was able to improve its profitability more than Randstad over the quarter and this explains the result.
Results by geography
ManpowerGroup grossed 26% of its quarterly revenue in the Americas for a total amount of $1.2 billion. Here Randstad has a larger market share with €1.46 billion.
However, ManpowerGroup leads in France, where its revenue came in at $1.14 billion versus Randstad’s €992 million. On the other hand, Randstad leads in the Netherlands, in Germany, in Italy and in most European countries. This can be understood, given the fact that the company is European. Worth of some attention is the Italian market, where Randstad has an EBITA margin of 6.5% which is equal to the U.S. margin, making Italy a very profitable market for the company.
Both companies still have to develop their business around the world, since other regions account only for 12% of ManpowerGroup’s revenue and 7% for Randstad. This is important to know, as investors have to link the performance of these businesses mainly to the economic and labor environment in the Western world.
Balance sheet
The industry is not capital intensive and both companies don’t have huge capex. In addition, they don’t have a lot of debt, with ManpowerGroup having a net debt position of $585 million which is 0.77x the yearly EBITDA. Randstad increased its net debt by 188% YoY to €675 million, but this is still just 0.4x the yearly EBITDA. The increase in net debt for Randstad is due to the recent acquisitions that were completed and that I discussed in my first comparison between the two companies. Overall, they both have very healthy balance sheets, able to support interesting dividends and further investments for new acquisitions.
Conclusion
After the results, I confirm my first take. While I rate ManpowerGroup as a hold, since I think it is trading around its fair value of $76 per share, I see Randstad’s stock as the more promising one among the two, as its price still has to catch up with the overall trend of its growing fundamentals. The company is the one that is managing to keep on growing, as we have seen and this is in a discounted cash flow model we can project an expected growth rate for the next five years of 2.5% against ManpowerGroup’s which has gotten us used to almost no top line growth. For those interested, I suggest going over the discounted cash flow models I shared in my previous articles. For the time being, I reiterate my ratings: hold on ManpowerGroup, buy on Randstad.
Be the first to comment