

Evkaz
The Mortgage Bankers Association reported that mortgage delinquencies dipped to the lowest levels the group has ever recorded. Will that last? Will the unemployment rate remain low and excess savings stay high?
These are key questions for mortgage insurers. Traders seem to think losses could be on the rise given very soft valuation across the thrift institution and mortgage insurance space.
2022 Looks A Lot Different Than 2008
Mortgage Bankers Association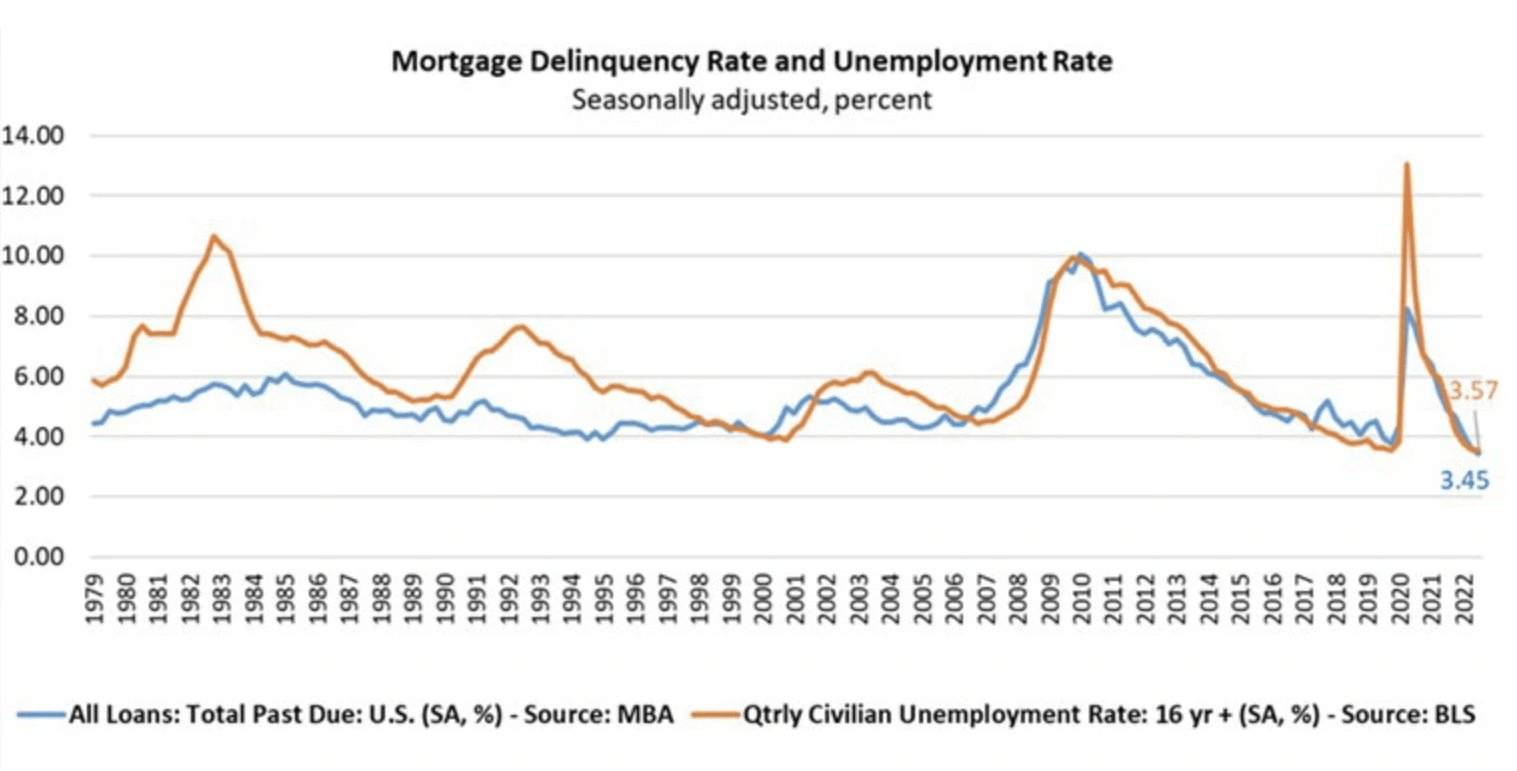
According to Bank of America Global Research, Radian Group (NYSE:RDN) provides mortgage insurance and risk management services to lenders throughout the U.S. The company operates through two segments: Mortgage Insurance and Mortgage and Real Estate Services. RDN is one of the largest private mortgage insurance companies in the country by insurance in force.
The Pennsylvania-based $3.2 billion market cap Thrifts & Mortgage Finance industry company within the Financials sector trades at a low 4.6 trailing 12-month GAAP price-to-earnings ratio and pays a high 4.0% dividend yield, according to The Wall Street Journal.
Radian has mortgage insurance operations that are generally less cyclical than its peers. Still, recession risks post problems and should at the very least result in higher loan loss reserves than was thought a few quarters ago. It appears much of that pessimism has been discounted into the stock price since the firm trades at just 0.85 price to book, below its 5-year average of 1.07, according to Seeking Alpha.
A particular risk for Radian is its mortgage origination business which should see steep year-on-year declines due to what will likely become a real estate depression for a time. Other mortgage insurers trade around 7.5x earnings, so RDN is at a bit of a discount. Other risks include increased competition leading to softer margins along with uncertain regulatory and forbearance issues.
On valuation, analysts at BofA see earnings having climbed big in 2021 and 2022, but EPS declines are forecast next year through 2024. The Bloomberg consensus forecast shows weaker per-share profits this year, but then more sanguine results in 2023 and 2024. Dividends should hold steady at $0.80. Just last week the company announced a quarterly payout of $0.20 along with purchasing 11.1% of shares outstanding. Those are upbeat signals given the dismal macro landscape.
RDN’s operating and GAAP P/Es look attractive here along with those shareholder accretive activities in the face of macro risks. Overall, I generally agree with Seeking Alpha’s B+ valuation rating.
Radian: Earnings, Valuation, Dividend Forecasts
BofA Global Research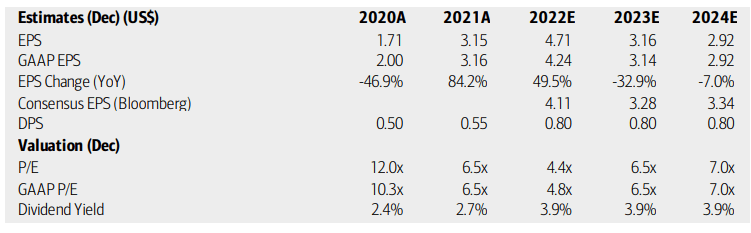
Looking ahead, corporate event data provided by Wall Street Horizon show an unconfirmed Q4 2022 earnings date of Tuesday, February 21 AMC. Before that, however, there is an ex-div date of Friday, November 18.
Corporate Event Calendar
Wall Street Horizon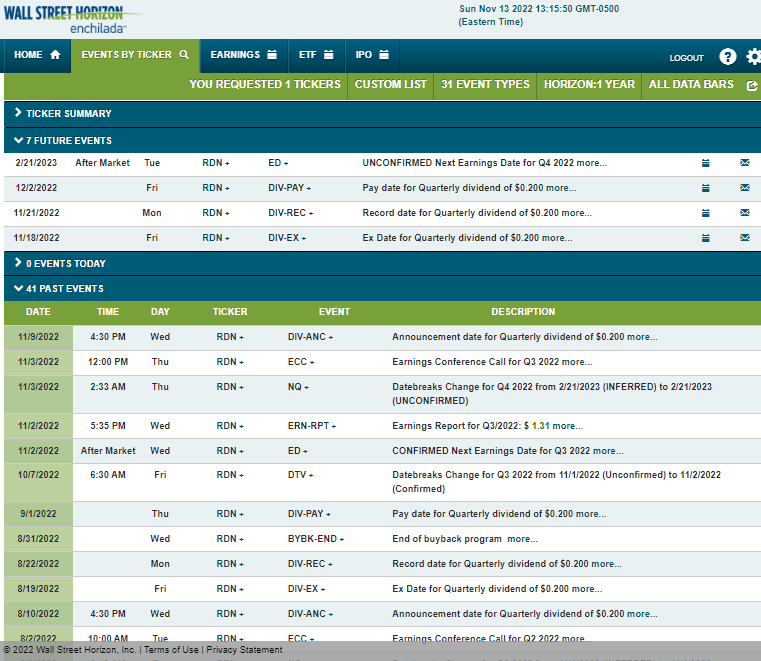
The Options Angle
Looking back on earnings last week, data from Options Research & Technology Services (ORATS) show an impressive EPS beat of $1.31 versus a consensus forecast of $0.77. The stock traded marginally lower post-reporting while options traders had priced in a 5% stock price swing.
Earnings are seen as increasing by about 10% in its Q4 report. ORATS also shows seven analyst EPS upward revisions after four consecutive bottom-line beats. I’m impressed with Radian’s earnings resiliency.
Radian: Four Straight Strong EPS Beats
ORATS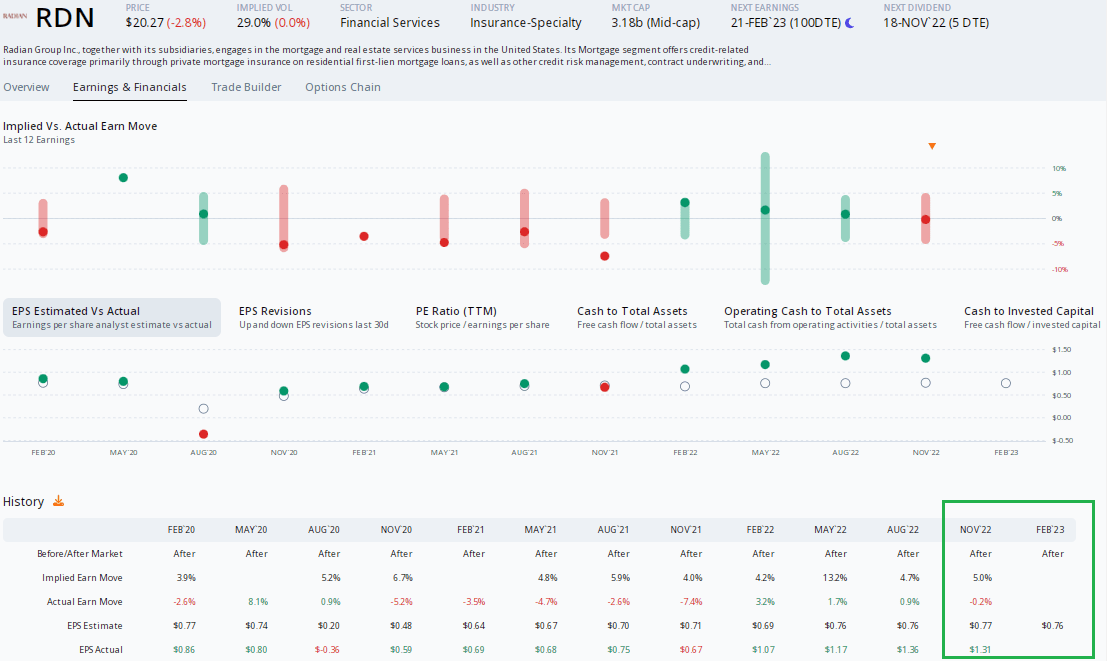
The Technical Take
RDN’s valuation picture and earnings history appear solid, but the chart leaves something to be desired. I see a downtrend resistance line off the late 2019 peak near $26. The stock needs to move above $24 to help confirm a bullish breakout. I do see support near $18, so it is by no means a protracted downtrend.
What is particularly bearish is a high number of shares traded in the $22 to $24 range, evidenced by the volume-by-price indicator on the left. That’s another key area of bearish supply.
Overall, the trend is slightly down, so technicals suggest a soft sell.
RDN: A Multi-Year Downtrend, But Support Seen
Stockcharts.com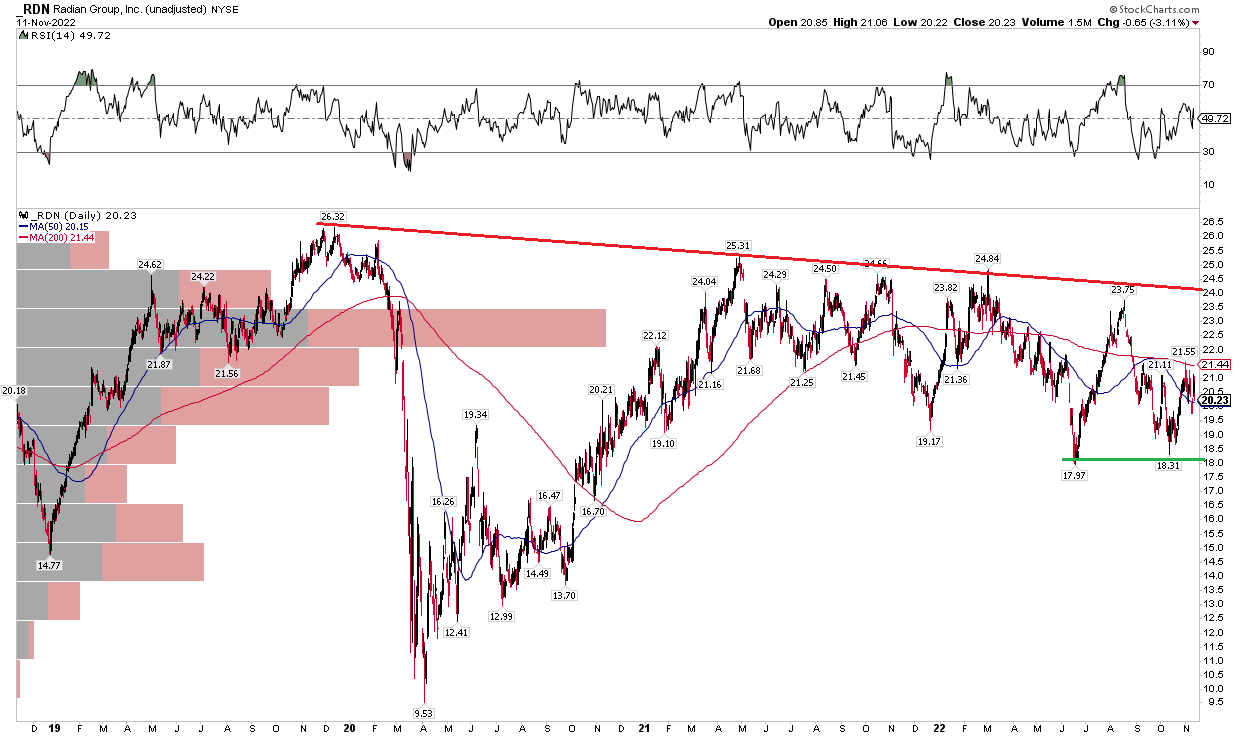
The Bottom Line
I like the value case on RDN even with a lackluster chart. Its shareholder accretive activities and earnings resiliency are hard to ignore. I think buying on the dip under $19 is a good play here with a stop under $18.
Be the first to comment