

Konoplytska
Introduction
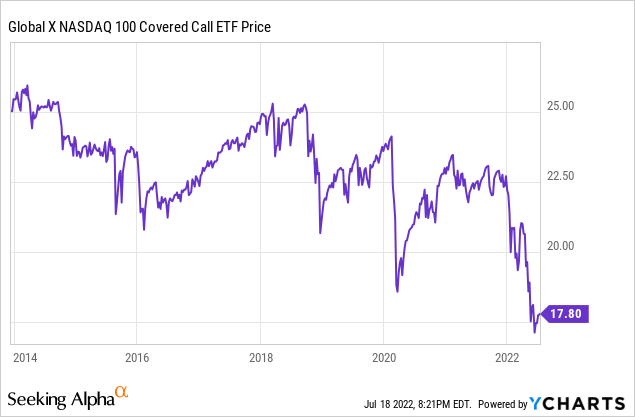
The Global X NASDAQ 100 Covered Call ETF (NASDAQ:QYLD) attempts to generate income for investors by selling covered calls on NASDAQ stocks. The fund charges an expense ratio of 0.60%. The last monthly distribution amounted to $0.1735 per share, or about an 11.7% yield.
1. The Distribution Yield Includes A Return Of Capital, The True Yield Is Lower
When exchange-traded funds (“ETFs”) pay a distribution, it can either be a return of capital, a capital gain, or a real earnings payout, usually from dividends or interest received from the fund’s holdings. These can all be treated differently for tax purposes depending on an investor’s situation and jurisdiction. Global X publishes what they expect their distributions for QYLD to count as for U.S. investors at this link. What many people don’t realize is that a return of capital is not in fact a return on the money you’ve invested, but rather simply a return of capital you had previously put into the fund with no positive return whatsoever.
The idea with QYLD is to sell calls on the NASDAQ 100 index to generate additional income while holding the underlyings. This is then paid out as distributions. Too often, investors assume the full 12% yield is what the fund collects in covered call premiums. Unfortunately, that is not the case. One needs only to look at the October 2021 Form 19a (the last one of that fiscal year for this ETF) to see that a mere $0.03 of the total $2.58 distribution for the year was investment income. The rest, 99% of the entire year’s distribution, was entirely a return of capital.
QYLD Fiscal 2021 Distribution Classification (Global X ETFs)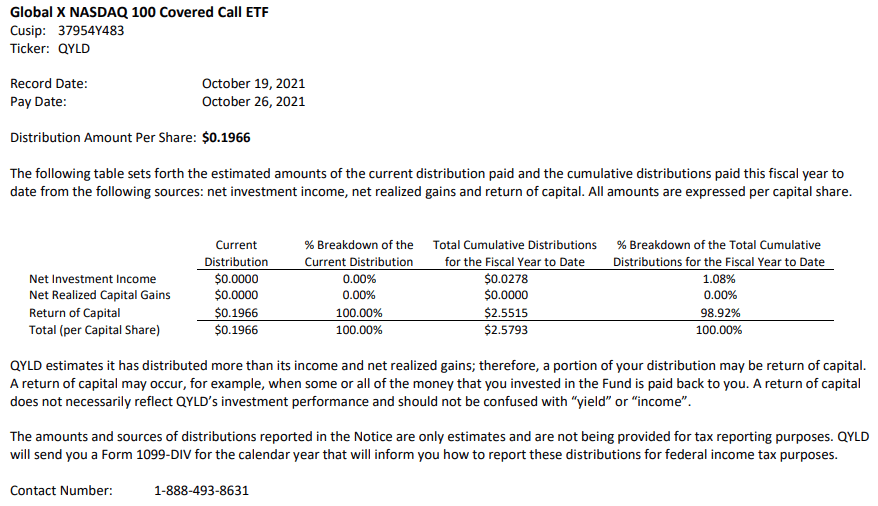
In fact, Global X puts it right on Form 19a that “A return of capital does not necessarily reflect QYLD’s investment performance and should not be confused with “yield” or “income.”
That said, this is not the case every year. So far in fiscal 2022, the ETF estimates that a majority of its distribution will in fact be a realized capital gain, and a small amount of investment income rather than a return of capital.
QYLD Fiscal 2022 Distribution Classification (Global X ETFs)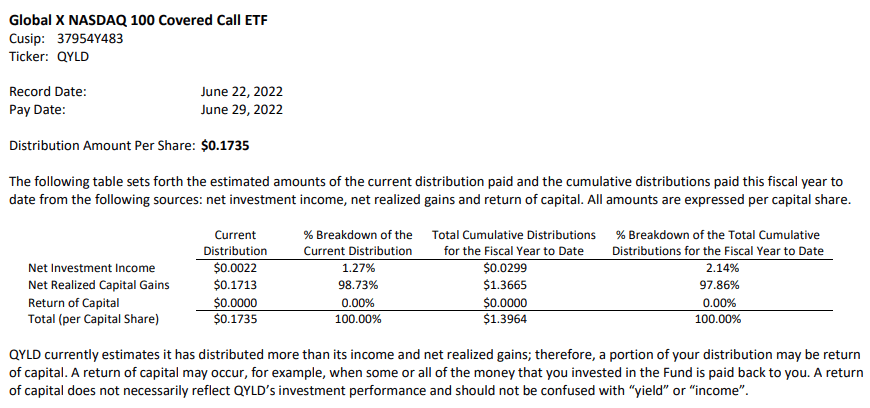
2. All The Risk With Capped Upside Result In Poor Risk-Adjusted Returns
Comparing ETF’s performance including distributions reinvested is a relatively straightforward process with free tools such as portfoliovisualizer.com. Using this website, we can examine how QYLD has done relative to the Invesco Nasdaq 100 ETF (QQQM) or a high dividend yield ETF such as the Vanguard High Dividend Yield ETF (VYM) since QYLD’s inception in 2013, including the risk-adjusted metrics of the Sharpe Ratio and the Sortino Ratio.
portfoliovisualizer.com
The result is not good for QYLD. The fund has severely underperformed, returning to shareholders only about a 6% compound annual growth rate since inception. Furthermore, one can clearly see the fund’s capped potential with its best year of just 22.7% compared to QQQ’s best year of 48.4% (remember, the underlying holdings here are nearly the same). In the worst year, QYLD sank significantly less than QQQ, but more than VYM. That said, QYLD does seem to avoid drawdowns better than these other two ETFs, although I would argue QYLD’s max drawdown of -17% is not a whole lot different than VYM’s -24%. Less severe drawdowns come at the great cost of returns though, with QQQs CAGR being nearly three times greater than QYLD and VYM’s CAGR being more than 50% better.
When looking at the risk-adjusted ratios, it becomes clear. QYLD lags far behind these other two options on both its Sharpe ratio and Sortino ratio.
Now, past returns are not indicative of future results, we have certainly seen that this year with the Nasdaq falling considerably. But it’s the strategy of QYLD that leads to these poorer returns consistently over time, and I simply don’t see that changing with the fund’s current structure. By holding the same underlyings, QYLD is exposed to much of the same risks as other ETFs, meanwhile, by selling calls, one’s upside is capped in the event of a market rebound. This severely cuts short one’s potential capital gains in such a fund, and as we’ve already seen, the distribution isn’t entirely investment gains.
3. Easy To Replicate Yourself With Greater Flexibility
QYLD’s strategy is simple. Hold Nasdaq 100 stocks and sell calls against it. However, an investor in QYLD has no control whatsoever over what calls they sell and when.
An investor could relatively quickly and easily replicate such a strategy with QQQ, but with much greater flexibility. Options on QQQ are extremely liquid, and can easily be traded in and out of. A relatively simple strategy could be to sell calls against QQQ when QQQ is within 10% of the all-time high, and not when it is below 10% from the all-time high. This would result in some income generation when the ETF is high, and not cap your rebounding upside potential when the ETF is low. A more advanced strategy could be to only sell calls when implied volatility is high, and thus a larger premium would be collected for a call. Such strategies would grant an investor much more freedom with only marginally more effort. An investor could even deploy such a strategy on a high dividend ETF like VYM with a similar effect.
Final Thoughts
Ultimately, QYLD isn’t entirely what it appears to be. The quoted 12% distribution yield, while technically correct, is not one’s investment return or income as it often involves a return of capital. QYLD’s risk-adjusted returns, as well as absolute returns, leave a lot to be desired, and investors may just be better off replicating such a strategy themselves.
Be the first to comment