

JHVEPhoto/iStock Editorial via Getty Images
The “value drought” of the 2010s made investors rethink how they define inexpensiveness in the equity universe.
In the past, Price/Earnings- and Price/Book-driven models were deemed sufficient for creating a passable value portfolio; later, the rise of intangible assets rendered the approaches that were considered adequate irrelevant. And in a few of my ETF analysis articles on Seeking Alpha, I elaborated on the weaknesses of such minimalist methodologies that are on the brink of being outright facile.
Thankfully, funds with better strategies are aplenty. Today, I would like to take a closer look at the Alpha Architect U.S. Quantitative Value ETF (BATS:QVAL), a fund leveraging a proprietary value & quality-centered model capable of creating cheaper portfolios with impressive profitability characteristics.
Please take notice that the ETF was launched in 2014 as an actively managed vehicle, yet in 2017, it switched to a passive index-based strategy, and then returned to an active one. Though these shifts might mean returns before January 31, 2022, when QVAL abandoned the index, are essentially irrelevant, the basics of its value strategy have not been changed meaningfully, thus in the performance analysis section, I will be looking into total returns since inception.
QVAL’s proprietary stock-selection model is not linear earnings- or book-value-centered. Its selection universe consists of liquid U.S. exchanges-traded names; ADRs, REITs, financial firms, ETFs, and those with insufficient data are removed. The minimum market cap in the universe is about $1 billion. The remaining securities face tough proprietary “value trap” tests, including, for instance, the analysis of accruals. Next, to find the most attractively priced names, the fund looks at Total Enterprise Value/Earnings Before Interest and Taxes, a solid choice as it is mindful of debt. At times, heavy debt levels result in elevated Returns on Equity and low P/Es, leading to incorrect conclusions and investment decisions that after all disappoint. Other traditional multiples like P/E are also assessed. Finally, “current profitability, stability, and recent operational improvements” are analyzed to select 50 to 100 stocks from the cheapest cohort, which are then weighted equally. More details can be found on the fund’s website.
QVAL: solid value exposure, impeccable quality, and even a few surprises on the growth side
In the current version, QVAL features 50 stocks, with the principal ten accounting for a reasonable 23.4% of the net assets.
The fund is somewhat skeptical about the mega-cap universe, with ConocoPhillips (COP), an oil & gas exploration & production company with operations principally in the Lower 48 (the Permian Basin, Eagle Ford, etc.), being the only representative of the league. It is worth mentioning that COP’s market value has soared this year on the back of the oil price rally supercharged by geopolitics, and is now standing only slightly shy of an all-time high of about $163.5 billion.
At the same time, about 50.5% of the net assets are parked in mid-caps, or stocks with less than $10 billion in market value. There is little surprise here as the size discount inherent to smaller companies makes that universe a treasure trove for value-seeking stock pickers. The weighted-average market capitalization is at approximately $18.9 billion, with the median marginally north of $10 billion, as per my estimates.
QVAL is pronouncedly bullish on the energy sector, with about 37.4% allocated to the oil & gas (including refining) names. It should be noted that being overweight petroleum players is a rarity among well-known large-AUM value-centered funds. For instance, the iShares S&P 500 Value ETF (IVE) has just 8.3% allocated to the sector, while the Invesco S&P 500 Pure Value ETF (RPV) deployed about 11%.
Next, QVAL sees opportunities in materials, with around 24.6% allocated to it, and Steel Dynamics (STLD) is the largest holding from the sector, with 2.57% weight.
In the meantime, the fund completely ignores financials, in line with the methodology. Real estate, healthcare, utilities, and communication companies have also failed to qualify. Also, there is just one stock from the consumer staples sector, Tyson Foods (TSN), with a 1.6% weight. As I explained in a recent article on the Invesco S&P 500 Equal Weight Consumer Staples ETF (RHS), though the sector is rich with incredible quality stories, valuation leaves a lot to be desired, so there is no coincidence defensive plays are underrepresented here.
Calculated by the author using data from Seeking Alpha and the fund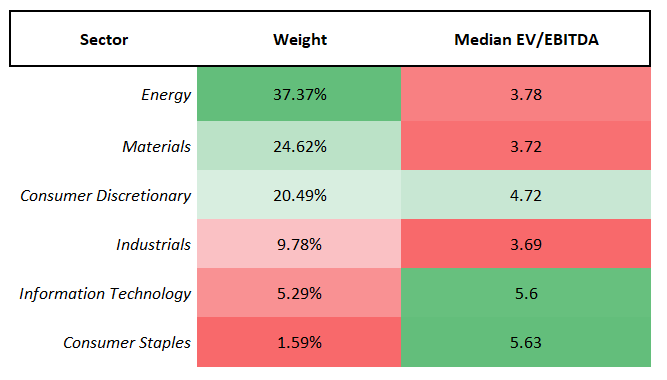
Did QVAL succeed in selecting top-quality value stocks? The answer is yes, and grossly.
First and foremost, let us look at the LTM P/E ratio. Though the metric is not the ideal one, there is no denying the Street is enamored of it. The fact is, the weighted-average P/E of this portfolio, as per my calculations, is below 6x, a phenomenal level. There is little wonder that the driver of this ultra-low ratio is the energy sector thanks to the inherent inexpensiveness of oil & gas companies compared to other sectors even during periods of strong petroleum price performance. Next, the weighted-average P/S is also comparatively cheap, at around 1x, while EV/Sales is ~1.1x.
Another metric of interest is EV/EBITDA, a substitution for TEV/EBIT I would like to use this time, a ratio mostly similar to it, also reflecting a company’s debt burden, yet with the difference being depreciation & amortization (at times, some one-off items) added back. The ratio is just 4.16x, fairly appealing for my taste. What about the net operating cash flow yield? It is about 18.6%. Again, I am impressed.
Now, quality. Just 4% of the net assets are allocated to stocks with a C or C+ Quant Profitability rating. The rest have B- or better. Cash-burning companies are absent. Looking at the financial position, over 89% have Total debt/EBITDA below 2x. And finally, the figure that might leave capital efficiency-focused investors speechless for a moment. QVAL’s weighted-average Return on Total Capital is about 24%. Nothing short of impressive.
Ultimately, growth. Above, I said that the fund is overweight energy equities, with special attention paid to exploration & production companies, or those most leveraged to the crude oil price. And weighted-average forward revenue growth of over 23%, a phenomenal result, does not look that surprising in this regard. Meanwhile, the WA Forward EPS growth is 31%, which is simply astounding.
Performance: did QVAL’s unique strategy deliver?
Unfortunately, though QVAL’s current portfolio offers an incredible blend of value with quality (and even growth), which points to the strategy’s potency and efficacy, it does not necessarily mean past returns would support a bullish view.
The fact is, it grossly underperformed the iShares Core S&P 500 ETF (IVV) since its inception despite a few bright spots like 2016, 2017, 2021, and 2022 to date when it outpaced the bellwether vehicle. It also failed to keep pace with RPV; the high standard deviation is yet another disappointment.
| Portfolio | QVAL | IVV | RPV |
| Initial Balance | $10,000 | $10,000 | $10,000 |
| Final Balance | $15,406 | $23,519 | $18,104 |
| CAGR | 5.49% | 11.16% | 7.62% |
| Stdev | 23.02% | 15.69% | 21.26% |
| Best Year | 33.40% | 31.25% | 33.49% |
| Worst Year | -17.28% | -13.18% | -12.30% |
| Max. Drawdown | -42.00% | -23.93% | -41.55% |
| Sharpe Ratio | 0.31 | 0.7 | 0.41 |
| Sortino Ratio | 0.44 | 1.07 | 0.58 |
| Market Correlation | 0.87 | 1 | 0.87 |
Created by the author using data from Portfolio Visualizer. Based on the returns for the November 2014 – November 2022 period
The table below shows whether QVAL outperformed IVV over certain periods; alpha months and years are highlighted in green.
Created by the author using data from Portfolio Visualizer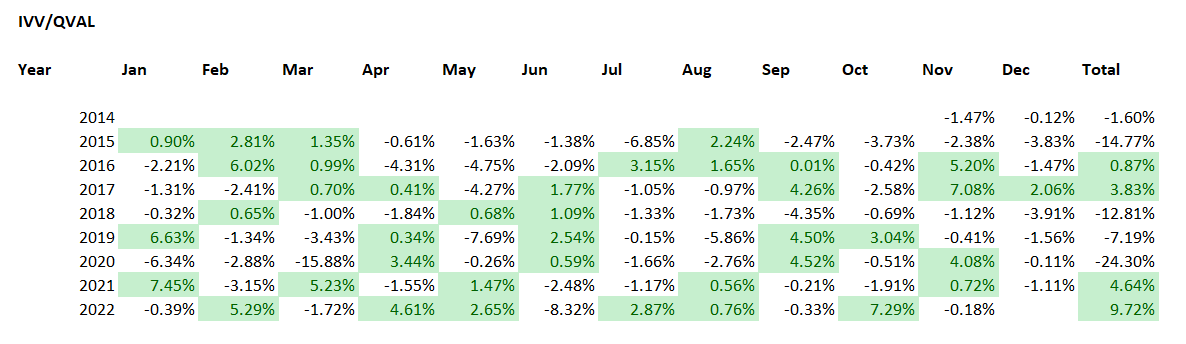
The next table illustrates that QVAL delivered better returns than RPV only in 2017 and 2020.
Created by the author using data from Portfolio Visualizer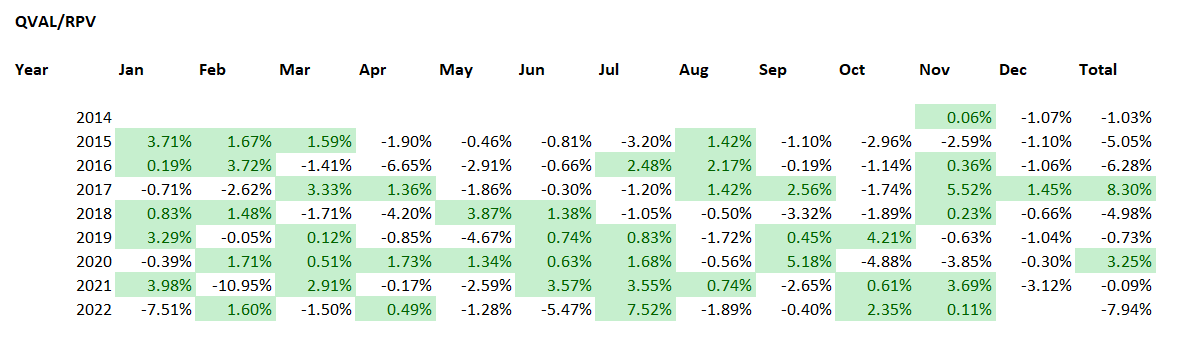
Summing up
Whether the Fed pivot or not, QVAL’s focus on value & quality is one I wholeheartedly appreciate.
The ETF has solid value exposure, impeccable quality, and even a few surprises on the growth side, partly owing to the current stage of the commodity cycle. But although I am constructive on this fund, there are a few issues worth elaborating on.
First, though it has impressive earnings and cash flow yields at the levels that investors in IVV could only dream about, they are so substantial owing principally to the fact that QVAL is overweight the capital-intensive oil & gas industry, and I believe a share of stocks with no less than a B- Quant Valuation grade (which shows how a company’s multiples compare to the sector and the historical averages) is a better indication of whether the portfolio is priced attractively. The fact is, it is only 44%, while 29% are comparatively overvalued (D+ and worse).
Also, as I said above, the main ten holdings account for a modest share of the net assets owing to the equal weighting. The problem is that other risk indicators are somewhat unsatisfying, to say the least.
Seeking Alpha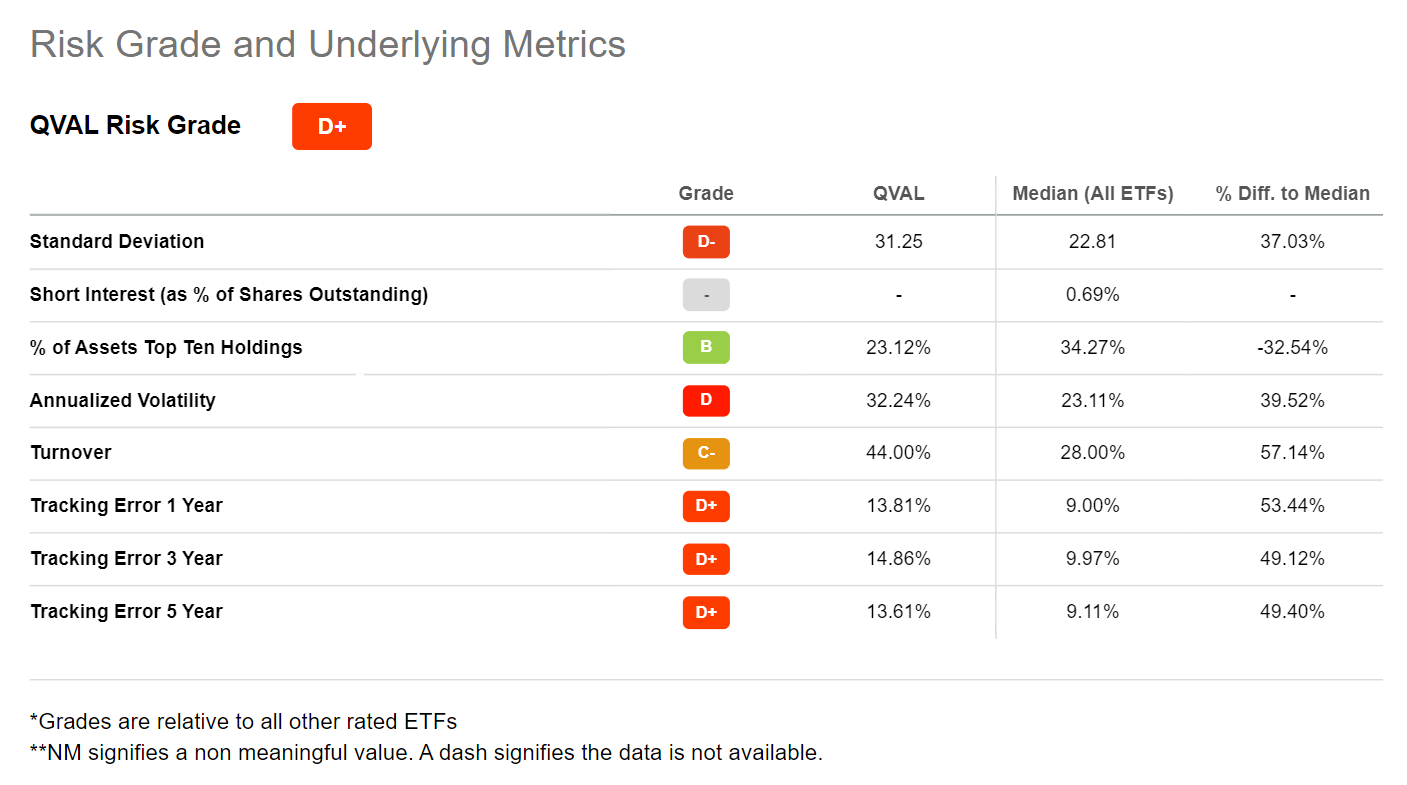
In sum, owing to the advantages/downsides mix, QVAL is a Hold.
Be the first to comment