


SeppFriedhuber/E+ via Getty Images
Well, the QQQ (NASDAQ:QQQ) rally not only melted away quickly, but was also vaporized. The QQQ ETF has plunged, dropping by nearly 9% just since Thursday afternoon. The selloff picked up steam once the CPI report showed that inflation rates did not peak in March and that the Fed was even further behind the curve than investors thought. This sent rates across the yield curve soaring.
Real yields have risen quickly, with the 10-Yr TIP rate rising to nearly 55 bps, a massive move in just a couple of days. As these real yields continue to increase, it is dragging the earnings yields of the Nasdaq 100 higher, which continues to compress PE multiples. The higher these real yields climb, the lower the PE ratio for the QQQ and the Nasdaq 100 will fall.
Equity Risk Premium Too Low
The spread between the Nasdaq 100 earnings yield and the 10-Yr real yields is relatively tight and not pricing in enough risk, suggesting that the equity risk premium of the QQQ ETF needs to rise.
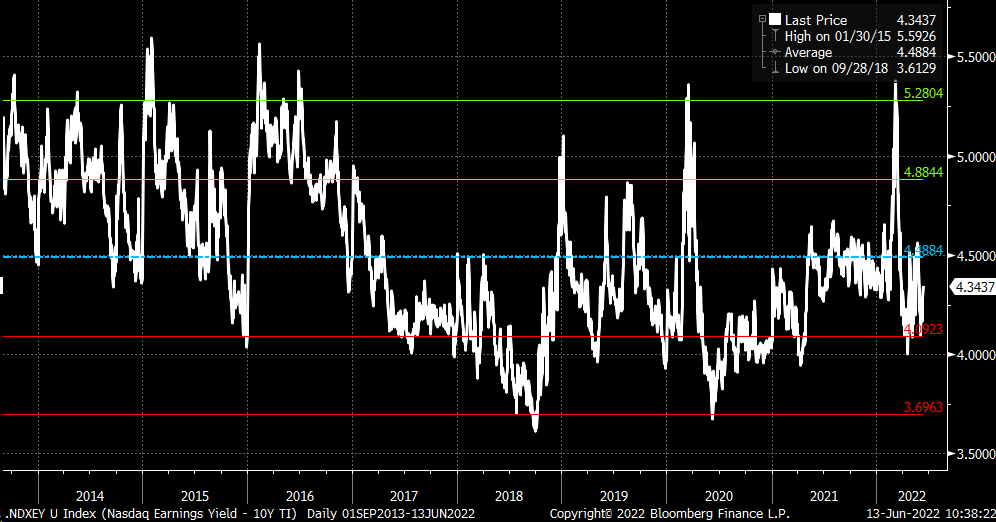
Bloomberg
Since 2013, the average spread between the Nasdaq 100 earnings yields and the 10-Yr TIP rate has been 4.5%. Historically, the spread between the two has peaked around 5.3%, which is nearly 80 bps higher than the current spread of 4.35%. For the spread to reach that level, assuming the 10-Yr TIP rate remains unchanged, the Nasdaq 100 earnings yield value would need to rise to around 5.7% from its current value of 4.9%, moving the PE ratio on the Nasdaq from its current 20.4 to around 17.5, or 14% lower than its current value.
That move in the earnings yields for the Nasdaq 100 might make sense, and it may even need to go higher. Consider that in 2018, the earnings yield of the Nasdaq 100 peaked at around 6%, or 1.1% higher than its current value. Additionally, nominal rates for the 10-yr Treasury have moved above and beyond their 2018 rate peaks. It seems then that the earnings yield for the Nasdaq 100 is too low and should be dragged higher by rising rates.
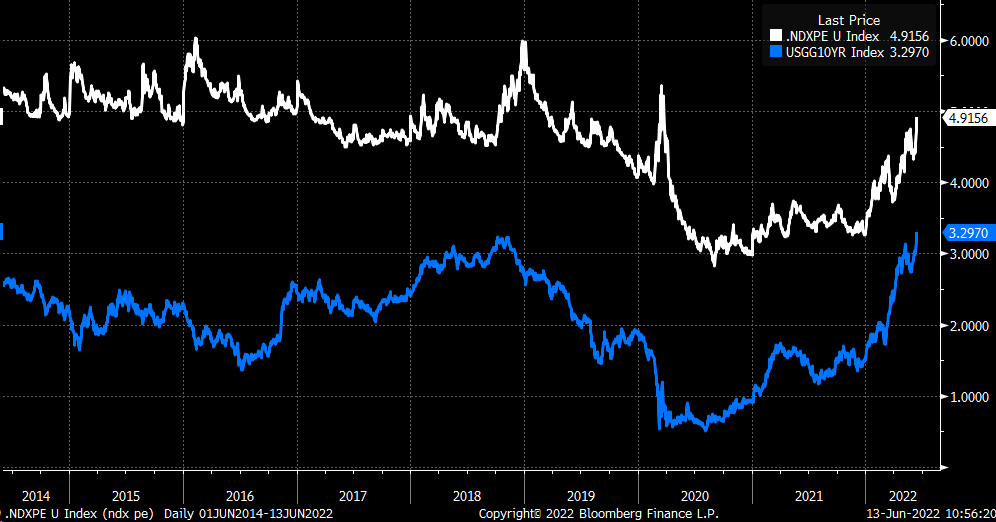
Bloomberg
A 14% decline in the PE multiple of the Nasdaq 100 would translate to a 14% decline in the QQQ, assuming earnings estimates do not change. That would result in the QQQ ETF dropping to around $235, taking the ETF back to its pre-pandemic high, a level I mentioned could occur just a few weeks ago.
Deleveraging
Rising rates are just one reason for the QQQ ETF to drop further. But on top of that, a massive amount of deleveraging is taking place as investors cash out of stocks and park their money into money market funds, as evidence supported by the surging usage of the Fed Reserve Repo facility. That usage reached more than $2.16 trillion on Friday and has steadily risen since the middle of March. The higher the use of this Fed facility, the more deleveraging is taking place in the market.
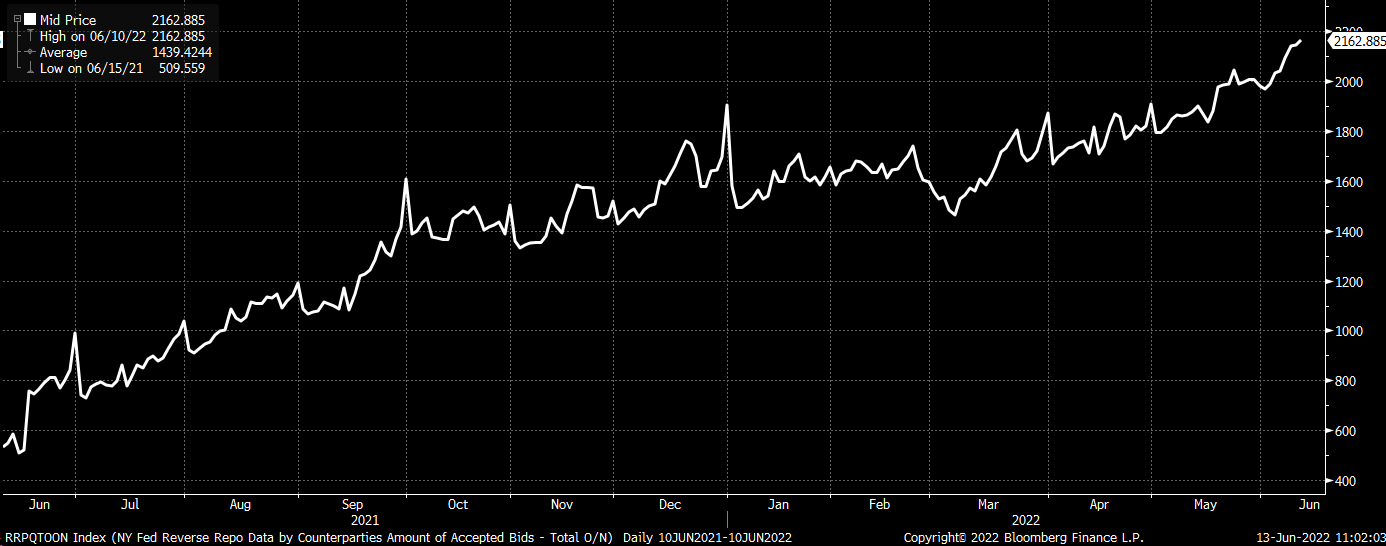
Bloomberg
Technicals Remain Bearish
From a technical basis, the QQQ’s relative strength index has been steadily trending lower and hasn’t even reached oversold conditions. The RSI is still at 33.5 and must fall below 30 before signaling an oversold condition. At this point, that has not happened yet.
There are some key support levels to watch for the QQQ, with the first coming at $267. After that level comes $252, and then the pre-pandemic highs around $237. They each represent periods of prior consolidation; if one of them breaks, it signals the next support level is likely to come.
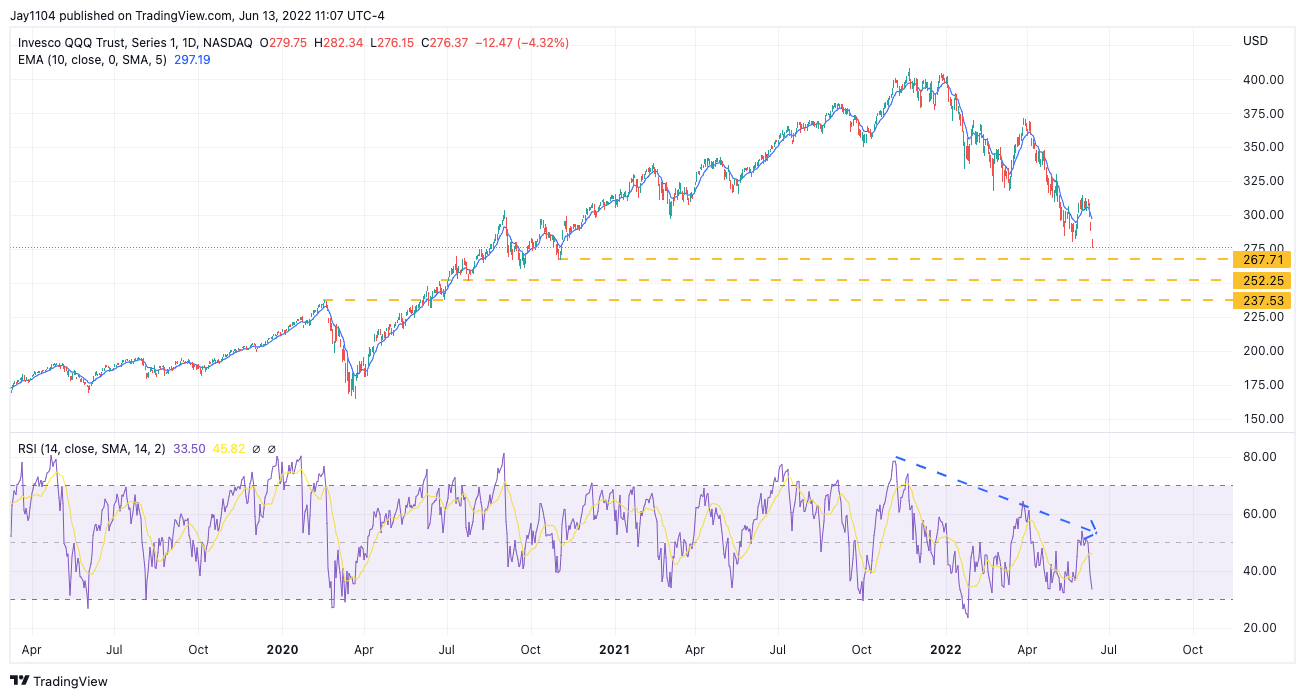
Trading View
At this point, valuations in the Nasdaq are still too high, given where yields are. Spreads need to widen more to account for the risks that are now presented in the market due to the uncertain path of the inflation rate and Fed monetary policy.
Join Reading The Markets Risk-Free With A Two-Week Trial!
Investing today is more complex than ever. With stocks rising and falling on very little news while doing the opposite of what seems logical. Reading the Markets helps readers cut through all the noise delivering stock ideas and market updates, looking for opportunities.
We use a repeated and detailed process of watching the fundamental trends, technical charts, and options trading data. The process helps isolate and determine where a stock, sector, or market may be heading over various time frames.
To Find Out More Visit Our Home Page

Be the first to comment