

phive2015
The Invesco QQQ ETF (NASDAQ:QQQ) recorded a draw-down of over -37% between its 2021 peak of $406.17 and the 52-week low of $254.26 recorded on October 13, 2022. This draw-down is even steeper than the 2020 pandemic draw-down, making it the sharpest sell-off since the Great Financial Crisis.
QQQ recovered sharply from its recent low and appears to have strong support around $260. Although stocks remain vulnerable in an environment of tightening monetary policy and slowing global growth, there is a favourable set-up emerging to buy QQQ for a short-term trade.
Reversal in downtrends?
The Average Directional Index, or ADX, measures the strength of a trend. A rising figure above 25 indicates the prevailing trend is getting stronger.
The rising ADX for QQQ in the weekly timeframe confirms that the intermediate downtrend remains intact. The key resistance level to consider is the 40-week exponential moving average.
QQQ 5-year Chart, Weekly timeframe (Created by author using data from stockcharts.com, 23 October, 2022)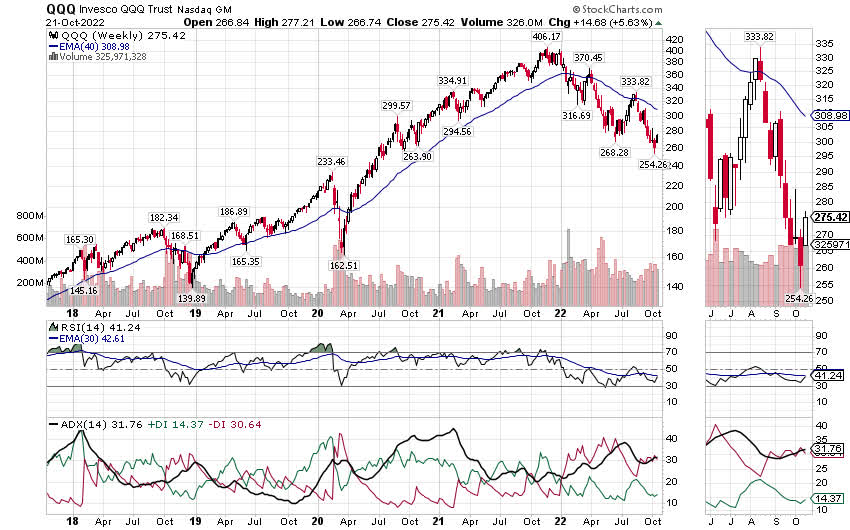
Meanwhile, ADX is falling in the daily timeframe. This suggests that the short-term downtrend is weakening. One key resistance level will be the 55-day exponential moving average, which is currently at $286. Two daily closes above the 55-day moving average would signal a reversal in the short-term downtrend is highly likely.
QQQ 1-year Chart, Daily timeframe (Created by author using data from stockcharts.com, 23 October, 2022)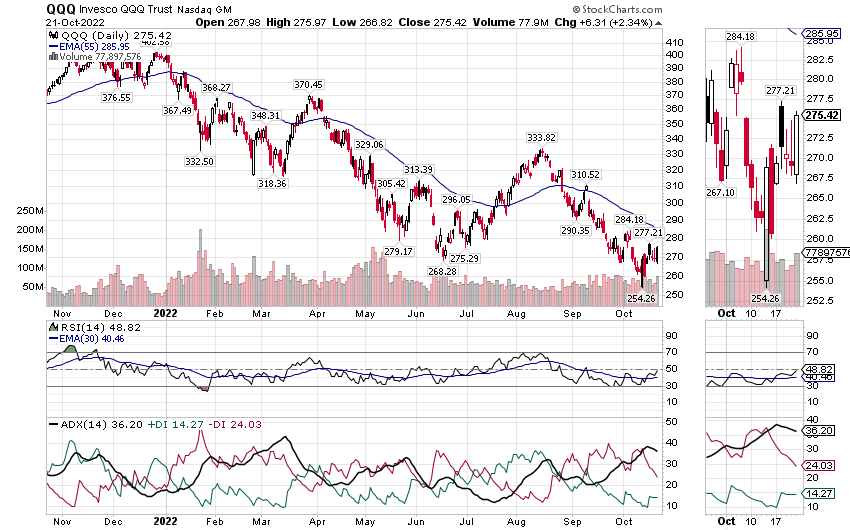
Clear support near $260
Point and figure charts help us determine support and resistance levels. Using the 2% box size by 3-box reversal configuration, we can observe a clear support level at $263.32. Price would have to close below $258.16 at least once to break this support level. A second close below this level would likely confirm that price has broken through support.
QQQ Point and Figure 2pct x 3 (Created by author using data from stockcharts.com, 23 October, 2022)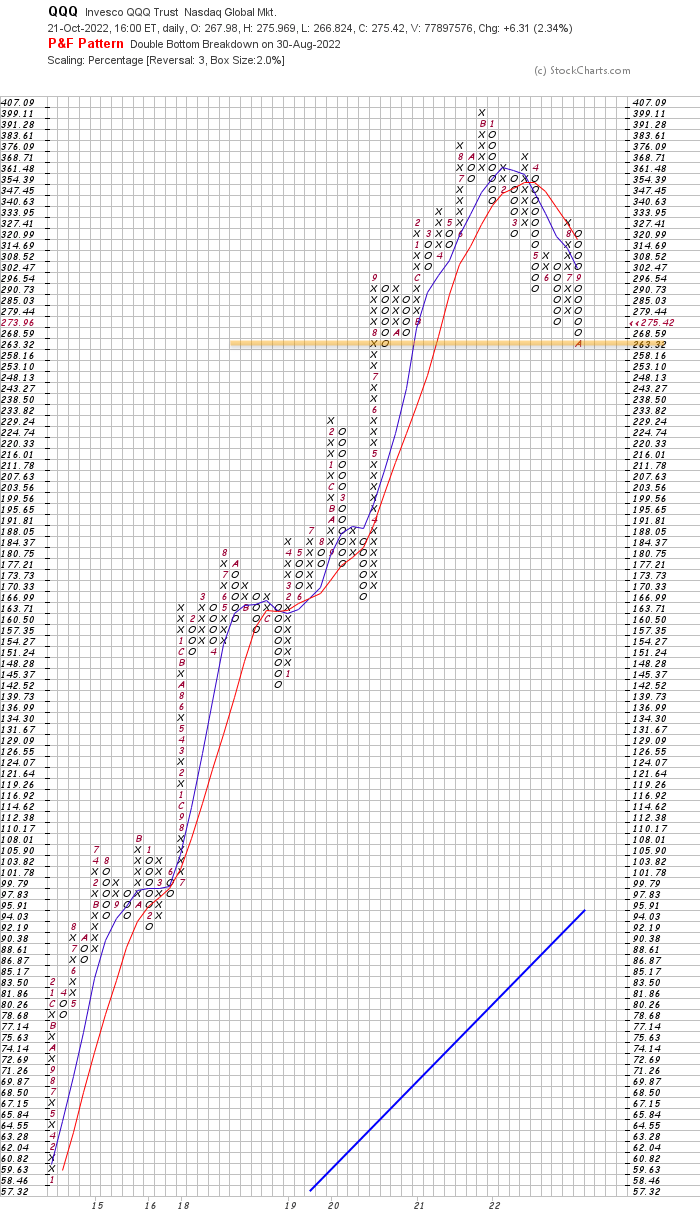
We can find more significant support and resistance levels by increasing the box size from 2% to 3%. The support and resistance levels we identify in this configuration are potentially more significant since they will likely remain intact for longer. In the new configuration, we see the support level at $268.43. Price would need to close below $260.62 to break this support level:
QQQ Point and Figure 3pct x 3 (Created by author using data from stockcharts.com, 23 October, 2022)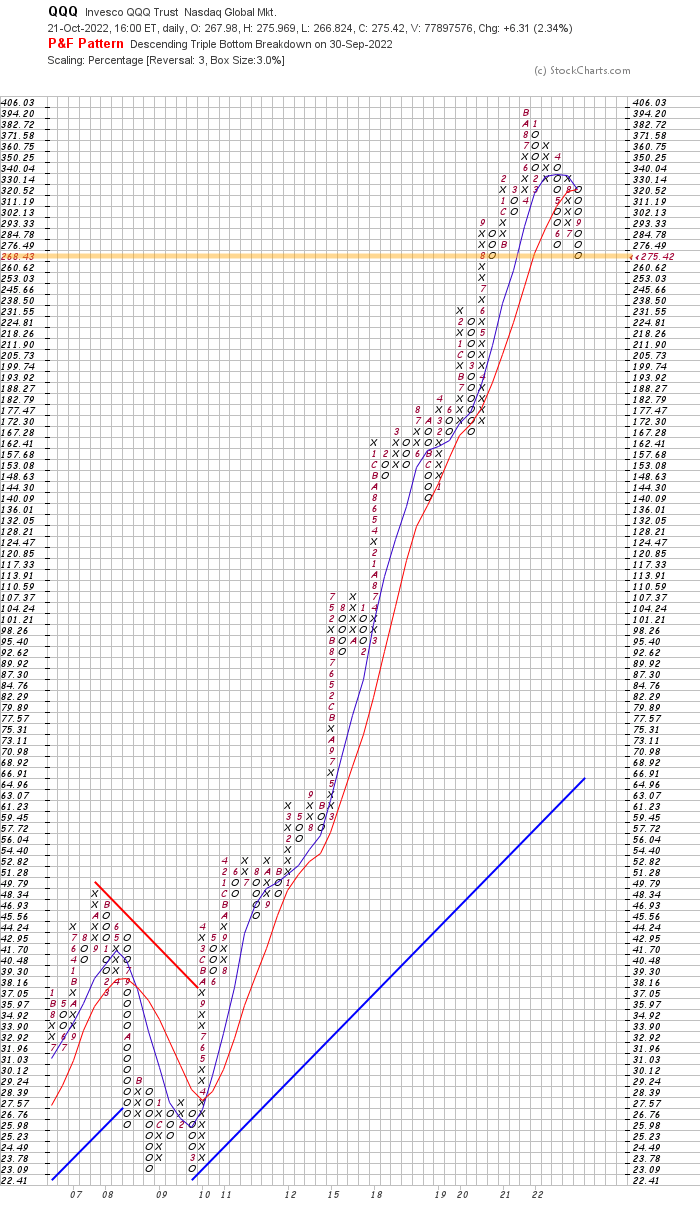
From these configurations, we can see there is strong support around the $260 level. It would therefore take a significant event or change in assumptions for QQQ to close below $260. Should this happen, it would make sense to close the trade and wait for QQQ to either fall to the next support level or establish a new one.
Improving breadth
The below 1-year chart shows the percentage of stocks in the Nasdaq 100 index above their 200-day moving average. The 200-day moving average represents the long-term trend.
Nasdaq 100 Stocks Above 200-day Moving Average, 1-year (Created by author using data from stockcharts.com, 23 October, 2022)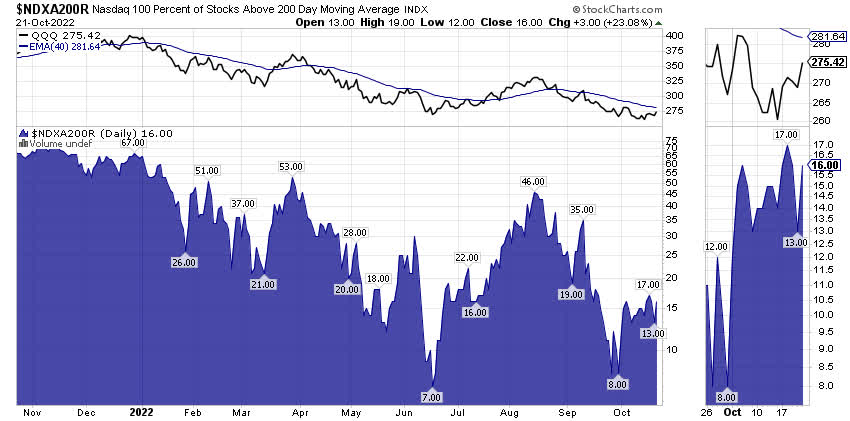
Although only 16% of Nasdaq 100 stocks are currently above their 200-day moving average, the percentage of stocks above their 200-day moving average bottomed in June, 2022. This means we can observe a divergence between the percentage of Nasdaq 100 stocks above this moving average and the price of QQQ, which tracks the index. The former recorded higher lows while the latter was making new lows. Such divergences tend to occur prior to important reversals in trend.
We can observe a similar divergence between QQQ and the percentage of Nasdaq 100 stocks above their 50-day moving average, which represents the short-term trend. In the below chart, the percentage of stocks above their 50-day moving average bottomed in September at just 2%. When QQQ made its 52-week low, that percentage of stocks below their 50-day moving average was 7%.
Nasdaq 100 Stocks Above 50-day Moving Average, 1-year (Created by author using data from stockcharts.com, 23 October, 2022)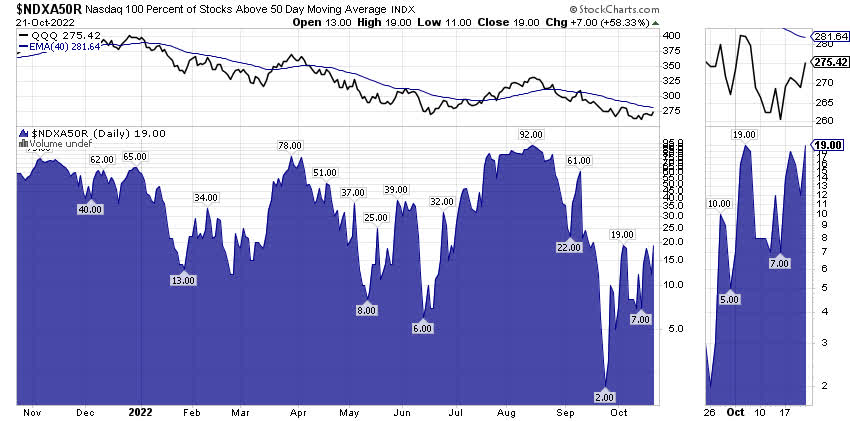
Healthy performance versus treasuries
Tracking the performance of stocks versus treasuries can help us anticipate enduring reversals in trend.
Stocks and treasuries tend to have an inverse correlation to one another since investors allocate more capital to stocks when the economy is growing and invest more in treasuries when the economy is contracting. This means we can get long periods where stocks outperform bonds and vice versa.
We can track this relative performance of stocks versus bonds with a Relative Strength chart of QQQ versus the iShares 20+year US Treasury Bond ETF (TLT):
QQQ vs TLT, 5-year Chart, Weekly Timeframe (Created by author using data from stockcharts.com, 23 October, 2022)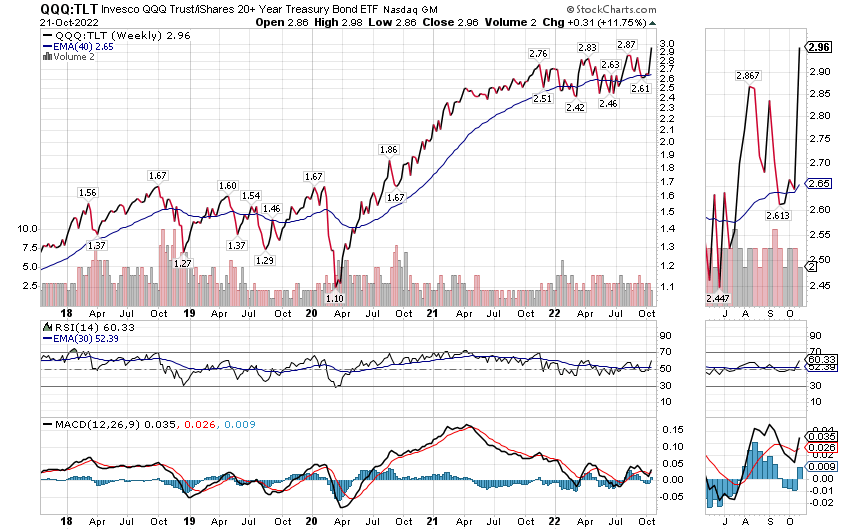
We can observe two indicators in favour of QQQ from the weekly timeframe. First, QQQ:TLT is rising to higher highs. This implies that stocks have more favourable momentum relative to bonds. Second, the Relative Strength Index, or RSI, for QQQ:TLT is rising but far from overbought according to conventional parameters and interpretation.
If we switch to the daily timeframe, we can observe one additional favourable indicator and one cautionary signal.
QQQ vs TLT, 1-year Chart, Daily Timeframe (Created by author using data from stockcharts.com, 23 October, 2022)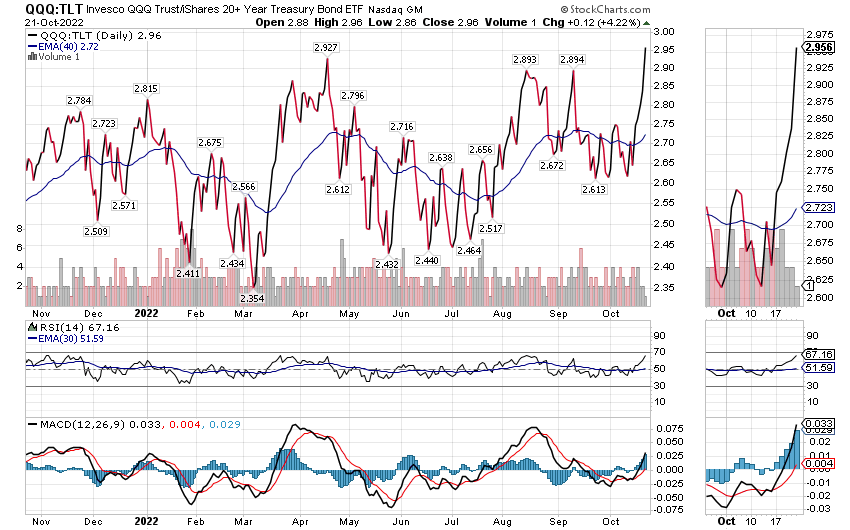
The favourable indicator is the rising Moving Average Convergence Divergence, or MACD. We can see this from the increasing size of the bars in the MACD histogram, which illustrates the difference between the MACD line and the signal line. This implies rising positive momentum.
The cautionary signal comes from RSI, which is approaching exhaustion in the daily timeframe. This means the outperformance of stocks versus treasuries may stall in the short-term.
Rising inflation expectations can hurt stocks
Stocks rallied sharply on Friday, 22 October after the so-called ‘Fed whisperer’ Nick Timiraos published an article shortly before the trading day started. The WSJ journalist wrote that the Federal Reserve Board would “debate the size of future hikes” after raising their policy rate by 0.75% in their November meeting.
I anticipated such a knee-jerk reaction in a recent article. However, this relief rally could reverse if the Fed follows an important signal from the bond market that occurred on the same day.
Although the yield on the 2-year US Treasury note fell on Friday, the yield on the 30-year US Treasury bond rose sharply to a higher high for the cycle. When long-term rates rise more than short-term rates, the impact on the yield curve is called a bear steepening. This tends to happen during periods of rising inflation expectations because investors want to reduce interest rate risk.
As I wrote in another article, the Fed should avoid a premature reprieve in policy tightening if they want to bring inflation down. Any hint that the Fed will raise their policy rate by more than 1.25% over the next two meetings will likely send stocks back to their recent lows.
Trade set-up
Given the clear support level, encouraging signs from breadth and QQQ’s relative strength versus TLT, investors could take advantage of a decline below $266 with the following trade:
-
Ideal entry price: $264-$266
-
Take-profit: $282
-
Stop-loss: $257-258 (at least one daily close)
-
Timeframe: 5 to 42 trading days
I would not chase the recovery in QQQ since downtrends across multiple timeframes remain intact. Instead, it is more prudent to buy QQQ as close as possible to its well-defined support level to improve the reward-to–risk ratio of this trade.
What could go wrong with this trade?
Dozens of the largest US companies will report their 3Q22 results during the week starting Monday, 24 October. The list includes important Nasdaq 100 components such as Apple, Microsoft, Amazon and Meta. If most of these companies report worse than expected results and follow up with cautionary guidance, QQQ could easily break below its support level.
Another risk would be expectations that monetary policy will tighten more than currently expected. Catalysts for this could be the announcement of Core PCE and/or CPI rates on 28 October and 10 November respectively or the release of October’s labour data on Friday, 4 November. Should these figures come out hotter than expected, it may force the Fed to raise their policy rate by at least 1.50% in total over the next two meetings with further hikes in 2023.
Finally, another risk is that valuations may have to compress further to reflect a possible recession in 2023. The chart below shows that the forward P/E ratio for the S&P 500 Technology Index is close to the trough reached in 2020 but far from the depressed valuations reached during the GFC. If investors begin anticipating a severe global recession in 2023, valuations for technology stocks could still fall much further.
Forward PE Ratios, 1990 to 2022 (Yardeni.com, 23 October, 2022)
Conclusions
QQQ recently recorded its sharpest draw-down since the Global Financial Crisis. Although risks related to earnings and inflation could push QQQ to new lows, a strong support level now exists near the $260 level. We can also observe encouraging breadth signals and signs that the short-term downtrend is losing strength. Investors could therefore consider buying QQQ below $266 in anticipation that it extends its recent recovery over the next 5 to 42 days.
Be the first to comment